Auditory brainstem response latency in noise as a
marker of cochlear synaptopathy
by
Golbarg Mehraei
. .
Submitted to the The Harvard-MIT Division of Health Sciences and
Technology
in partial fulfillment of the requirements for the degree of
Doctor of Philosophy in Health Sciences and Technology
at the
MASSACHUSETTS INSTITUTE OF TECHNOLOGY
February 2016
©
Massachusetts Institute of Technology 2016. All rights reserved.
,.---..._
Signature redacted
Author ..
Th~· H~;~1¥Ai1; Di~i~· ~f "H~~i~h· s~;~~~~~ -~~d· T~~h~~i~~
S .
1gna ure re ace
t
d
t
d
November 16, 2015
Certified by .
_
... .
-/
/
Barbara Shinn-Cunningham, PhD
Director,~r
for Computational Neuroscience and Neural
Technology /Professor, Biomedical Engineering, Boston University
Signature
redaCted/upervisor
Accepted by . . . .
. ... .
/ J
Emery N. Brown, MD, PhD
Director~arvard-MIT
Program in Health Sciences and
Technology /Professor of Computational Neurosciences and Health
Sciences and Technology
-Auditory brainstem response latency in noise as a marker of
cochlear synaptopathy
by
Golbarg Mehraei
Submitted to the The Harvard-MIT Division of Health Sciences and Technology on December 11, 2015, in partial fulfillment of the
requirements for the degree of
Doctor of Philosophy in Health Sciences and Technology
Abstract
Communication in environments with multiple competing sound sources can be challenging, even for listeners with normal hearing thresholds (NHT). This difficulty in “normal" listeners is thought to arise from central sites of the auditory system with the assumption that sound encoding at the auditory nerve (AN) is robust. Despite this assumption, growing evidence from animal and human studies suggests that acoustic exposure, too modest to elevate hearing thresholds, can nonetheless cause “hidden hearing loss" that interferes with coding of supra-threshold sound. In animal studies, such noise exposure leads to cochlear synaptopathy (death of auditory nerve fibers or ANFs); however, there is no clinical test of synaptopathy in humans. In animals, synaptopathy reduces the amplitude of auditory brainstem response (ABR) wave-I. Unfortunately, ABR wave-I is difficult to measure in humans, limiting its clinical use.
Here, using behavioral, otoacoustic, and electrophysiological measures in humans and mice in conjunction with computational models of sound processing by the auditory periphery and brainstem, we show that the effect of masking noise on the latency of the more robust ABR wave-V mirrors changes in ABR wave-I amplitude. In our human cohort, the effect of noise on wave-V latency predicts perceptual temporal sensitivity. Further, we show evidence that ABR wave-V latency in forward masking may be affected by ANF loss and is predictive of a listener’s performance in a perceptual task related to speech intelligibility in noise. Our results suggest that measures of the effects of masking on ABR wave-V latency can be used to diagnose ANF survival in humans.
Thesis Supervisor: Barbara Shinn-Cunningham, PhD
Title: Director, Center for Computational Neuroscience and Neural
Acknowledgments
I would like to start by thanking my advisor, Barbara Shinn-Cunningham, who has taught me many lessons that I could not have learned in any classroom. Barb gave me the freedom to pursue and develop my ideas. Her mentorship and guidance has helped me become a better research scientist and it’s difficult to articulate my gratitude of having her as a mentor and friend.
I thank my thesis committee members, Charles Liberman, Bertrand Delgutte, and Dimitrios Pantazis for their valuable feedback and criticism throughout the development of the thesis.
This work has truly been a collaborative effort. First, I would like to thank Ann Hickox for sharing her animal data and guiding me through the analysis. My sincere gratitude to Andreu Parades-Gallardo and Hannah Goldberg for helping me collect data. I would also like to thank Torsten Dau for his mentorship during my time in his lab.
I am very thankful to be part of the Speech and Hearing Bioscience and Technology (SHBT) community, and want to thank the professors and instructors for their dedication to the program and students. My SHBT class, thank you for the support and encouragement through the first couple of years.
To my colleagues at the Auditory Neuroscience Lab, thank you for welcoming me as a friend and showing me that research is supposed to be fun and exciting. I very grateful for all the collaborations and many valuable discussions. I particularly thank Hari Bharadwaj and Sarah Verhulst for paving the way for my thesis through their research. Our many discussions were critical in shaping the ideas in this thesis.
To my dear friends, thank you for all the fun and support throughout the years of our friendship. I have learned so much from you and am grateful to have such amazing friends.
Finally, I want to thank my family for all their love and encouragement. To my parents, Bahar and Parviz, thank you for instilling in me that learning is important
This doctoral thesis has been examined by a Committee of the
Department of Health Science and Technology as follows:
Professor M. Charles Liberman . . . .
Chairman, Thesis Committee
Director, Eaton-Peabody Laboratories
Professor Barbara Shinn-Cunningham. . . .
Thesis Supervisor
Professor of Biomedical Engineering, Boston University
Professor Bertrand Delgutte . . . .
Member, Thesis Committee
Professor of Otology and Laryngology, MEEI
Dimitrios Pantazis . . . .
Member, Thesis Committee
Research Scientist, Director of MEG lab, McGovern Institute for Brain
Research
Contents
1 INTRODUCTION AND BACKGROUND 17
1.1 Acoustic overexposure in the “normal” hearing . . . 17 1.2 Supra-threshold coding of sound . . . 19 1.2.1 Encoding of sound via auditory nerve fibers . . . 19 1.2.2 Importance of temporal coding on auditory perception . . . . 20 1.3 Auditory brainstem response . . . 21 1.4 Forward masking ABR . . . 23
2 SPECIFIC AIMS AND RATIONALE 27
2.1 Aim I. Understanding individual differences in sensory coding of listeners with NHTs . . . 27 2.2 Aim II. Modeling ABR wave-V latency changes in noise . . . 28
3 METHODS 31
3.1 Measures of ABR, temporal coding, and cochlear mechanics . . . 31 3.1.1 Participants . . . 32 3.1.2 Envelope interaural timing difference . . . 32 3.1.3 Auditory brainstem response measures in noise and quiet . . . 34 3.1.4 Click-evoked Otoacoustic Emissions . . . 35 3.2 Animal measurements . . . 38 3.2.1 Noise exposure . . . 38 3.2.2 Physiology: Auditory brainstem response and distortion
3.2.3 Histology: synaptic ribbon counts . . . 40
3.3 Forward masking . . . 41
3.3.1 Participants . . . 41
3.3.2 Pure Tone Thresholds . . . 41
3.3.3 Forward masking behavioral experiment . . . 43
3.3.4 Forward masking ABR . . . 43
3.4 Statistical tests . . . 44
4 EXPERIMENTAL RESULTS 47 4.1 ABR in noise . . . 47
4.1.1 Click-evoked otoacoustic emissions . . . 48
4.1.2 Wave-V latency, wave-I amplitude and temporal acuity in humans . . . 49
4.1.3 Wave-IV latency, wave-I amplitude and cochlear synaptopathy in mice . . . 54
4.2 Forward masking . . . 58
4.2.1 Behavioral vs. physiological forward masking . . . 59
5 MODELING ABR IN NOISE AND FORWARD MASKING 67 5.1 Background and motivation . . . 67
5.2 Model descriptions . . . 69
5.2.1 Acoustic Stimulus . . . 69
5.2.2 Auditory nerve model . . . 69
5.2.3 Brainstem model . . . 71
5.3 ABR in noise model simulations . . . 73
5.3.1 Auditory nerve . . . 74
5.3.2 ABR simulation using unitary response . . . 77
5.3.3 Brainstem response . . . 80
6 DISCUSSION 89
6.1 ABR in noise . . . 89
6.1.1 Mechanisms of ABR wave-V latency shift in noise . . . 90
6.1.2 Effects of central auditory changes to ABR latency . . . 91
6.2 Cochlear synaptopathy of low-SR fibers . . . 92
6.3 Forward Masking . . . 93
6.3.1 Effects of low-SR fiber deafferentation on the CAP forward masking recovery function . . . 93
6.3.2 Effects of forward masking on ABR wave-V latency . . . 94
6.3.3 Forward masking detection thresholds . . . 95
6.3.4 Neural correlates of forward masking . . . 97
6.4 Modelling Efforts . . . 98
List of Figures
1-1 Neural generators of ABR . . . 22
1-2 Forward masking and it’s effect on the CAP and ABR wave-V latency 25 3-1 Construction of transposed stimuli for ITD task . . . 33
3-2 Click-evoked otoacoustic emission sample . . . 37
3-3 Pure-tone thresholds for forward masking participants . . . 42
4-1 Click-evoked otoacoustic emissions summary . . . 48
4-2 Sample ABR in noise . . . 50
4-3 ABR wave-V latency change in noise correlates with envelope ITD sensitivity . . . 52
4-4 ABR wave-V latency shift in noise vs. the cost of ITD thresholds at a 2kHz carrier . . . 53
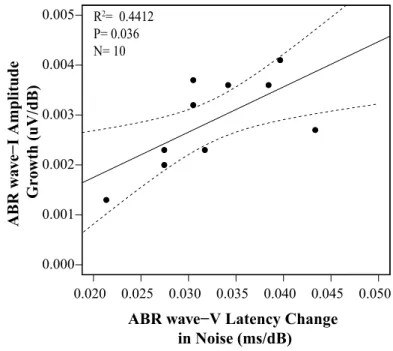
4-5 ABR wave-I growth vs. ABR wave-V latency shift with noise level . . 54
4-6 Synapse ribbon count and ABR wave-I growth in mice . . . 56
4-7 Mice ABR wave-IV latency shift in noise . . . 57
4-8 DPOAE thresholds in mice . . . 58
4-9 Forward masking ABR samples . . . 63
4-10 Forward masking ABR wave-V latency vs. forward masking detection thresholds . . . 64 4-11 Change in ABR wave-V latency vs. forward masking threshold recovery 65 4-12 Change in forward masking ABR wave-V latency vs. amount of
5-1 Overview schematic of Zilany et al. 2009 and 2014 model . . . 70 5-2 Overview schematic of Verhulst et al. 2015 model . . . 72 5-3 Summary of functional cochlear nucleus and inferior colliculus model
of Nelson and Carney 2004. . . 73 5-4 Simulated population auditory nerve response of low and high-SR fibers
in noise . . . 75 5-5 Contribution of low-SR fibers to auditory nerve population response
with increasing noise level . . . 76 5-6 Auditory nerve latency in noise . . . 77 5-7 Comparison of excitation pattern change with increasing noise level
across models . . . 78 5-8 Auditory brainstem response simulation using unitary response . . . . 79 5-9 Simulated cochlear nucleus response with low and high-SR fibers inputs 80 5-10 Simulated inferior colliculus response with low and high-SR fibers inputs 81 5-11 Model neurogram of the auditory nerve and inferior colliculus to click
stimulus in noise . . . 83 5-12 Peak latency response of cochlear nucleus and inferior colliculus model
in noise . . . 84 5-13 Auditory nerve model of forward masking time course . . . 86 5-14 Cost of preceding masker on simulated auditory nerve probe response 87 5-15 Simulated compound action potential growth in forward masking . . 88
List of Abbreviations
ABR . . . Auditory brainstem response AVCN . . . Antroventral Cochlear Nucleus 2AFC . . . Two alternatives, forced choice AN . . . Auditory nerveANF . . . Auditory nerve fiber
APD . . . Auditory processing disorder BM . . . Basilar membrane
CF . . . Characteristic Frequency CN . . . Cochlear nucleus
CAP . . . Compound action potential
CAPD . . . Central auditory processing disorder COAE . . . Click-evoked otoacoustic emissions DPOAE . . . Distortion product oto-acoustic emission EEG . . . Electroencephalogram
EFR . . . Envelope following response ENV . . . Envelope
ERB . . . Equivalent rectangular bandwidth FFR . . . Frequency following response HI . . . Hearing impairment
HL . . . Hearing level IHC . . . Inner Hair Cell IC . . . Inferior colliculus
LL . . . Lateral Lemniscus ME . . . Middle Ear
MOC . . . Medial olivocochlear complex MPI . . . Masker to probe interval MSO . . . Medial Superior Olive NHT . . . Normal hearing thresholds PCA . . . Principal component analysis peSPL . . . Peak sound pressure level SNR . . . Signal-to-noise ratio SOC . . . Superior Olivary Complex SPL . . . Sound pressure level
SR . . . Spontaneous (discharge) rate TFS . . . Temporal fine structure UR . . . Unitary response
Chapter 1
INTRODUCTION AND
BACKGROUND
1.1 Acoustic overexposure in the “normal” hearing
Communication in situations where multiple sound sources compete for attention can be challenging, even for listeners who have audiometrically normal hearing threshold (NHT). Indeed, as many as 5-15% of adult patients seeking audiological help for this difficulty turn out to have normal audiometric thresholds [59, 48]. Such listeners are often diagnosed with “central auditory processing disorders” (CAPD/APD, [20]) reflecting the assumption that sound is represented robustly in the AN [48, 78] and that deficits arise from more central processing centers.
In contrast to this assumption, recent animal studies reveal that noise exposure causing only reversible, temporary threshold shifts, can nevertheless produce an immediate and permanent loss (herein referred to as “synaptopathy”) of up to 50% of the synapses and cochlear-nerve terminals innervating inner hair cells (IHCs; [58, 36, 68]). Aging also appears to reduce the auditory nerve fiber (ANF) population independent of hair cell loss [106, 107, 73]. Crucially, even large reductions in the number of intact ANFs (e.g. as much as 85% loss) do not seem to affect audiometric thresholds in quiet [71], rendering this loss invisible to traditional
Models and recent data suggest that synaptopathy could degrade the coding of both temporal fine-structure (TFS) and temporal envelope (ENV) cues – cues that are important for everyday communication – in clearly audible, supra-threshold sounds [72, 6, 8, 5]. Indeed, recent human data reveals large individual differences in behavioral measures of temporal coding in NHTs listeners. These differences correlate with physiological brainstem measures that may be affected by ANF loss [91, 5]. Furthermore, listeners who have greater noise exposure history show reduced ANF response amplitudes (i.e., ABR wave-I amplitudes; [113]), consistent with the effects of noise-induced cochlear synaptopathy on ABR wave-I in animals.
ANFs with low spontaneous discharge rates (low-SR; SR<20 spikes/s) are particularly susceptible to neuro-degeneration caused by noise exposure and aging [106, 11, 36, 68] . These fibers, by virtue of the fact that they have higher thresholds than high spontaneous rate (high-SR; SR>20 spikes/s) fibers, increase the dynamic range of the auditory periphery [63]. In addition, low-SR fibers are thought to be important for hearing in noisy environments, as they are more resistant to masking by continuous background noise [22]. These facts elucidate why a selective low-SR ANF synaptopathy could lead to hearing loss that only reveals itself through perceptual difficulties when processing supra-threshold sound, even though it has no discernable effect on thresholds.
Motivated by these results, we hypothesize that the number of low-SR ANFs conveying information about supra-threshold sound varies across NHT listeners, resulting in differences in communication ability. AN degeneration may be widespread in humans, evidenced by post-mortem temporal bone analyses [73]. A noninvasive test that reveals the fidelity of the peripheral representation of supra-threshold sound, and that quantifies ANF loss, could have a major impact on evaluation and diagnosis of communication disorders amongst NHT listeners.
1.2 Supra-threshold coding of sound
1.2.1 Encoding of sound via auditory nerve fibers
ANFs are vital for encoding acoustic information about our environment. An ANF contacts a single IHC via a single synapse. At each synapse, an electron-dense ribbon sits near the pre-synaptic membrane surrounded by a halo of glutamatergic vesicles. Environmental sound entering the ear canal is funneled through the tympanic membrane, and middle ear, vibrating the stapes, and leading to cochlear traveling waves. Along the length of the cochlea are sensory cells, the IHCs that detect vibration within the cochlea via stereocilia bundles at their apical surface. The vibrations caused by the cochlear traveling wave deflect IHC stereocilia, opening mechanoelectric transduction channels that lead to a graded change in the IHC membrane potential. This sound-driven receptor potential causes an influx of calcium at the base of the IHC where the ANFs synapse. The calcium influx increases the probability of glutamate release into the synaptic cleft. The release of neurotransmitter leads to the generation of action potentials in an ANF. This AN response to sound then ascends through several nuclei of the brainstem, midbrain and cortex, to eventually elicit an auditory percept [37].
ANFs can be divided into two groups classified by their spontaneous rate (SR; i.e., the spike rate in the absence of intentionally introduced sound). Fibers with low-SR have thinner axons, fewer mitochondria, and predominately innervate the modiolar side of the IHC. In contrast, high-SR fibers, have thicker axons, more mitochondria, and synapse onto the pillar side of the cell [65]. ANF groups also differ in their sensitivity to sound. High-SR fibers have the lowest thresholds, and low-SR fibers have the highest. In quiet environments, high-SR fibers dominate encoding of sounds. However, as sound level increases to 20-30dB above threshold, the average discharge rate of high-SR fibers saturates and low-SR fibers begin to respond. The group-related differences in threshold sensitivity widen the dynamic range and may be important for intensity coding in the auditory system where level discrimination abilities are near-constant over a range of 100dB or more [33, 120].
ANF groups also differ in their contribution to hearing in noisy environments. High-SR fiber activity is relatively easy to mask with continuous noise because these fibers are so sensitive to sound. Their continuous activation even by near-threshold noise may cause vesicle depletion, which prevents them from responding to other signals that might be present [22, 21]. In contrast, by virtue of their higher thresholds, the lower-SR fibers are more resistant to background noise. Thus, with increasing levels of continuous masking noise, lower-SR fibers likely become increasingly important to the encoding of acoustic signals, as they will show the largest changes in average discharge rate in response to transient supra-threshold stimuli [127].
1.2.2 Importance of temporal coding on auditory perception
Although different perceptual attributes of natural sound are encoded by different spectro-temporal cues, many depend on reliable timing information. The AN encodes temporal information in two forms; the temporal fine structure (TFS), corresponding to the timing of the nearly sinusoidal narrowband carrier fluctuations, and the slower temporal envelope of that carrier. ANFs in the low-frequency cochlear regions encode both TFS and temporal envelope; their spike pattern is phase-locked to the carrier and their instantaneous firing rate locked to the envelope. At higher frequencies, ANFs do not lock to the TFS; however, temporal information is conveyed by phase-locking to envelope fluctuations. Such encoding mechanisms are important for the computation of interaural time differences (ITD), used for spatial perception of sound. While perceptually, TFS information in low-frequencies is the dominant perceptual cue determining perceived location [124], for broadband and high-frequency sounds, ITDs can be conveyed by the envelope alone [4]. Additionally, the encoding of the temporal envelope of sound may play a significant role in space perception in everyday settings such as rooms, where reverberant energy distorts TFS cues [7, 25]. The coherence of the temporal envelope across channels helps to perceptually bind together different acoustic constituents of an object in the auditory scene [31, 108]. Coding
information (see [90], for a review). Thus, a range of temporal features in both TFS and envelopes is necessary to enable a listener to parse mixture of sounds, select a sound source of interest, and analyze its meaning.
In everyday settings, the auditory system is often required to analyze temporal information at supra-threshold sound intensities. Further, everyday settings typically contain competing sound sources and reverberant energy, which degrade the temporal structure of the sound reaching a listener’s ear. This degradation may render spatial information about a single source such as ITD diffuse and make speech less intelligible [114, 49].
Given that convergence of multiple fibers underlies an enhancement in the fidelity of temporal coding at higher nuclei along the auditory pathway [50, 86, 52], it is likely that a decrease in the number of fibers making up the auditory nerve population will degrade temporal coding [72] and lead to perceptual difficulties when trying to understand speech in challenging settings. In addition, considering the relative robustness of low-SR fibers to masking [22, 21, 127] and better synchrony to amplitude-modulations at moderate to high sound levels [51], a selective low-SR neuropathy would further increase the likelihood of perceptual difficulties in processing supra-threshold sound.
1.3 Auditory brainstem response
The present study focuses on the ABR as a potential measure of cochlear synaptopathy in humans. The ABR, which is often measured with transient stimuli, is a series of vertex-positive waves that represent far-field activity produced by onset responses of neural elements along the auditory brainstem pathway. The ABR is critically dependent on the synchronous activity of a large number of the responding neural units to produce a detectable and repeatable response. At high stimulus levels, the ABR consists of seven peaks, each attributed to different generator sites along the brainstem, as shown in Fig.1-1 [76, 88]. As such, it is a useful clinical tool for separating peripheral (cochlear-eighth nerve-ABR wave-I) from central
(brainstem) changes [19]. I , II Auditory Nerve Cochlear Structures V Lateral Lemniscus IV Superior Olivary Complex Dorsal Cochlear Nucleus V, VI, VII Inferior Colliculus Medial Geniculate Body
A1, Auditory Cortex
I II III IV V VI VII III Ventral Cochlear Nucleus
Figure 1-1: Neural generators of the seven waves in the auditory brainstem response. ABR wave-I is often the smallest wave in human measurements as shown and is believed to be generated at the IHC and AN synapse. ABR wave-V, the most robust wave in humans, is generated in the lateral lemniscus and/or inferior colliculus.
In animal studies, changes in supra-threshold amplitudes of ABR wave-I are well correlated with cochlear synaptopathy, so long as the cochlear amplifier is undamaged [58]. Although ABR wave-I amplitude can be a useful objective measure of ANF loss in animals, there is a great deal of within-subject variability in this response in humans; thus, making it challenging to use clinically. One approach to reducing this variability would be to measure the growth rate of wave-I amplitude with stimulus level. Nonetheless, it is difficult to obtain a robust ABR wave-I at low
stimulus levels in humans. In contrast, ABR wave-V, generated in the Lateral Lemniscus and/or Inferior Colliculus (LL, IC; Fig.1-1 ), is a more robust response in humans and can be recorded at low stimulus levels and in the presence of background noise. However, ABR wave-V magnitude does not seem to be affected by cochlear synaptopathy, potentially due to gain control mechanisms of the central auditory system [107].
Another approach is to evaluate ABR latency, specifically V. In quiet, wave-V latency decreases monotonically with increasing stimulus level [23], in part because cochlear excitation spreads towards high-frequency cochlear regions with increasing level, and high-frequency regions have shorter latencies [83, 46]. In contrast, when a fixed-level ABR-evoking stimulus (e.g., a click), is presented in background noise, mimicking some of the constraints faced by the auditory system in noisy real-world listening conditions, ABR wave-V latency increases with growing background noise level [12, 13, 16]. The underlying mechanisms of this latency shift with noise level are not fully understood, but are ascribed to synaptic and neural processes.
Here, we argue that the ABR wave-V latency shift with increasing noise level could reflect the recruitment of low-SR fibers because 1) the onset response latency of low-SR responses is delayed relative to that of high-SR fibers [100, 79, 11] and 2) low-SR ANFs are more resistant to background noise [22, 127]. If true, a selective loss of low-SR fibers should yield a smaller ABR latency shift with increasing noise level. Furthermore, if this latency measure reflects low-SR ANF loss, the rate at which it changes should correlate with perceptual measures of fine temporal encoding that rely on low-SR responses [5].
1.4 Forward masking ABR
Another systematic difference according to SR is the AN response recovery time to prior stimulation. In forward masking, the response to a stimulus (probe) is decreased by the presence of a preceding stimulus (masker). This type of non-simultaneous masking is believed to arise because of depletion of synaptic vesicles by the masker,
limiting the number of vesicles available to respond to the probe [45]. As the delay between the masker and the probe increases, the probe response recovers to control (i.e., no peceding masker). Animal studies show that low-SR fibers have a longer recovery time (>100ms) than that of high-SR fibers (<100ms) [95]. This difference has not only been shown on a single unit AN level but also on a population level. There is evidence of low and high-SR contribution to the recovery of the compound action potential (CAP, which represents the summed activity of the AN and is equivalent to ABR wave-I amplitude) from forward masking in humans and animal [96, 80]. The recovery of the CAP can be modeled by two separate exponential functions that characterize the fast and slow component of the recovery time course as shown in Fig.1-2. The fast time component of the CAP recovery predominately reflects the recovery of high-SR fibers whereas the slow time component of the CAP recovery function is believed to be low-SR dominated. A selective loss of low-SR fibers with age is shown to yield a faster recovery of the CAP [106].
Changes to CAP/ABR wave-I amplitude in forward masking could prove useful in teasing apart the loss of low-SR fibers. However, as mentioned earlier, ABR wave-I measurements are difficult to obtain and quantify. Thus, we wondered whether the change in wave-V latency as a function of masker to probe interval (MPI) would reflect loss of ANFs. In forward masking, as the probe-elicited ABR wave-I amplitude increases with increasing MPI, the wave-V latency subsequently decreases [57, 13, 9, 121]. We hypothesize that the low-SR contribution to forward masking not only slows down the recovery of the ABR wave-I amplitude but also that this reduced input translates to a wave-V latency that does not shift as much with MPI. Low-SR fibers deafferentation may yield a faster recovery of the probe-elicited ABR wave-I amplitude and thereby a greater change in ABR wave-V latency with increasing MPI. This will be more evident at shorter MPIs where both low and high-SR fibers contribute to the response. Indeed, there is some evidence that older NHT listeners and aged animals have a greater shift in wave-V latency in forward masking at short MPIs, in line with our hypothesis [9, 121].
2
Masker Probe
T
-5 0 5
Time re to onset of sound (ms) T 1 1.05 1.1 1.15 1.3 1.25 1.3 1.35 1.4 CAP re to 10 ms Gap 10 100 1000
Masker to Probe Interval (ms) Forward Masking CAP,
Masker=Noise (70dB), Probe= Chirp (90dB )
Fast Co mponent
Slow Component
Masker to probe Interval (ms)
● ● ● ● ● ● 0 50 100 150 200 0.0 0.5 1.0 1.5 2.0 ABR w av
e−V Latency Shift re Quiet (ms)
● ●
Forward Masking ABR wave-V Latency, Masker=Noise (70dB), Probe=Chirp (90dB) Fast Component Slow Componen t A B C
Figure 1-2: A: Forward masking is defined as a decreased probe response, depicted by a reduced CAP, following a preceding masker. At short masker to probe intervals (MPIs), not only is the CAP small but the ABR wave-V latency is delayed relative to the control (no preceding masker). As the gap between the masker and the probe increases, the CAP grows and the wave-V latency decreases. B: Model simulation of the relative change of the CAP with increasing MPI. The forward masking recovery function of the CAP can be characterized by two exponential functions with different time constants. At short MPIs <100ms), the CAP changes more rapidly, reflecting the recovery of the high-SR and low-SR fibers. This portion is defined as the fast time component of the CAP forward masking function. At MPI >100ms, the CAP changes more slowly, following the slow recovery of the low-SR fibers as the high-SRs have fully recovered by a MPI of 100ms. Model used [118]. C: In forward masking, as the MPI increases, the ABR wave-V latency shift relative to quiet decreases (absolute wave-V latency decreases). Similar to the CAP forward masking recovery function, the wave-V latency recovery function has a fast and slow component.
latency changes in young NHT listeners reflects differences in low-SR population size. Selective loss of low-SR fibers may help explain why some listeners have difficulty hearing in noisy environments. As such, to determine whether these differences predict perceptual measures related to temporal coding and speech intelligibility in noise, we chose to measure forward masking behavioral thresholds, a correlate of speech-recognition in interrupted noise [29].
Chapter 2
SPECIFIC AIMS AND RATIONALE
This thesis is dedicated to the study of individual differences in ABR latency in noise and forward masking among NHT listeners and how this timing is affected by ANF loss. The project is divided into two aims: first, characterizing supra-threshold fidelity in listeners with NHTs and comparing to measures of ABR and second, modeling ABR latency changes in noise. The results of the various experiments and modeling efforts provide evidence that a dominant contribution to individual differences in ABR latency in noise likely comes from differences in low-SR ANF population. Additionally, these differences in the ABR latency seem to predict an individual’s performance in perceptual tasks that are important when listening in complex environments.2.1 Aim I. Understanding individual differences in
sensory coding of listeners with NHTs
It is evident from past studies that there is large variability in performance on tasks relying on fine spectro-temporal cues in supra-threshold sound in listeners with NHTs [56, 102, 5]. We believe that differences in temporal coding fidelity in ascending ANFs help explain these variations in NHT listeners: such differences may arise due to variation in the population of ANF responding to sound, which may be the result of noise exposure or genetic factors that causes degeneration of ANFs. Our goal here is
to determine whether we can use clinical ABR latencies, specifically wave-V latency, to reveal ANF loss and ultimately predict an individual’s listening ability in noisy settings.
Here, we will quantify relationships amongst ABR and perceptual measures of supra-threshold coding for listeners with normal audiometric thresholds. Hypothesis: ABR wave-V latency changes in noise and in forward masking reflect low-SR ANF survival and vary significantly in NHT listeners with normal cochlear mechanics. If so, these individual differences in wave-V latency should be correlated with perceptual differences important for communication in noisy environments. We measured audiograms and click-evoked otoacoustic emission growth functions. In listeners with normal cochlear mechanics, we measured ABRs using clicks in quiet and in noise stimuli. ABRs were also measured using a forward masking paradigm using noise maskers and chirp probes. In the same listeners, we measured envelope interaural timing difference (ITD) sensitivity and forward masking detection thresholds.
2.2 Aim II. Modeling ABR wave-V latency changes
in noise
Latencies of ABR wave-V vary with increasing stimulus and noise level. Specifically, the ABR wave-V latency decreases by 1.5-2ms for a stimulus level increase of 40dB [23, 30] and increases by 1ms with growing background noise level over a 50dB range [12]. Past ABR models have largely focused on simulating latency changes with increasing stimulus level [23, 101]. Although they have been able to qualitatively account for latency changes, they underestimate the level dependency of click-evoked ABR wave-V latency [101]. A recent auditory model [118] predicts that wave-wave-V latency is sensitive to the number of responding ANFs. Although this model has been able to successfully capture ABR wave-V latency decrease as a function of increasing stimulus level, model predictions of ABR wave-V latency changes in noise have yet to be accomplished.
Based on recent model predictions and experimental results, we attempted to accurately simulate ABR wave-V latency increase with growing background noise and explore how preferential loss of different fiber types affects the change in latency in noise. Existing models were utilized and altered to simulate single-unit and population responses at different stages along the auditory pathway. Additionally, using the same models, we explored how selective loss of low-SR fibers affects the CAP recovery in forward masking and how that may translate to ABR wave-V latency changes with MPI.
Chapter 3
METHODS
3.1 Measures of ABR, temporal coding, and
cochlear mechanics
All measures were obtained with the participants seated in an acoustically and electrically shielded booth (single-walled Eckel C-14 booth, Cambridge, MA). For passive ABR measures, participants watched a silent, captioned movie of their choice, ignoring the acoustic stimuli. A personal desktop computer controlled all aspects of the experiment, including sound delivery and storing data. Special-purpose sound-control hardware (System 3 real-time signal processing systems, including D/A conversion and amplification; Tucker Davis Technologies, Gainesville, FL) presented sound through insert phones coupled to foam ear tips. ER-1 insert phones (Etymotic, Elk Grove Village, IL) were used for ABR wave-I and behavioral ITD measures. ER-10c earphones were used for the ABR in noise measurements to simultaneously record click-evoked otoacoustic emissions (COAE). All sounds were digitized at a sampling rate of 48.828 kHz. For the behavioral experiments, subjects responded by button presses.
3.1.1 Participants
Twenty four (nine female) subjects, aged from 20-40 years (mean=26.95), were recruited from the Boston University and Massachusetts Institute of Technology community. All subjects had pure-tone hearing thresholds better than 20dB HL in both ears at octave frequencies between 250 and 8000Hz. Subjects provided informed consent in accordance with protocols established at Boston University. Subject availability precluded some subjects from completing some measures.
3.1.2 Envelope interaural timing difference
To obtain a binaural measure of temporal coding, detection of ongoing envelope ITD was measured using a transposed tone with a carrier at either 2 or 4kHz and an envelope modulation frequency of 50Hz [4]. The carrier phase was identical in the two ears; the ITD was applied only to the 50Hz envelope. The 450ms stimulus was ramped with a 20ms cos2 rise-decay (simultaneously in the two ears) to minimize the use of onset cues. The stimulus level was set at 80dB SPL. Off-frequency notched-noise maskers, generated independently in each trial, were presented at an SNR of 10dB (broadband RMS) as illustrated in Fig.3-1, B. The off-frequency masker extended to 20Hz on the low-frequency side and 20kHz on the high-frequency side and served to attenuate off-frequency listening cues, including cues from distortion products. The bandwidth of the notch was set to the equivalent rectangular bandwidth (ERB) of the respective carrier frequency (i.e., ERB at 2kHz=240.58Hz and at 4kHz= 456.46Hz) [38]. To determine whether limiting listeners to use of within-channel timing information enhances individual differences in temporal coding, we tested an additional noise condition for the 2kHz carrier. A diotic noise, low-pass filtered at 1.3kHz, was presented with the stimulus (Fig.3-1, C) to preclude the listener’s use of any information at low frequencies such as distortion products [4]. Conditions were presented in alternating blocks. All noises were gated on 400ms prior to the first stimulus interval, and gated off 200ms after the third interval.
Time (ms) X
=
Frequency (Hz)
Magnitude
Low-Pass Noise Condition
Notched-Noise Condition
2000
A B
C
Figure 3-1: A. Schematic representation of the method used to generate transposed stimuli. A 50Hz sinusoid was half-wave rectified, low pass filtered (cutoff=2kHz), and transposed onto 2 or 4kHz carrier. B. Illustration showing the spectrum of the transposed tone presented simultaneously with a low pass noise. This condition was implemented for the 2kHz carrier. C. Spectrum schematic of transposed tone presented simultaneously with notched noise. This condition was used for both 2 and 4kHz carrier.
choice adaptive task (2AFC). Each interval, marked visually by a computer monitor, occurred at intervals of 800ms. The first interval always contained the stimulus with an ITD=0 and served as a reference interval. The listener’s task was to detect and identify the presence of an ITD (right ear leading) that was presented with equal probability in the second or third interval. A combination of nonparametric, 2-up 1-down, and parametric, maximum likelihood procedure (MLP) was used to determine the ITD threshold. The 2-up 1-down procedure [62] was used initially for 7 reversals. The listener was presented with a starting ITD of 900µs. The initial step size was 100µs. After 2 reversals, the step size was reduced to 50µs and 25µs after 4 reversals. The threshold estimation was then switched to the MLP [40]. In this procedure,
a set of psychometric functions with the same slope, attentional lapse rate, and chance level, but different midpoints were hypothesized. After each trial, the subject’s responses up to that trial were used to calculate the likelihood of each hypothesis (i.e., each psychometric function). The ITD of the next presented trial was chosen based on the 80.9% correct point on the psychometric function with the highest likelihood. This procedure was repeated until the ITD estimates of the last four trials were within an 80µs range of each other.
Each condition was repeated twice for a total of four blocks in each session. Additional blocks were presented if any of the runs for a condition were off by more than one standard deviation from the mean. The final ITD threshold was defined as the mean of the thresholds, discarding outliers.
3.1.3 Auditory brainstem response measures in noise and
quiet
Click-evoked ABRs were measured dichotically using a 32-channel EEG system (Biosemi Active II system, Amsterdam, Netherlands). The better ear was chosen for testing based on the subject’s audiogram. If there was no difference between the ears audiometrically, the left ear was chosen. ABRs were collected using a 80µs click presented at a rate of 10Hz via ER-10C insert earphones. A 20ms inter-click jitter was introduced to avoid the accumulation of any stationary interference including the 60Hz power-line noise.
ABR wave-V measures were recorded for five different click levels varying from 50-90dB peSPL in 10-dB steps. ABRs in noise were measured using a click presented at 80dB peSPL in broadband background noise varying from 42-82 dB SPL in 10-dB steps. The bandwidth of the noise was limited by the sampling rate used to generate the stimuli (i.e. 48kHz) and the frequency response of the earphones. Each condition had 3000 repetitions. Conditions were presented in randomly ordered blocks. The 32 channels were referenced to the average of the mastoid channels.
Power line noise (60Hz and harmonics) was removed by applying Thomson’s regression method for detecting sinusoids in signals as implemented in the Chronux toolbox [10]. The filtered data were then time-epoched from -10ms to 10ms relative to the onset of the stimulus. Bad channels and trials were removed by analyzing the distribution of the overall amplitude across channels and trials. Specifically, a channel or trial was removed if its cumulative amplitude was two standard deviations away from the mean of the distribution. The number of channels and trials were equalized across conditions for each subject. The averaged epoched response from all good channels were combined to yield an ABR.
The averaged across channel ABR peak-to-baseline amplitude and peak latency of waves-I and -V, respectively, were identified using visual overlay cursors on a computer screen. The slope of the wave-I amplitude with stimulus level, and of wave-V latency change with noise and stimulus level, was computed by fitting a straight line across the conditions in which the waveforms were identifiable. A minimum of three conditions where the ABR waves-I and V were clear was required for the linear fits.
3.1.4 Click-evoked Otoacoustic Emissions
To obtain an objective correlate of cochlear-mechanical compression, COAE were measured simultaneously with the ABR measurements using 80µs clicks at levels of 50-90dB peSPL in 10dB increments. Each click level was presented 3000 time. COAES were filtered using a 250-6000Hz bandpass filter as they are most reliable from 1000 to 3000Hz [34]. To obtain estimates that are robust to artifacts, trials were combined by calculating the sample by sample median instead of the mean. The spectrum of the COAE was computed and the magnitude was compared to the spectrum of the noise floor, defined as the difference between the odd and even trials (Fig.3-2).
To provide more frequency-specific information, CEOAE responses were band-filtered in octave-bands centered at 1000, 2000 and 4000Hz and the signal power was calculated for each band. The COAE growth function at each band is defined as the difference between the COAE power (in dB) and the input level. Across listeners,
60dB peSPL. As such, the amount of compression in each frequency band, defined as the slope of the COAE growth function using a linear fit on log-scale, was determined using COAEs at click levels of 70, 80, 90dB peSPL.
Frequency (Hz) -60 -50 -40 -30 -20 -10 0 Phase (radians) 1000 2000 3000 4000 5000 6000 Frequency (Hz) -80 -70 -60 -50 -40 -30 -20 -10 0 Magnitude (dB SPL) 1000 2000 3000 4000 5000 6000 C 0 5 10 15 20 25 −1 −0.8 −0.6 −0.4 −0.2 0 0.2 0.4 0.6 0.8 1 Time re onset (ms) Pressure (mPA)
COAE Time Waveform
A
B
Figure 3-2: Sample COAE of a 90dB peSPL click. A: Time waveform of COAE. B: Spectrum of COAE depicted in red and the noise floor in black. Notice that the COAE are strongest around the 1 to 2kHz frequency region. C: Phase of the COAE.
3.2 Animal measurements
The animal measurements were conducted by Ann Hickox during her PhD with Dr. M.Charles Liberman and were generously given to me to analyze. The animal subjects and methods have been previously described in detail in Hickox and Liberman (2014; [47]). In brief, CBA/CaJ male mice (Jackson Laboratories) were exposed in groups to moderate-level noise at 16-18 wks of age, and cage-mates served as unexposed age- and sex-matched controls. Measures of both cochlear and auditory neural function were recorded to assess the degree of recovery from noise exposure. Counts of synaptic ribbons per inner hair cell confirmed noise-induced loss of cochlear synapses. An additional assay, the masked ABR, was recorded in subsets of exposed and unexposed mice to investigate new physiological indicators of noise-induced cochlear synaptopathy, reported for the first time here. All procedures were approved by the Institutional Animal Care and Use Committee of the Massachusetts Eye and Ear Infirmary.
3.2.1 Noise exposure
Mice were exposed for 2 hours to octave-band noise (8-16kHz) at one of two levels, 100 or 94dB SPL. The 100dB “neuropathic” exposure in these mice, causes only transient threshold elevation and extensive cochlear synaptopathy and neural loss in the basal half of the cochlea [58]. The 94dB “non-neuropathic” exposure was designed to cause similar transient threshold elevation and no ANF loss [47], providing a control group for non-specific exposure-related effects. Mice were placed, awake and unrestrained, in an acoustically transparent cage within a small reverberant chamber. The noise waveform was digitally generated (fifth-order Butterworth filter), amplified (Crown Power Amplifier D75A), and presented with a compression driver (JBL model 2446H) through an exponential horn in the roof of the chamber.
3.2.2 Physiology: Auditory brainstem response and distortion
product otoacoustic emission
ABRs and DPOAEs were measured in the left ear of each mouse 6-10 weeks post-exposure, under ketamine/xylazine anesthesia (100mg/kg and 20mg/kg, respectively, via i.p. injection). A custom acoustic assembly containing two miniature dynamic speakers and an electret condenser microphone (Knowles FG-23329-P07) was placed within millimeters of the tympanic membrane for delivery of all stimuli and recording of DPOAEs. The assembly was calibrated using a 1/4-inch condenser microphone (Bruel & Kjaer), and each recording session began with in-ear calibrations. Stimulus generation and data acquisition were controlled by custom LabVIEW software on a National Instruments PXI system (16- or 24-bit sound cards).
To assess outer hair cell-based cochlear function, DPOAEs were recorded using primary frequencies f1 and f2 (f2/f1 = 1.2), where f2 = 8-45.3kHz in half-octave steps. For each set of primaries, levels L1 and L2 (L1-L2 = 10dB) were swept from L2 = 10-80dB SPL in 5-dB steps. Amplitude of the cubic distortion product 2f1-f2 was extracted from averaged ear canal spectra. DPOAE threshold was interpolated from amplitude input/output functions at 2f1-f2 = 5dB SPL.
To assess auditory brainstem function in quiet, ABRs were recorded using 4-ms tone-pips (0.5 ms cos2 rise-fall, alternating polarity, 40/s) at 32kHz. Levels were swept from 15-80dB SPL in 5-dB steps. At each level average waveforms were generated from 1024 presentations (512 stimulus pairs), amplified 10,000X, band-pass filtered from 0.3-3kHz and stored for offline analysis. Responses were differentially recorded from subdermal needle electrodes at the vertex and ventral edge of left pinna, with ground at the base of the tail. ABR wave-I growth functions were constructed using peak 1 amplitude at each level, defined as the difference between a 1-ms average of the pre-response baseline and the wave-I peak (with additional high-pass filtering to remove low-frequency baseline shifts).
Masked ABRs were recorded as for ABRs in quiet, using 32kHz tone pips at 60 and 80dB SPL. Broadband masking noise was generated and played with each
tone-pip presentation. The magnitude spectrum of the masking noise compensated for the CBA/CaJ mouse audiogram constructed from single-unit ANF thresholds, such that a particular noise level would have a similar masking effect across ANFs of different characteristic frequencies regardless of their absolute thresholds. This method was implemented using average ANF threshold data binned according to characteristic frequency in half-octave bands centered at 4-45.3kHz in half-octave steps (with linear interpolation between points). Masking noise was swept from -5-85dB SPL in 5-dB steps. Wave-IV peak latency was defined through visual analysis by two judges, and wave-IV latency slope was calculated as for human data.
3.2.3 Histology: synaptic ribbon counts
Left inner ears were extracted from three mice for each group (100dB neuropathic exposure, 94dB non-neuropathic exposure, unexposed controls), selected as representative ears based on ABR wave-I amplitude. Ears were extracted following intracardiac perfusion (4% paraformaldehyde) while deeply anesthetized, and were postfixed for 2 hours at room temperature. Following decalcification in EDTA for 2-3 days, the cochlear spiral was microdissected into six whole-mount pieces that were immunostained with the following: primary antibodies overnight at 37 (mouse anti-CtBP2 at 1:200, BD Transduction Labs; rabbit anti-Myosin VIIa at 1:200, Proteus Biosciences no. 25-6790), and secondary antibodies for 1 hour at 37 (biotinylated donkey anti-mouse at 1:200 followed by streptavidin-conjugated Alexa Fluor 568 at 1:1,000; Alexa Fluor 647-coupled donkey anti-rabbit at 1:200).
Whole-mount pieces were imaged using confocal microscopy (Leica TCS SP2) at specific cochlear frequency-locations that were identified using a reconstruction of the cochlear frequency map across pieces (custom ImageJ plug-in). For a given location, two adjacent regions were captured as z-stacks using an oil-immersion x100 objective (1.4 NA) with x2 digital zoom and a z-step of 0.25µm. Z-stacks of the inner hair cell base area were analyzed offline as 3D reconstructions in Amira (Visage Imaging). Individual ribbons (anti-CtBP2 puncta) were quantified and expressed as synaptic
label).
3.3 Forward masking
The forward masking behavioral and ABR measures were carried out at Technical University of Denmark in Lyngby, Denmark. During the experiments, subjects were seated in an acoustically and electrically shielded booth (double-walled from IAC). For the forward masking ABR measures, participants watched a silent, captioned movie of their choice, ignoring the acoustic stimuli. A desktop computer outside the booth controlled all aspects of the experiment, including triggering, sound delivery and storing data. The stimuli were presented via Fireface UCX (RME, Haimhausen Germany) and triggers were sent from a RME ADI-8 trigger box (RME, Haimhausen Germany). A headphone driver presented sound through ER-2 insert phones (Etymotic, Elk Grove Village, IL). All sounds were digitized at a sampling rate of 44.1kHz. For the forward masking behavioral experiments, subjects responded using a touch screen in the booth. All tests were measured in the left ear with the exception of one subject.
3.3.1 Participants
Twenty (four female) subjects, aged from 20-40 years (mean=26.95), were recruited from Technical University of Denmark in Lyngby, Denmark. All participants had pure-tone hearing thresholds better than 20dB HL in the tested ear at octave frequencies between 125 and 8000Hz shown in Fig.3-3. Subjects provided informed consent in accordance with protocols established at Technical University of Denmark.
3.3.2 Pure Tone Thresholds
Pure-tone thresholds were measured for each subject using a three-interval alternative forced choice task (AFC; the psychophysical-measurement package for MATLAB, University of Oldenburg, Germany). Thresholds were collected in the tested ear at
octave frequencies between 125 and 8000Hz, each 100ms in duration. On each trial, the presentation of each interval was indicated by highlighting the interval button on the screen. The listener was asked to identify which of the three intervals contained the pure-tone signal. Intervals were separated by 201ms and trials were separated by 660ms. A nonparametric, 2-up 1-down adaptive procedure was used to obtain thresholds [62]. Pure-tone level started at 50dB SPL and was reduced by 5, 2, and then 1dB in the tracking procedure to reach threshold. The step-size was changed after each upper reversal. Threshold was defined as the mean of the last six reversals. This measure was repeated twice for each pure-tone. If a threshold was a standard deviation away from the mean of the two repetitions, an additional threshold would be measured for the pure-tone(s) condition(s). Outlying thresholds were not used in the analysis. ● ● ● ● ● ● ● 200 500 1000 2000 5000 0 10 20 30 40 Frequency (Hz) Threshold (dB SPL) N=20
Figure 3-3: Pure-tone thresholds expressed in dB SPL for each participant of the forward masking study. Solid line represents mean threshold at each tested frequency. Dashed lines depict individual pure-tone thresholds.
3.3.3 Forward masking behavioral experiment
The same AFC package described above was used to measure forward masking detection thresholds. The masker was a 100ms broadband noise presented at a level of 35 and 70dB SPL. The noise was ramped with a 20ms cos2 rise-decay to minimize the use of onset cues. The bandwidth of the noise was limited by the sampling frequency (i.e., 44.1kHz) and the frequency response of the ear phones. The probe was a flat-spectrum, broadband, “synchronized” chirp spanning the frequency of 0.08-20kHz [24]. This chirp is designed to account for the group delay observed in the traveling wave along the cochlea by first presenting low- and then high-frequency components in time [24]. As illustrated in Fig.1-2, the probe was presented following the masker at MPIs of 20, 40, 72, 132, 168, and 201ms. On each trial, two of the three intervals contained only the masker and one interval presented the masker followed by the probe at a fixed MPI. Listeners were asked to identify the interval in which the probe was present. For each MPI and masker level condition, the probe level was varied to obtain detection threshold. The probe level started at 70dB peSPL and was adaptively changed using the same step-sizes in the pure-tone threshold procedure. Conditions were randomly presented in blocks and two repetition of each condition was implemented. A third repetition was acquired if any of the thresholds were a standard deviation away from the mean across repetitions.
Additionally, chirp thresholds (i.e. without a preceding masker) were measured using the same experimental design. Subject’s were asked to identify the chirp in one of three intervals on each trial. The chirp level started at 50dB peSPL and was varied adaptively.
3.3.4 Forward masking ABR
Forward masking ABRs were recorded in the left ear using a 5-channel EEG system (Biosemi Active II system, Amsterdam, Netherlands). The 5-channel configuration included channels, Pz, Cz, Fz on the 32-channel cap along with the left and right mastoids. ABR was measured using the same masker and probe as in the forward
masking behavioral task (i.e. masker=100ms broadband noise at 35 and 70dB SPL, probe=synchronized chirp). In contrast to the forward masking detection task, the probe level was fixed at 90dB peSPL to elicit a strong response from low and high-SR fibers. A repetition rate of 2Hz, measured from onset of masker in the previous trial to onset of masker in the current trial, was used to limit adaptation and fatigue in the ANFs. In addition, a 20ms jitter was introduced in the repetition rate to avoid the accumulation of any stationary interference including the 50Hz power-line noise. Forward masking ABR was recorded for MPIs of 20, 40, and 201ms at different masker levels (35 and 70dB SPL) yielding a total of 6 stimulus conditions. Each condition had 1500 repetitions presented randomly. Additionally, chirp-ABR (without a preceding masker) was recorded for the control condition using the same chirp level and repetition rate. The channels were referenced to the average of the mastoid channels. The ABR wave-V was best identified using the Cz to average mastoids; thus, we used this configuration for wave-V latency analysis.
Recorded data sampled at 16.384kHz was filtered between 100-2000Hz. Power line noise (50Hz and harmonics) was removed by applying Thomson’s regression method as implemented in the Chronux toolbox [10]. The filtered data were then time-epoched from -10 to 10ms relative to the offset of the chirp. Bad trials were removed by analyzing the distribution of the overall amplitude across trials. The number of trials was equalized across conditions for each subject. Peak latency of wave-V was identified using visual overlay cursors on a computer screen. The change in wave-V latency was defined as the difference in the wave-V latency across tested MPIs .
3.4 Statistical tests
Unless otherwise specified, statistical inference was performed by fitting mixed-effects models to the data and adopting a model comparison approach [3]. Fixed-effects terms were included for the various experimental factors whereas subject-related effects were treated as random. In order to not over-parameterize the random effects, models were compared with and without each term using the Akaike information criterion [89].
All model coefficients and covariance parameters were estimated using restricted maximum likelihood as implemented in the lme4 library in R. An F approximation for the type-II scaled Wald statistic was employed to make inferences about the fixed effects [54]: this approximation is more conservative in estimating Type I error in contrast to the Chi-squared approximation and performs well even with complex random-effects covariance structures [104]. The p-values and F-statistics based on this approximation are reported.
Chapter 4
EXPERIMENTAL RESULTS
4.1 ABR in noise
The purpose of this study was two-fold: to determine 1) whether noise-induced cochlear synaptopathy in animals influences how ABR wave-V latency shifts with increasing background noise level and 2) if ABR wave-V latency shifts are related to individual differences in supra-threshold temporal coding in a group of young NHT human listeners.
Methods and measures were designed to reveal the contributions of low-SR fibers, which have been shown to be vulnerable to noise exposure [106, 36, 68] and may be important for coding in acoustic scenes with multiple talkers and background noise [8, 5]. Specifically, we employed:
1. High sound levels, where the contribution of low-SR fibers to the overall population response is greater, in contrast to low sound intensities where the response is high-SR dominated [63].
2. Broadband noise maskers for our ABR measures, to highlight the resistance of low-SR fibers to background noise [22, 127].
3. Off-frequency maskers for our psychophysical measures, to reduce the contribution of off-frequency high-SR fibers to encoding of the target stimulus.
Envelope ITD sensitivity was chosen as the target task because sound localization based on timing information relies on the time-locked synchronous response of ANFs.
We specifically studied sensitivity to envelope ITD with carrier frequencies of 2 and 4kHz because noise-induced threshold shifts often present as notches around 4kHz, and because ABR wave-V arises from mid to high frequencies [1].
4.1.1 Click-evoked otoacoustic emissions
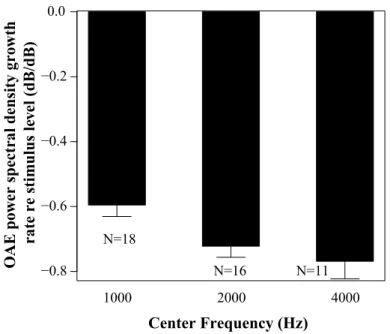
Fig.4-1 shows the mean COAE spectral power growth rate relative to input click level in each frequency band. The growth rate (i.e., slope) of the COAE spectral power relative to the input level (i.e., COAE spectral power-click level) represents the amount of compression in those frequency regions, which likely reflects OHC function [110, 109]. If there is OHC damage, the COAE is expected to grow more linearly with click level. The growth function was fitted on a log scale; thus, a slope of 0 would mean that the COAE spectral power grew linearly with increasing stimulus level while a negative slope depicts a compressive growth.
1000 2000 4000 Center Frequency (Hz) O AE p ow er spect ral density gr owth rate re sti m ulus l ev el (dB/dB) −0.8 −0.6 −0.4 −0.2 0.0 N=18 N=16 N=11
Figure 4-1: Mean COAE spectral power growth rate with increasing stimulus level for each frequency band. Growth rate is the slope of the normalized COAE spectral power as a function of the stimulus level. COAE spectral power is normalized to the stimulus level. Error bars depict standard error. Notice that the number of subjects varies for each frequency band as not all subjects had reliable COAE in each frequency band.
There appears to be larger compression in the higher frequency bands and moderate variability across subjects, as depicted by the standard error. However, we found no significant correlation between the individual differences in this measure and that of the envelope ITD thresholds or the ABR wave-V latency shifts with noise. Thus, the differences we observe in the ABR and ITD measure do not seem to be significantly affected by changes in cochlear mechanics.
4.1.2 Wave-V latency, wave-I amplitude and temporal acuity
in humans
Click-evoked ABRs recorded with scalp electrodes showed a robust wave-V in both quiet and noise-masked conditions. Responses to stimuli in quiet showed a clear decrease in wave-V latency with increasing stimulus level, consistent with earlier reports (e.g., [23]). This effect is likely due to the broadening of peripheral auditory filters with level, yielding shorter impulse responses and an excitation pattern that peaks more basally along the basilar membrane [83, 46]. In contrast, masked ABRs showed evidence of increasing wave-V latency with background noise level Fig.4-2 (A-D). Measuring the slope of this latency vs. masker-level function, as calculated by linear fit, helps normalize for inter-subject differences in the timing of this wave due to gender, age and anatomy [77]. As seen in Fig.4-3, wave-V latency shift varied over a wide range for our NHT subjects from, 0.0018-0.0464ms/dB. From here on we will refer to this slope as the “ABR wave-V latency shift”.
Concomitantly, we found large individual differences in the binaural measure of temporal coding fidelity, like that observed in prior studies [5, 102]. When an off-frequency masker was used, envelope ITD thresholds for carrier frequencies of 2 and 4kHz varied over a wide range across our NHT listeners, from about 200µs to 800µs, Fig.4-3 (B and D). This range is greater, and the threshold values are higher, than past reports (e.g., [27]). These difference may arise because, unlike previous studies, we 1) presented our stimuli at a relatively high intensity, 2) introduced off-frequency maskers, and 3) tested a lower envelope modulation rate. When the
−5 0 5
Time re Onset of Sound (ms) 42 dB SPL 52 dB SPL 62 dB SPL 72 dB SPL 82 dB SPL Noise Level wave-V A −5 0 5
Time re Onset of Sound (ms)
ABR03
−5 0 5
Time re Onset of Sound (ms)
ABR04
−5 0 5
Time re Onset of Sound (ms)
ABR05 ABR01 42 dB SPL 52 dB SPL 62 dB SPL 72 dB SPL 82 dB SPL Noise Level C B D 40 45 50 55 60 Noise level (dB SPL) A BR w ave − V Late n cy (ms ) y=0.0336x+3.5217 40 45 50 55 60 65 70 y=0.0287x+4.0236 Noise level (dB SPL) A BR w ave − V Late n cy (ms ) 40 45 50 55 60 Noise level (dB SPL) y=0.0305x+4.3717 A BR w ave − V Late n cy (ms ) 40 45 50 55 60 65 70 75 Noise level (dB SPL) A BR w ave − V Late n cy (ms ) y=0.0317x+3.9260
Figure 4-2: Sample human ABRs in noise using a 80dB peSPL click at different background noise levels for 4 listeners. Note how wave-V latency shifts with increasing noise level. At each noise level, peak ABR wave-V latency was defined and a linear regression was fitted to all noise level conditions where ABR wave-V was identifiable for each listener (inset in each plot). The slope of each fit was used for analysis.
stimulus is presented with a low-pass noise alone Fig.4-3 (C), the envelope ITD thresholds improve and the variability decreases, suggesting that listeners benefit from recruitment of off-frequency high-SR fibers in this temporal encoding task.
To evaluate the relative contributions of different factors to envelope ITD discrimination, we used a linear mixed-effects regression model. The model included fixed-effect terms for age, pure-tone thresholds at 2 and 4kHz, gender, carrier frequency, and ABR wave-V latency shift. Although the 2 and 4kHz pure-tone thresholds were correlated with envelope ITD threshold, their respective contributions to ITD sensitivity cannot be disentangled from each other. However, because neither is correlated with the ABR wave-V latency shift, discarding them does not affect inferences about how the ABR wave-V latency shift is related to envelope ITD coding. The main effect of the ABR wave-V latency shift was significant for predicting the envelope ITD thresholds [F(1,14.671)=15.16, p=0.0015].
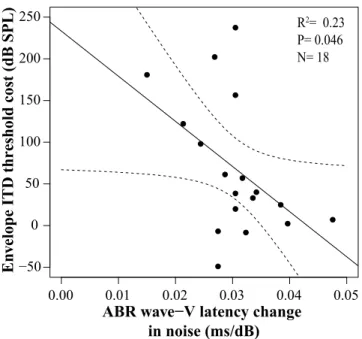
Post-hoc analysis revealed that the smaller the wave-V latency shift, the poorer the listener was at detecting changes in envelope ITD in the presence of off-frequency masking noise (Fig.4-3 B and D). This correlation was significant for both the 2kHz (r=-0.538, p=0.0098) and 4kHz carrier frequencies (r=-0.636, p=0.0019). However, when off-frequency cues were not masked (i.e., only low-pass masking noise is used), the two measures did not correlate (r=-0.418, p=0.0605, Fig.4-3, (C). Further, the amount that the notched noise affects a listener’s ITD threshold relative to the low-pass noise condition was correlated with the ABR wave-V latency shift (r=-0.476, p=0.046): listeners who were hurt more by the notched noise had a smaller wave-V latency shift, as shown in Fig.4-4. This is consistent with the interpretation that the individual differences in envelope ITD sensitivity in notched noise (Fig.4-3, B and D) are driven primarily by the contribution of on-frequency ANFs and reflect the temporal encoding of low-SR fibers. At higher stimulus levels, as tested here, the low-SR fibers are relatively more synchronized to the envelope modulation of the acoustic signal than high-SR fibers [8]. Thus, the timing difference in the envelope of our stimulus may largely but not entirely be encoded by the low-SR fibers.
0.05
ITD Center Frequency: 2kHz
0.00 0.01 0.02 0.03 0.04
ABR wave−V Latency Change in Noise (ms/dB) 100 200 300 400 500 600 700 800 −5 0 5
Time re Onset of Sound (ms) 42 dB SPL 52 dB SPL 62 dB SPL 72 dB SPL 82 dB SPL Noise Level wave-V 0.05 4.0 Frequency (kHz) Noise Noise Power
ITD Center Frequency: 4kHz
0.00 0.01 0.02 0.03 0.04
ABR wave−V Latency Change in Noise (ms/dB) 100 200 300 400 500 600 700 800 R2= 0.405 P= 0.0019 N= 21 E n
velope ITD Threshold (us)
0.05 400 500 600 700 800
ITD Center Frequency: 2kHz
E
n
velope ITD Threshold (us)
0.00 0.01 0.02 0.03 0.04
100 200 300
ABR wave−V Latency Change in Noise (ms/dB)
● ● ● ● ● ● ● ● ● ● ● ● ● ● ● ● ● ● ● ● ● 2.0 Frequency (kHz) Noise Noise Power R2= 0.289 P= 0.0098 N= 22 ● ● ● ● ● ● ● ● ● ● ● ● ● ● ● ● ● ● ● ● ● ● R2= 0.1748 P= 0.0842 N= 18 2.0 Frequency (kHz) Noise Power ● ● ● ● ● ● ● ● ● ● ● ● ● ● ● ● ● ● A B C D
Figure 4-3: ABR wave-V latency change in noise correlates with perceptual performance on temporal-cue tasks. A: Sample masked human ABRs using a 80dB peSPL click at different background noise levels. The rate of change of the wave-V latency with noise level was compared to envelope ITD sensitivity measured using a transposed tone with center frequency of B: 4kHz and D: 2kHz presented with notched noise. Notch width was equivalent to the ERB of the used center frequency. X-axis in plots depicts the slope of each fit. There is a significant correlation between sensitivity to envelope ITD and the slope describing ABR wave-V latency change with noise level when the ITD sensitivity is measured using notched noise. When the transposed tone was presented with a low-pass noise, allowing off-frequency listening (C), the envelope ITD sensitivity did not correlate with the masked ABR wave-V latency rate of change.
● ● ● ● ● ● ● ● ● ● ● ● ● ● ● ● ● ● 0.00 0.01 0.02 0.03 0.04 0.05 −50 0 50 100 150 200 250
ABR wave−V latency change in noise (ms/dB)
E
nv
elope ITD threshold cost (dB SPL)
R2= 0.23
P= 0.046 N= 18
Figure 4-4: ABR wave-V latency shift in noise correlates with the cost of ITD thresholds at a 2kHz carrier. The ITD threshold cost is defined as the difference between ITD thresholds in notched noise vs. in low pass noise. The higher the cost (i.e. larger the threshold difference), the smaller the ABR wave-V latency shift and vice versa.
To better understand the underlying mechanisms of the ABR wave-V latency shift in noise, we compared the individual differences in the wave-V latency shift with how wave-V latency changed with stimulus level (in quiet). These two measures did not correlate, suggesting that the wave-V latency shift is not due to changes in the cochlear excitation pattern with overall level. Furthermore, no significant relationship was found between ABR wave-V latency shift and how wave-V amplitude changes with either the stimulus level (in quiet) or the noise level. The results are consistent with our hypothesis and suggest that a loss of low-SR fibers yields sound coding deficits that affect both hearing in background noise and in coding temporal information important for the ITD task.
Because wave-V is dominated by the IC or LL [81], it is unclear whether the differences in ABR wave-V latency shifts are a direct consequence of differences in AN response or from a later stage of processing. To investigate this, we measured ABR wave-I to high-level clicks (60-100dB SPL) using ear-canal electrodes (“tiptrodes”),