Key words: Fear of falling, frailty, gait, vulnerability.
Correspondence: Dr. Laurence Seematter-Bagnoud, Service de Gériatrie et Réadaptation Gériatrique, Centre Universitaire de Traitement et de Réadaptation, Chemin de Sylvana 10, CH-1066 Epalinges, Switzerland.
E-mail: Laurence.Seematter-Bagnoud@chuv.ch
Received February 17, 2009; accepted in revised form May 5, 2009. First published ahead of print November 27, 2009 as DOI: 10.3275/6705.
Vulnerability in high-functioning persons aged 65
to 70 years: the importance of the fear factor
Laurence Seematter-Bagnoud1,2, Brigitte Santos-Eggimann2, Stéphane Rochat1, Estelle Martin1,
Athanassia Karmaniola2, Kamiar Aminian3, Chantal Piot-Ziegler4and Christophe J. Büla1 1Service of Geriatric Medicine and Geriatric Rehabilitation, University of Lausanne Hospital Center, 2Institute of Social and Preventive Medicine, University of Lausanne Hospital Center,3Laboratory of
Movement Analysis and Measurements (LMAM), Ecole Polytechnique Federale de Lausanne (EPFL),
4Institute of Psychology, Social and Political Sciences Faculty, University of Lausanne, Switzerland
ABSTRACT. Background and aims: Falls efficacy has been shown to predict functional decline, but whether it is independently associated with frailty is still un-clear. This study investigated the cross-sectional as-sociation between falls efficacy and the frailty pheno-type in high-functioning older persons. Methods: Sub-jects (n=861) were a sub-sample of community-dwelling persons aged 65 to 70 years enrolled in the “Lc65+” cohort, who had gait assessment. Data included de-mographics, functional, cognitive, affective and health status, as well as measures of physical performance. Falls efficacy was measured with the Falls Efficacy Scale-International (FES-I) and frailty with Fried’s cri-teria. Participants were categorized into robust (no frailty criterion) and vulnerable (1 or more criteria). Low falls efficacy was defined as a FES-I score in the lowest quartile. Results: Overall, 23.9% of pants were vulnerable. Compared with robust partici-pants, they were more likely to report low falls efficacy (43.3% vs 19.1%, p<0.001) and had poorer health and functional and mental status. They had slower gait speed (1.07±0.18 vs 1.15±0.15 m/s, p<0.001) and increased gait speed variability (coefficient of variation 4.10±4.03 vs 3.33±1.45%, p<0.001), although only 6 participants (0.7%) fulfilled Fried’s slow walking cri-terion. In multivariate analysis, low falls efficacy re-mained associated with being vulnerable (adjusted OR 1.80, 95% CI 1.19-2.74, p=0.006), independent of co-morbidity, functional status, falls history and gait formance. Conclusion: In high-functioning older per-sons, low falls efficacy was associated with vulnera-bility, even after controlling for gait performance and falls history. Whether low falls efficacy is a potential
target on the pathway leading to frailty should be further examined prospectively.
(Aging Clin Exp Res 2010; 22: 212-218) ©2010, Editrice Kurtis
INTRODUCTION
Fear of falling is a frequent problem in older persons, affecting as many as 20-60% of those aged over 65 years who live in the community (1, 2). It may be assessed directly or through “falls self-efficacy”. As proposed by Bandura, self-efficacy represents the degree of confi-dence a person has in his/her ability to perform a specific activity, and influences behaviours regarding that activity (3). In the present context, fear of falling might be defined as "low perceived efficacy at avoiding falls during essen-tial, nonhazardous activities of daily living (4). Fear of falling may thus lead to restriction in these activities, ini-tiating a vicious cycle of decline in physical abilities (5). Fear of falling has also been associated with future func-tional decline in high-functioning older women even in the absence of activity restriction (6).
Frailty also places older people at higher risk for falls and disability, as well as hospitalizations, institutionalisa-tion and death (7, 8). Among indexes developed to char-acterize frailty, the definition of Fried’s et al. (7) is the most widely used (9), and relies on assessment in five do-mains: nutrition/sarcopenia (involuntary weight loss), en-durance (fatigue), physical inactivity, muscle strength (low grip strength) and mobility (slow walking). Frailty is defined along a continuum: individuals meeting one or two criteria are classified as pre-frail, and those with three or more cri-teria are classified as frail. Both frail and pre-frail individuals have been shown to experience more frequent adverse (4
(433.. fu funnc
d ss cri ri--o rri--obubustt (n(noo (1 oror moremore critecriteriaria). f ned as a FES-FES-II sscororee inin the esultsults:s: OveraO ll, 23.3.9%9% of
vul
vu nerablrable. CCompareomparedd with s,, ttheyhey werewere moreore likkelyely to rere 3
3%% vvss 19.1%19.1%, p<<0.001)0 tiionaonall andd men d
d ((1.07±1
blem inn ooldldeerr ppeerrsonson 6
60% ooff ththososee agedaged overo 6 e commucommuniittyyttt (1,(1, 2).2). ItIt may be hrough “fallsalls selfself-efeffficacy”.icac As dura,, sellff--efefffici acy rrepreepr sent
deencnce aa pepersonrson hhaas in his/h/ aactictivityvity, aanndd influe
(3 (3). IInn the p as "l ticici s efefficacyfffficacy poorer
poorer healthhealth andand . TTheyhey hahadd slowerslower 1..151 ±0.1±0.155 m/m/s,///s, p< pee
peedd vvarariiabiabilittyy (c( o ff 3.3 3.33±1.43±1.45%,5%, 0.7% 0.7 )) ff ur urss rreegarga xxt,t,
xx fearfear ofof fafalllilinngg m eedd eefficacacycy atat aavvooiididi nhhazarazardodouuss acta ivitivitieie aalling mamayy tthhusus leleaadd ttiiatiat nng aa vvicici Fe
outcomes and may thus be considered as vulnerable (7-9). Previous studies have found an association between fear of falling and slow gait speed (10-12) and therefore one might also expect fear of falling to be associated with frailty. Surprisingly, this relationship has not been well studied (11, 13). In particular, it still remains to be verified whether it is truly independent of or is mediated by gait performance. Clarifying this issue is important, in order to determine whether fear of falling is a risk factor for frailty and a possible specific target for interventions aiming at disability prevention.
The aim of this study was to determine whether fear of falling, as measured by low falls efficacy, is associated with early signs of impending frailty in community-dwelling old-er pold-ersons aged 65 to 70, independent of gait pold-erfor- perfor-mance and previous falls history.
METHODS
Study design and population
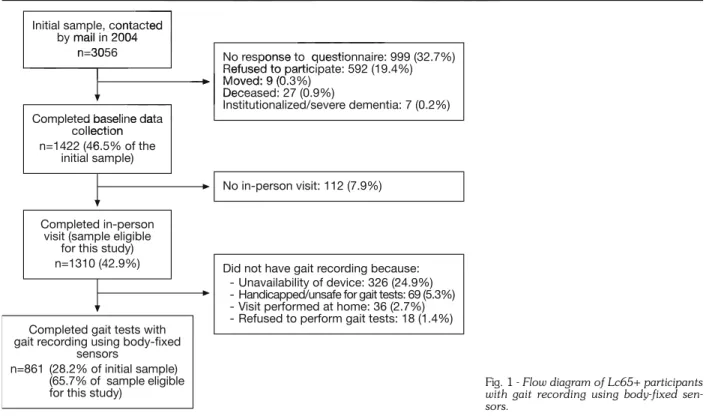
Participants were a subsample of subjects enrolled in the Lausanne cohort 65+ (Lc65+) on age-related frailty in community-dwelling young-old persons. The Lc65+ re-cruitment and methods have been described in detail elsewhere (14). Briefly, a random sample of 3056 persons born between 1934 and 1938 residing in Lausanne, Switzerland, was contacted. From the 1310 subjects who completed baseline data collection (Fig. 1), 861
had gait parameters recorded using body-fixed sensors (15). The main reasons for missing gait parameters were unavailability of the recording device (24.9%), inability to walk due to health and/or safety problems (5.3%), and re-fusal (1.3%). Participants who underwent gait recording were more frequently men, were married, had higher ed-ucation and better functional status, and reported fewer falls (data not presented) than those who did not.
Data collection
Information about socio-economic status, education, self-rated health, chronic diseases (out of a list of 12 chronic diseases), physical activity, previous falls in pre-ceding 12 months, and depressive symptoms, as well as difficulties or help in basic and instrumental activities of dai-ly living (ADL) was collected through a postal question-naire.
Additional data were collected during an in-person visit, including anthropometrics, and measures of cogni-tion, grip strength, and gait parameters (14). Data col-lection was performed by trained research assistants using a standardized protocol. Maximal grip strength in the right hand (best performance of 3 trials) was measured on a BASELINE®hand-held dynamometer.
Gait assessment: Gait speed (m/s) was measured over 20 meters in a well-lighted walkway with participants walking at self-selected speed, by the Physilog®system
Initial sample, contacted by mail in 2004
n=3056
Completed baseline data collection n=1422 (46.5% of the
initial sample)
Completed in-person visit (sample eligible
for this study) n=1310 (42.9%)
Completed gait tests with gait recording using body-fixed
sensors
n=861 (28.2% of initial sample) (65.7% of sample eligible for this study)
No response to questionnaire: 999 (32.7%) Refused to participate: 592 (19.4%) Moved: 9 (0.3%) Deceased: 27 (0.9%) Institutionalized/severe dementia: 7 (0.2%) No in-person visit: 112 (7.9%)
Did not have gait recording because: - Unavailability of device: 326 (24.9%) - Handicapped/unsafe for gait tests: 69 (5.3%) - Visit performed at home: 36 (2.7%) - Refused to perform gait tests: 18 (1.4%)
Fig. 1 - Flow diagram of Lc65+ participants with gait recording using body-fixed sen-sors.
©
bjects bjects Fig. 1),1) 861861 per ureress off cocogg meterss (1(144).). DataData coc ined researcresearchh asasssisistantstants usu in oocolco .. MaM xiximalmal gripgrip strentrength est performmaancence ofof 33 ttrialsrials)) wa SELINEE®®hanha d-heleldd ddyynan mo G
Gaitt assesassessmsmenent
ice
: Gait spe2
200 memetetersrs in a well w walkikinng at s
0
2010
p contacted y mail i 2004 n=300
Ed
alkwlkwaayy w speedspeed,, bbyy thhee P
P
PE
OR
d baseline data llection 46ERSONAL
response to question Refused to particip Moved: 9 (0 Deceas IUSE
[BioAGM, Tour-de-Peilz, Switzerland (15)]. Gait speed vari-ability was assessed with the coefficient of variation (CV in %) defined as the standard deviation divided by the mean value of gait speed for each stride (16).
Falls efficacy assessment
Falls efficacy was measured with the Falls-Efficacy-Scale International (FES-I (17)) which assesses a per-son’s concern about falling while performing 16 activities of daily living (e.g., taking a bath, answering the phone, etc.). Four answers are possible, ranging from “very con-cerned” to “not at all concon-cerned” with total scores rang-ing from 16 to 64. As higher scores indicate lower falls ef-ficacy, FES-I scoring was subsequently reversed and stan-dardized (rsFES-I) for this analysis, to provide scores ranging from 0 to 100, higher scores indicating higher falls efficacy.
In the main analysis, falls efficacy was dichotomized as low vs normal, where low falls efficacy was defined as a score in the lowest quartile at the rsFES-I. In secondary analyses, the rsFES-I score was also used as a continuous variable.
Frailty assessment and definition
Frailty was measured according to the following crite-ria (7):
- Low muscle strength: cut-off for low grip strength as used by Fried et al. (7);
- Poor nutrition: self-reported unintentional weight loss during preceding 12 months;
- Poor endurance: self-reported lack of energy and fatigue during preceding 4 weeks;
- Slow walking: cut-off for slow gait speed as used by Fried et al. (7);
- Low physical activity: defined as doing less than 20 min-utes of sports per week, or walking less than 90 minmin-utes per week. Participants fulfilling these criteria were nev-ertheless considered active if they reported a high amount of daily usual physical activity such as walking stairs, or lifting weights.
Based on these five criteria, three categories were defined: robust (0 criterion), pre-frail (1-2 criteria), and frail (3+criteria). Data on frailty criteria were available for all ex-cept 15 participants, for whom information about phys-ical activity was missing. We considered these participants as not fulfilling the frailty physical activity criterion, allowing their classification in robust (n=7) and pre-frail (n=8) cat-egories. Given the very low proportion of frail subjects (0.8%), the frailty variable was dichotomized into robust (0 criterion) and vulnerable (one or more criteria) in subse-quent analyses.
Statistical analyses
Characteristics of robust and vulnerable participants were compared with Pearson’s chi-squared test for
cate-gorical variables and Student’s t-test for continuous vari-ables.
The prevalence of low falls efficacy was compared between robust and vulnerable subjects after categoriza-tion of the sample into non-fallers, previous single fallers, and multiple fallers, with chi-squared tests and tests for trend. Gait speed was compared within robust and vul-nerable participants after stratification for falls efficacy sta-tus, with Student’s t-test.
Multivariate logistic regression analyses were per-formed to examine the association between low falls ef-ficacy (dichotomous) and frailty status. Adjustment variables were chosen on the basis of their likely relationships with frailty and fear of falling and included: age, gender, living alone, education, falls in the previous year, cogni-tive impairment, depressive symptoms, comorbidity, and functional impairment (Model 1). Gait parameters were secondarily included (Model 2).
Sensitivity analyses were performed after exclusion of: a) participants (n=15) with missing data on one frailty criterion; b) participants (n=7) with 3 or more frailty cri-teria; c) participants (n=6) who had slow gait speed ac-cording to Fried’s criterion. Lastly, additional analyses were also performed with the rsFES-I score as a continuous vari-able. Analyses were processed by Stata, version 10.0.
The study was approved by the institution review board, and written consent was obtained from all partic-ipants during the in-person visit.
RESULTS
Overall, 75.3% (648/861) of subjects did not fulfill any frailty criteria (robust group). In contrast, 24.7% (213/861) were considered as vulnerable in this analysis, because they had one (20.2%), two (3.7%), three (0.7%) or four (0.1%) frailty criteria. None of the participants met all five criteria. Among vulnerable subjects, low grip strength was observed in almost half (101/213, 47.4%), invol-untary weight loss in one-third (72/213, 33.8%) and low physical activity (42/205, 19.7%) and exhaustion (39/213, 18.3%) in one-fifth. Slow gait speed was ob-served in only 6 (2.8%) of the 213 vulnerable participants. The characteristics of the population and compar-isons between robust and vulnerable participants are list-ed in Table 1. The latter participants were slightly older, more likely to live alone and to report comorbidity and de-pressive symptoms. The proportion of participants with cognitive impairment tended to be higher among those vulnerable (3.4% vs 1.6%). Vulnerable participants were also more likely to report functional impairment and falls in the previous year, and to have low falls efficacy. Lastly, vulnerable participants had slower gait speed and increased gait speed variability.
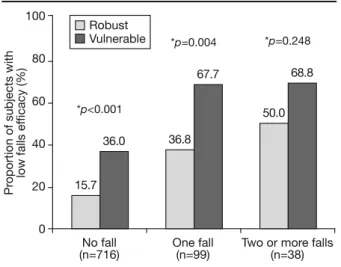
Figure 2 displays the prevalence of low falls efficacy in robust and vulnerable participants stratified by fall fre-quency, and shows a double gradient in this association. -- SloSlo
et et a
p strrengtengthh asas d unintentionalntional weigweightht losl s 2 monmontthshs;
nce: selfself--repoportr eded lackack of ener g
g precprecedineding 44 weeks;weeks; oww walwalkiing:ng: cucut-u offf ffor slo
all.. ((7)7);; p phyh sical
fterer exclusxclus ng daatata oonn ononee frfraiai =7) witthh 33 oorr momorere frfrailtailtyy cr (n
(n==6)6) whhoo hhadad slowslo ggaitai sp ed’s criterriioon.n. LLastLLLastly,ly, addiadd tit onal perforr meedd wwiiwww tht the rrsFsFEFFF SES-II sco abblle.e. AAnnaalylyseess wwere e proce
T
Thehe sstudtudy was b
boarrdd, and ipant
ee aass uusedsed bbyy FrFrieiedd inedd asas doindoingg lessless thth
er week,week, oror walalkiking lesl aarticiprticipantantss fufulflfillinil
n nsidesiderreded
yy thethe ini entt wawass obobtaintained e inin-perersosonn visitvisit. RESUSULTLTSS
Overalrall,l, 7575 ffrr
First, within each frailty category, the prevalence of low falls efficacy increased gradually according to falls fre-quency, with statistically significant trends in both ro-bust and vulnerable groups (both p<0.001). Second, within each falls category, the prevalence of low falls efficacy was higher in vulnerable than in robust partici-pants.
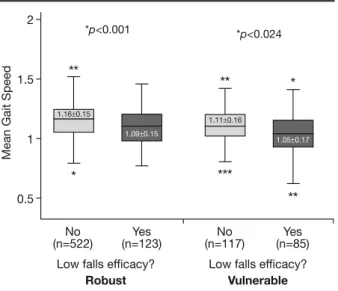
Similarly (Fig. 3), mean gait speed was significantly slower in participants with low falls efficacy compared with the others, among both robust (1.16±0.15 vs 1.09±0.15 m/s, p<0.001) and vulnerable (1.11±0.16 vs 1.05±0.17 m/s, p=0.024) groups.
Table 2 lists results from bivariate and multivariate analyses predicting prevalent vulnerability. In the bivariate analysis, subjects with low falls efficacy had three times higher odds of being vulnerable. After adjustment for age, gender, education, living alone, cognitive and affective status, history of falls, comorbidity and functional status, low falls efficacy remained significantly associated with higher odds (Model 1: adjOR 2.03, 95% CI 1.35-3.05, p=0.001) of being vulnerable. Further adjustment for gait performance (Model 2) only marginally modified this association (adjOR 1.80, 95% CI 1.19-2.74, p=0.006). Beside low falls efficacy, gait speed and gait speed vari-ability were also independently associated with being
vulnerable, together with reporting comorbidity and im-pairment in instrumental ADLs. Specifically, for a decrease in gait speed of 0.1 m/s, the odds of being vulnerable in-creased by 8%.
Total population Frailty status
Robust Vulnerable
(n=861) (n=648) (n=213) p-value*
Age (years, mean±SD) 68.0±1.4 68.0±1.4 68.2±1.4 0.034
Women (%) 54.9 54.0 57.8 0.342
Higher education (%)† 34.7 36.0 31.0 0.185
Living alone (%) 31.2 29.3 37.1 0.034
Comorbidity (2+ chronic diseases) (%) 59.8 55.8 72.2 <0.001
Depressive symptoms (%)‡ 22.6 20.5 29.2 0.009
Cognitive impairment (%)§ 2.0 1.6 3.4 0.103
Instrumental ADL impairment (%)^ 11.0 6.3 25.4 <0.001
Basic ADL impairment (%)¶ 7.7 5.1 15.5 <0.001
Falls last 12 months (%)
- none 83.9 86.0 77.5
- one 11.6 10.7 14.6 0.004
- two or more 4.5 3.4 8.0
Low falls efficacy (%)** 25.0 19.1 43.3 <0.001
rsFES-I score (mean) 94.1±8.6 95.4±5.9 90.2±13.3 <0.001
Gait parameters:
- speed (m/s, mean±SD) 1.13±0.01 1.15±0.15 1.07±0.18 <0.001
- speed CV (%, mean±SD)†† 3.52±0.08 3.33±1.45 4.10±4.03 <0.001
- stride length (m, mean±SD) 1.21±0.01 1.23±0.14 1.17±0.10 <0.001
- stride length CV (%, mean±SD)†† 2.37±0.07 2.23±1.14 2.77±3.28 <0.001
*Chi-square test (categorical variables) or Student’s t-test (continuous variables);†Defined as 12 or more years of education;‡Defined as at least one positive
answer to two screening questions for depression;§Defined as a score <24/30 on Folstein’s Mini-Mental State Examination; ^Instrumental Activities of
Dai-ly Living include shopping, and performing usual household activities;¶Basic Activities of Daily Living were bathing, dressing, using the toilet, transferring, and
feeding; **Defined as a score in the lowest quartile at the reversed standardized FES-I (rs FES-I, range 0-100, higher scores indicating higher efficacy);††CV:
coefficient of variation, where CV= (standard deviation/mean) x 100.
Table 1 - Baseline characteristics of study population and comparisons between robust and vulnerable participants.
15.7 36.0 *p<0.001 100 80 60 40 20 0 Pr oportion of subjects with low falls ef ficacy (%)
No fall One fall Two or more falls
(n=716) (n=99) (n=38) 36.8 67.7 *p=0.004 50.0 68.8 *p=0.248 Robust Vulnerable
Fig. 2 - Prevalence of low falls efficacy according to frailty status among non-fallers, single fallers, and multiple fallers. *p-value from chi-square test comparing robust and vulnerable participants. q
queue b busustt
ach frarailtil y cacategtegory,ory, thet prevale ficcaccyy ininccreasreaseded graduaraduallyy acca ncy
ncy, wwithth ststaatisticcallyal sign and
and vvululnerane ble n n eae ch f 0.0 <0 <0..000 .07±0.1818 <0<0.0001 4.10±4.03.10±4.03 <0 0 14 1.1717±0±0..1010 23±1.14 2.77±3.282.77±3.2
e K
nneed as 1212 or mmoreore yyears off eedducation ‡
0 on FoFollststein’n’ss MiMinni-MMenentatall State Exa Basasiicc Accttiviviittiiees ooff DDaiaillyy LiLivving were bath e
edd stantandaardrdizizeded FFES-E I ((rsrs FES-I,FES-I, rang
Edit
/mean) /mean) xx 100100..
w faallslls fre fre--ndss inin bothboth ro ro--othh pp<0.0<0.001)01).. SeSeconco ry,y thehe prevalenceprevalence
err inin vuvulnlneraberablele thha F
Fig.ig. 3),3)
vvululnerabablle,e, to p
paiairmrm
inngg ththee orreses iindndiccatiatinng h
on one frailty criterion, those with 3 or more frailty cri-teria, and those with slow gait speed according to Fried’s criterion) led to similar results.
DISCUSSION
In these high-functioning persons aged 65 to 70 years, low falls efficacy was associated with prevalent vulnera-bility, independent of gait performance and falls history. This relationship remained even when excluding the 0.7% of the sample who met Fried’s criterion of slow walking speed (7). To our knowledge, this is the first study to document this independent relationship between a measure of fear of falling and early markers of vulner-ability in relatively young, well-functioning older persons. This result is important from several perspectives. First, it suggests that low falls efficacy may be a specific step and a target for intervention in the pathway leading to frailty and disability, independent of mobility impairment and falls. Second, the persistence of the association even after con-trolling for gait performance provides new insight into the type of intervention that may be indicated for frailty and disability prevention. Indeed, this observation may ex-plain negative results observed in some studies based on-ly on gait training (18) and suggests that interventions specifically targeting fear of falling may help to achieve im-proved results in frailty prevention (19). The observed link between falls efficacy and vulnerability also strengthens the importance of psychological factors as well as biolog-ical and social factors, as components of frailty.
Overall, these results encourage further investigation of the possible independent contribution of fear of falling in In the additional analysis with the rsFES-I score as a
continuous variable in the same multivariate model, falls efficacy remained independently associated with vulner-ability. A one-point increase in falls efficacy at rsFES-I de-creased the odds of being vulnerable by 3% (adjOR 0.97, 95% CI 0.94-0.99, p=0.011). Lastly, all three sensitivi-ty analyses (i.e., excluding participants with missing data
Bivariate results Adjusted results, Model 1* Adjusted results, Model 2**
Characteristics Odds Ratio 95% CI p-value Odds Ratio 95% CI p-value Odds Ratio 95% CI p-value
Low falls efficacy‡ 3.24 2.29-4.58 <0.001 2.03 1.35-3.05 0.001 1.80 1.19-2.74 0.006
Comorbidity (2+ chronic diseases) 2.05 1.46-2.89 <0.001 1.65 1.15-2.39 0.007 1.65 1.14-2.40 0.009 Instrumental ADL impairment§ 5.02 3.17-7.95 <0.001 3.06 1.69-5.55 <0.001 2.87 1.56-5.27 0.001
Gait speed (m/s) 0.05 0.02-0.14 <0.001 - - - 0.20 0.06-0.67 0.009 Speed variability (%)^ 1.14 1.07-1.22 0.001 - - - 1.10 0.99-1.22 ns Age 1.13 1.01-1.26 0.035 1.13 1.00-1.28 0.047 ns Female gender 1.16 0.85-1.59 ns ns ns Higher education 0.80 0.57-1.11 ns ns ns Living alone 1.42 1.02-1.97 0.033 ns ns Depressive symptoms 1.60 1.12-2.29 0.009 ns ns Cognitive impairment 2.21 0.83-5.90 ns ns ns
Basic ADL impairment 3.42 2.03-5.73 <0.001 ns ns
Falls last 12 months 1.78 1.20-2.64 0.004 ns ns
*Model 1 includes all adjustment variables displayed in this table (age, gender, education, living alone, depressive and cognitive problems, comorbidity, func-tional status, falls history), but only significant independent associations with vulnerability are listed; **Model 2 includes gait speed and gait speed variability as well as same adjustment variables included in Model 1;‡Defined as a score in the lowest quartile on reversed standardized FES-I (range 0-100, higher scores
indicating higher efficacy);§Instrumental Activities of Daily Living include shopping, and performing usual household activities; ^As measured by the coefficient
of variation (CV), where CV = (standard deviation/mean) x 100.
Table 2 - Results from bivariate and multivariate analyses of the association between low falls efficacy and vulnerability.
2 1.5 1 0.5 Mean Gait Speed No Yes No Yes (n=522) (n=123) (n=117) (n=85) ** *p<0.001 * 1.16±0.15 1.09±0.15 ** *p<0.024 *** 1.11±0.16 1.05±0.17 * **
Low falls efficacy? Low falls efficacy?
Robust Vulnerable
Fig. 3 - Gait speed in robust and vulnerable participants, ac-cording to falls efficacy status. *p-value from Student’s t-test, com-paring mean gait speed in confident and fearful participants among robust and vulnerable groups.
©
TTaablbled venen aftterer cc des nnewew insiins ghtght iinn may bee indndicaticateded forfor frfrailtyrailtyan . InIndedeeed, tthihiss oobservatbservatiion m e results obsobservervede iinn ssoomem stud gait traainingining (188)) ana dd sugge spepecic ficacallllyylll tatarrgegetingtin fear of f p
prrovoveded rreesultsu s in fra llinink bebetwew en f the i
,, faf llllss withh vuvulner lner--ffiiccacacyy aat rsFrsFES-ES-II d dee-nerable byy 3%3% ((adadjjdd OROR 0.90 977 p=0.011).0.011) Lastly, aallll thrthreee sen ., exclcludinudingg pparartit cicipanpa ts with
2
2
2 -- RResues ltslts frof m b
tionion ((191 yy anndd vvuvvv llneuneraabiaa lliitybi ff psycpsycholhologiogiccalal ffacactt ocial
ocial fafactorctors, aass coco Overaverallll,, thethessee reresulsu tthehe pop ssssiibblele i dd a
PERS
R P
BiBivaiariatriateFO
OddsOdd Rultiv
the causal pathway leading to frailty and disability (5). Another original finding of this study is the double gradient shown in the association between falls, fear of falling, and frailty. The prevalence of low falls efficacy in-creased steadily as falls frequency inin-creased but, within each falls category, low falls efficacy consistently re-mained more prevalent in vulnerable than in robust par-ticipants. Although the relationships between falls, poor falls efficacy, and frailty have been shown separately in previous studies (1, 6, 8, 9, 20), current results provide new insight into their complex interplay. In particular, they suggest the mediating role of falls in the relationship be-tween low falls efficacy and frailty. Although this cross-sec-tional analysis precludes drawing any conclusion about the chronology of falls, fear of falling and frailty occurrence, the observation of a double gradient supports the hy-pothesis that interventions directed at improving falls ef-ficacy may also play a significant role in postponing frailty and disability.
Results from this study also add to previous evidence about the potential role of gait speed as a prognostic marker in older persons. Even among these well-func-tioning older persons, who essentially did not meet the usual frailty cut-off for slow walking, gait speed and its vari-ability distinguished persons with different vulnervari-ability sta-tus. These differences all exceeded the 0.05 m/s thresh-old considered as clinically meaningful (20), and future work should determine whether these subtle differences are predictive of adverse outcomes.
This study has several limitations. First, gait perfor-mance was recorded only in a subsample of the cohort. Although the main reason for missing data (i.e., unavail-ability of gait measuring device) occurred randomly, about 8.1% of participants were excluded because they could not perform the gait tests. As expected, these participants were in worse health than those who did perform the tests. Despite this selection bias, the observation of the in-dependent association between poor falls efficacy and vul-nerability among the fittest participants further emphasizes the interest of this finding from a preventive perspective. Second, the use of imputation on missing frailty criteria may have resulted in misclassification of some participants, underestimating their frailty status. However, this impu-tation process concerned only 15 individuals (1.7%), and sensitivity analyses restricted to individuals with com-plete frailty data provided similar results. Third, the vul-nerable group was heterogeneous, as it included both pre-frail and pre-frail individuals. Very few (0.8%) participants were frail, precluding examination of a possible dose-response effect across the three frailty groups. Therefore, find-ings essentially apply to frail individuals. Lastly, as pre-viously mentioned, the cross-sectional design of the study prevents any conclusion about the chronology and the causality of the observed relationships between fear of falling, vulnerability, and falls history. Longitudinal studies
are needed to further investigate the possible reciprocal re-lationship between fear of falling and frailty, most prob-ably through a vicious cycle of reduced physical activity, increased fear of falling, and increased frailty.
This study has several strengths, which include the large number of participants in a narrow age range, making it a homogeneous cohort of well-functioning individuals. A unique feature of the current study was also the detailed assessment of gait speed and variability, which was recorded over a longer distance than usual. Lastly, an ex-tensive set of potential confounders, including perfor-mance-based measures, was collected and adjusted for in the analyses.
In conclusion, this work shows the existence of a re-lationship between fear of falling and frailty, and suggests that it is potentially mediated by falls history, but re-mains – at least partially – independent of gait perfor-mance. These findings corroborate our initial hypothesis that fear of falling may be an important component of the transition to frailty. They also lend preliminary support to targeting falls efficacy in the pathway leading to frailty and disability, but longitudinal studies are needed to confirm these results and decide how best to intervene.
ACKNOWLEDGEMENTS
We would like to thank all participants in the Lc65+ study, together with research assistants: M. Rimaz, V. Chabloz, C. Borer, M-M. Mathey and M. Thomi, as well as M. Jacot-Guillarmod for secretarial assistance, and J.C. Beck for comments on the manuscript. We are grateful to the Loterie Romande (non-profit organization supporting re-search and social projects) for their grant to the Foundation Lau-sanne Cohort Lc65+. This study was also supported by grants from the Swiss National Scientific Foundation (325200-109401, Dr. C. Büla) and the Leenaards Foundation (Dr. S. Rochat). Prof. B. Santos-Eggi-mann is the principal investigator in the Lc65+ cohort. Dr. L. Seemat-ter-Bagnoud had full access to all the data in the study and takes re-sponsibility for data integrity and the accuracy of data analysis.
REFERENCES
1. Delbaere K, Crombez G, Vanderstraeten G, Willems T, Cambier D. Fear-related avoidance of activities, falls and physical frailty. A prospective community-based cohort study. Age Ageing 2004; 33: 368-73.
2. Zijlstra GA, van Haastregt JC, van Eijk JT, van RE, Stalenhoef PA, Kempen GI. Prevalence and correlates of fear of falling, and associated avoidance of activity in the general population of community-living older people. Age Ageing 2007; 36: 304-9. 3. Bandura A. Self-efficacy mechanism in human agency. Am
Psychol 1982; 37: 122-47.
4. Tinetti ME, Richman D, Powell L. Falls efficacy as a measure of fear of falling. J Gerontol 1990; 45: 239-43.
5. Deshpande N, Metter EJ, Lauretani F, Bandinelli S, Guralnik J, Ferrucci L. Activity restriction induced by fear of falling and ob-jective and subob-jective measures of physical function: a prospective cohort study. J Am Geriatr Soc 2008; 56: 615-20.
6. Carriere I, Colvez A, Favier F, Jeandel C, Blain H. Hierarchical components of physical frailty predicted incidence of depen-dency in a cohort of elderly women. J Clin Epidemiol 2005; 58: 1180-7.
7. Fried LP, Tangen CM, Walston J et al. Frailty in older adults: ev-ab abiill 8 8.1.1%% resh resh--0), andnd fufutureture see susubtlebtl difdiffereferennceces comes.
veralal limitlim ations. FFirirst,st, ggait p cordeded oonllyy inin aa subsub ample of ughgh thehe mmaia nn rreaeassonn forfor misssis
ityy ooff gag itit memeasuria ngng deviv % % ofof pparticiparticipants rm rm the poth mppoonennentt ofof prelimiminanarryyr susupporpportt pathwayway leadileadingng ttoo fraifrailtylty an uddininalal sts uddiesies areare neen dedded to c and deciddee hhooww bbestest toto inter A
ACKKNNOWOWLELEDGED MMENTS We
We wowouuldld lilke tto thank w
withh rreseare ch ass M
Mathey a d as i
. , unavunavail ail--randomandomlyly,, aboutabout d bebecausecause theythey couldcould s expectxpected,ed, thesethese
al
altthh tthhanan thhosose whowh tthhisis sselelecctitionon biabia
oci ociationn bb
inn thethe L m
mazz,, VV.. ChaChablb o w
wellell asas MM.. JacotJacot-Guill-Guil C.
C. BeBeck foforr cocommemmenntts h
hee LLototeerrieie RoRomam nnddee ((n rch aanndd ssoocciiaall proprojejectc ) ssaannne Coohorhorttrrr LcLc65+65 Sw
Swississ NaN tioni aanndd
idence for a phenotype. J Gerontol A Biol Sci Med Sci 2001; 56: M146-56.
8. Woods NF, LaCroix AZ, Gray SL et al. Frailty: emergence and consequences in women aged 65 and older in the Women's Health Initiative Observational Study. J Am Geriatr Soc 2005; 53: 1321-30.
9. Bandeen-Roche K, Xue QL, Ferrucci L et al. Phenotype of frailty: characterization in the women's health and aging studies. J Gerontol A Biol Sci Med Sci 2006; 61: 262-6.
10. Maki BE. Gait changes in older adults: predictors of falls or in-dicators of fear? J Am Geriatr Soc 1997; 45: 313-20. 11. Kressig RW, Gregor RJ, Oliver A et al. Temporal and spatial
fea-tures of gait in older adults transitioning to frailty. Gait Posture 2004; 1: 30-5.
12. Rochat S, Martin E, Piot-Ziegler C, Najafi B, Aminian K, Bula CJ. Falls self-efficacy and gait performance after gait and balance train-ing in older people. J Am Geriatr Soc 2008; 56: 1154-6. 13. Cumming RG, Salkeld G, Thomas M, Szonyi G. Prospective study
of the impact of fear of falling on activities of daily living, SF-36 scores, and nursing home admission. J Gerontol A Biol Sci Med Sci 2000; 55: M299-305.
14. Santos-Eggimann B, Karmaniola A, Seematter-Bagnoud L et
al. The Lausanne cohort Lc65+: a population-based prospective study of the manifestations, determinants and outcomes of frailty. BMC Geriatr 2008; 8: 20.
15. Aminian K, Najafi B, Bula C, Leyvraz PF, Robert P. Spatio-tem-poral parameters of gait measured by an ambulatory system us-ing miniature gyroscopes. J Biomech 2002; 35: 689-99. 16. Hausdorff JM, Rios DA, Edelberg HK. Gait variability and fall risk
in community-living older adults: a 1-year prospective study. Arch Phys Med Rehabil 2001; 82: 1050-6.
17. Yardley L, Todd C, Beyer N, Hauer K, Kempen R, Piot-Ziegler C. Development and initial validation of the Falls Efficacy Scale International (FES-I). Age Ageing 2005; 34: 614-9.
18. Barnett A, Smith B, Lord SR, Williams M, Baumand A. Community-based group exercise improves balance and reduces falls in at-risk older people: a randomised controlled trial. Age Ageing 2003; 32: 407-14.
19. Zijlstra G, van Haastregt JC, van Eijk JT, Kempen GI. Evaluating an intervention to reduce fear of falling and associated activity re-striction in elderly persons: design of a randomised controlled tri-al [ISRCTN43792817]. BMC Public Hetri-alth 2005; 5: 26. 20. Perera S, Mody SH, Woodman RC, Studenski SA. Meaningful
change and responsiveness in common physical performance measures in older adults. J Am Geriatr Soc 2006; 54: 743-9.
Meanin physhysicaall pperrfoforrmama atr Soc 22000066;; 554:4: 774343-9-9