ORIGINAL PAPER
High-resolution mass spectrometry for integrated qualitative
and quantitative analysis of pharmaceuticals
in biological matrices
Gérard Hopfgartner&David Tonoli&Emmanuel Varesio
Received: 31 July 2011 / Revised: 18 October 2011 / Accepted: 6 December 2011 / Published online: 28 December 2011 # Springer-Verlag 2011
Abstract Quantitative and qualitative high-resolution (HR) dependent and independent acquisition schemes on a QqTOF MS (with resolving power 20,000–40,000) were investigated for the analysis of pharmaceutical compounds in biological fluids. High-resolution selected reaction mon-itoring (HR-SRM) was found to be linear over three orders of magnitude for quantitative analysis of paracetamol in human plasma, offering a real alternative to triple quad-rupole LC–SRM/MS. Metabolic stability of talinolol in microsomes was characterized by use of three different acquisition schemes: (i) information-dependent acquisition (IDA) with a TOF MS experiment as survey scan and product-ion scan as dependent scan; (ii) MSALLby collect-ing TOF mass spectra with and without fragmentation by alternating the collision energy of the collision cell between a low (i.e., 10 eV) and high setting (i.e., 40 eV); and (iii) a novel independent acquisition mode referred to as “sequen-tial window acquisition of all theoretical fragment-ion spec-tra” (SWATH) or “global precursor ions scan mode” (GPS) in which sequential precursor ions windows (typically 20 u) are used to collect the same spectrum precursor and frag-ment ions using a collision energy range. SWATH or GPS was found to be superior to IDA or MSALLin combination with UHPLC for qualitative analysis but requires a rapidly acquiring mass spectrometer. Finally, the GPS concept was used for QUAL/QUAN analysis (i.e. integration of qualitative
and quantitative analysis) of bosentan and its metabolites in urine over a concentration range from 5 to 2,500 ng mL−1. Keywords Mass spectrometry . High resolution . Fast chromatography . Metabolism . QUAL/QUAN
Introduction
In the drug-discovery process, the two major applications of liquid chromatography coupled to tandem mass spectrome-try (LC–MS–MS) are quantitative analysis of the parent drug and identification of the metabolic biotransformation products. Triple quadrupoles (QqQ), the instruments most often used in the selected reaction monitoring mode for sensitive, accurate, and precise quantification [1–3], also enable qualitative analysis with information acquisition schemes using full scan, precursor ion scan, selected reac-tion monitoring, or neutral loss scan as survey experiments and product ion scan as dependent experiments. Despite the high selectivity of QqQ, the major drawback is the moderate sensitivity for qualitative analysis. Therefore, in most cases, the samples are analyzed twice: first on a QqQ for quanti-fication and second on an ion trap (IT) or a quadrupole-time-of-flight (QqTOF) for qualitative analysis. Integration of qualitative analysis and quantitative analysis (QUAL/ QUAN) is, then, of great interest for drug discovery in which sample throughput and/or sample volume is critical and more high-quality data are needed to improve the drug-selection process. These schemes have already been explored on various mass spectrometers, including triple quadrupoles, triple quadrupole linear ion traps, and quadrupole-time-of-flight, but have not gained wide accep-tance mostly because of performance limitations of the MS instrumentation and workflow complexity [4–8]. With most Published in the special issue Analytical Sciences in Switzerland with
guest editors P. Dittrich, D. Günther, G. Hopfgartner, and R. Zenobi G. Hopfgartner (*)
:
D. Tonoli:
E. VaresioLife Sciences Mass Spectrometry, School of Pharmaceutical Sciences, University of Geneva, University of Lausanne, Quai Ernest-Ansermet, 30,
1211 Geneva 4, Switzerland e-mail: [email protected] DOI 10.1007/s00216-011-5641-8
atmospheric pressure ionization techniques, because of the variable analyte response factor and matrix effects [9], ab-solute quantification is mainly performed using reference compounds and relative quantification remains possible to follow the pharmacokinetic profile of metabolites.
Although for over two decades low-resolution instrumen-tation was mostly used to find metabolites and elucidate their structures, high-resolution (HR) mass spectrometry is becom-ing increasbecom-ingly essential for metabolite identification [10,11]. In practice, two categories of mass spectrometer can achieve high resolution (resolving power RP >30,000) with good mass accuracy (<5 ppm)—TOF-MS and Fourier transform (FT)-MS, including the FT ion cyclotron resonance and the Orbi-trap. The significant difference between the two types of instrument is the duty cycle [12]. Liquid chromatography is extremely important in analyte preconcentration and sample cleanup, and in recent years significant progress in separation efficiency in liquid chromatography has been realized with the development of sub-2μm particles or core-shell technology, resulting in LC peak widths of only a few seconds, which challenges the MS duty cycle [13]. High-resolution mass spectrometry is an attractive alternative to quadrupole SRM quantification because almost no tuning is required and large numbers of analytes can be analyzed simultaneously. Howev-er, similar sensitivity, precision and accuracy must be achieved with these instruments. With resolving power RP higher than 20,000, selected ion monitoring quantification started to attract interest, and recent work has shown the potential of new developments in mass spectrometric equipment for alternative approaches to SRM for quantitative analysis [14].
This work explores alternative approaches including tar-geted and not tartar-geted MS and MS–MS approaches based on high-resolution mass spectrometry with resolving power above 20,000 in combination with fast chromatography for QUAL/ QUAN analysis. The first part focuses on high-resolution se-lected reaction monitoring quantification of paracetamol in human plasma. The second part is dedicated to a novel acqui-sition strategy for drug metabolism based on multiple precursor ion windows, denoted sequential window acquisition of all theoretical fragments (SWATH) or global precursor scan (GPS), which is compared with commonly used information-dependent acquisition (IDA) and MSALLacquisition schemes. The last section is devoted, using analysis of bosentan and its metabolites in urine as an example, to description of the bene-fits and limitations of SWATH for QUAL/QUAN approaches.
Experimental
Chemicals and reagents
Methanol (MeOH) and acetonitrile (MeCN) were obtained from VWR (Leuven, Belgium). Ammonium acetate, formic
acid (FA), and acetic acid were obtained from Merck (Darmstadt, Germany). Acetaminophen, (paracetamol, APAP) was obtained from Sigma (Buchs, Switzerland). Acetaminophen-cysteine (APAP-CYS) trifluoroacetic acid salt, acetaminophen-glucuronide (APAP-GLU) monosodium salt, and the deuterated analogue of acetaminophen (APAP-d4) were purchased from Toronto Research Chemicals (Toronto, Canada). Bosentan, its metabolites (desmethylbo-sentan (M1), hydroxybo(desmethylbo-sentan (M2), and hydroxydesmethyl-bosentan (M3), and their d4 analogs, were obtained from Roche (Basel, Switzerland) and talinolol was kindly provided by Arzneimittelwerk Dresden (Dresden, Germany). Clonaze-pam was provided by Lipomed (Arlesheim, Switzerland) and oxycodone by Cambridge Isotope Laboratories (Andover, MA, USA). Rat liver microsomes (RLM) and human liver microsomes (HLM) were obtained from BD Biosciences (Allschwill, Switzerland).
Analysis of acetaminophen in human plasma Sample preparation
Protein in 50-μL plasma samples was precipitated by addi-tion of the ice-cold solvent mixture MeOH–EtOH (1:1v/v) in the ratio 4:1. Calibration standards and ISTD, APAP-d4, were added at this step (40μL of solutions in water added in total). Samples were then mixed on a Thermomixer (Vau-daux-Eppendorf, Buchs, Switzerland) for 10 min at 15 °C and 1,400 rpm. Subsequent centrifugation was performed at 4 °C and 14,000g for 12 min. The supernatant was then removed and evaporated to dryness. Sample reconstitution was performed in 100 μL 5 mmol L−1ammonium acetate buffer (pH 4.75), subsequently mixed for 10 min at 15 °C and 1,400 rpm. Human plasma (citrate) was provided by the University Hospital of Geneva.
LC–MS–MS analysis
HPLC was performed with an UltiMate 3000 micro-LC (Dionex, Germering, Germany), configured in binary high-pressure gradient mode and controlled by Chromeleon 6.70 software (Dionex). Mobile phase A was 5 mmol L−1 ammo-nium acetate buffer (pH 4.75) and mobile phase B was MeOH. The starting composition of the mobile phase was 5% B; this was held for 0.5 min, then changed to 25% B in 4.5 min, then to 80% B in 3 min (hold for 2 min), then back to 5% B in 0.1 min, and equilibrated for 9 min for the next injection. The column oven and the flow rate were set at 30 °C and 1 mL min−1, respectively. Samples (10μL) were injected on to an ODS-AQ 4.6 mm I.D. × 150 mm, S-5μm particle, reversed-phase column (YMC Europe, Dinslaken, Germany) with a 2.0 mm I.D. × 4.0 mm C18guard column
detection was performed with a quadrupole-TOF MS (Tri-pleTOF 5600, AB Sciex, Concord, Canada) operated in positive mode with a DuoSpray ion source in high-sensitivity mode at a resolving power (full width at half maximum, FWHM, at m/z 400) of approximately 20,000 in MS–MS and 30,000 in MS mode. The automated cali-bration device system (CDS) was set to perform an external calibration every three samples. The source conditions were: temperature 700 °C, curtain gas (CUR) 25, GS1 and GS2 at 60 and 70 (laboratory frame), respectively, and ion-spray voltage floating (ISVF) at 5.5 kV. Collision energies (CE) were set to 20 eV for APAP and d4, 13 eV for APAP-GLU, and 35 eV for APAP-CYS.
The acquisition method was composed of three different periods:
& period 1 (0–5.55 min) a product ion scan (precursor m/z 328.1, mass range m/z 100–1000, accumulation time 250 ms) and a TOF-MS scan (mass range m/z 100– 1000, accumulation time 200 ms);
& period 2 (5.55–6.61 min) a product ion scan (precursor m/z 271.1, mass range m/z 100–1000, accumulation time 250 ms) and a TOF-MS scan (mass range m/z 100–1000, accumulation time 200 ms); and
& period 3 (6.61–8.0 min) a product-ion scan (precursor m/ z 152.1, mass range m/z 100–1000, accumulation time 250 ms) and product ion scan (precursor m/z 156.1, mass range m/z 100–1000, accumulation time 250 ms). The duty cycle time for each period was 500 ms. Quan-tification was performed with MultiQuant 1.2 software (AB Sciex). The integration algorithm was MQL with Gaussian smooth width of two points using a linear regression model with 1/x2weighting. The extraction window for HR-SRM mode was set at 0.025 u for the fragment ions: APAP-GLU m/z 152.1, APAP-CYS m/z 140.0, APAP m/z 110.1, and APAP-d4m/z 114.1.
Analysis of talinolol incubation in microsomes
For microsomal incubations of talinolol, all concentrations given hereafter are final concentrations in the incubation mixtures. Pre-incubation at 37 °C in a Thermomixer was performed for 3 min after mixing of an appropriate volume of phosphate buffer (100μL minus the volume of the other
components), 1 mg mL−1 microsomes (RLM or HLM;
10μL) and 1 μmol L−1talinolol. NADPH (1.2 mmol L−1) was then added and incubation was again performed at 37 °C before quenching after different times (0.25, 0.5, 0.75, 1, 2, 4, and 6 h) by adding 400 μL MeOH–EtOH (1:1v/v) with ISTD (0.781μg mL−1oxycodone and clona-zepam in the precipitation solvent). Subsequent centrifuga-tion for 10 min at 4 °C and 12,000g was then performed and the supernatant was removed and evaporated to dryness
under vacuum in a Univapo 150 ECH concentrator (Uni-equip, Planneg, Germany). These fractions were kept dry at−20 °C until LC–MS(–MS) analysis.
The human and rat microsomal incubations of talinolol were analyzed on an UltiMate 3000 RSLC system from Dionex (Germering, Germany) controlled by Chromeleon 6.70 software (Dionex) and hyphenated to a TripleTOF 5600 mass spectrometer (AB Sciex) operating at a resolving power of approximately 40,000 (FWHM at m/z 400). Automated external calibration was performed every three samples. Mobile phase A was 0.1% formic acid (FA) in water and mobile phase B was 0.1% FA in MeCN. The flow rate was set at 600μL min−1The binary gradient was linear from 10% to 60% in 5 min The LC column was a Kinetex C18(2.1 mm I.D. × 100 mm, 1.7μm, Phenomenex)
and was thermostatted at 50 °C. The injection volume was of 5μL. Oxycodone and clonazepam were used as internal standards.
Three data acquisition schemes were investigated: 1. Information-dependent acquisition mode (cycle time
350 ms): HR TOF as survey scan (accumulation time 100 ms) and HR MS–MS as dependent scan with a CE range 20–50 eV (four MS–MS dependent experiments) (accumulation time 50 ms);
2. MSALL(cycle time 350ms): HR TOF MS at low energy (CE010 V) (accumulation time 150 ms) and HR TOF MS at high energy (CE035 V) (accumulation time 150 ms);
3. Sequential window acquisition of all theoretical frag-ment ions spectra (SWATH) (cycle time 375ms): 15 PIS (Q1 20 u window) (accumulation time 25 ms each PIS, CE range 20–50 eV).
For all experiments, the TOF mass range was m/z 50– 650. MS data acquisition was performed using Analyst TF 1.5.1 and data processing was performed using PeakView 1.1 software (AB Sciex).
LC-MS analysis of bosentan and its metabolites in urine Urine was spiked with bosentan and its three metabolites (M1–M3) to obtain calibration and QC samples containing 5, 10, 25, 50, 100, 250, 500, 1000, and 2500 ng mL−1). Urine was spiked with the d4 analogues used as internal standards to obtain a final concentration of 100 ng mL−1. Before analysis the urine was diluted five times with water and 5 μL was injected on to the LC system. The analytes were separated on a Luna C18(2) (2.0 mm I.D. × 100 mm, 2.5μm) LC column (Phenomenex, Brechbühler, Switzerland) in gradient mode using an UltiMate 3000 RSLC system from Dionex (Germer-ing, Germany) controlled by Chromeleon 6.70 software. Mo-bile phase A was 0.1% FA in H2O and mobile phase B was
90% B in 4 min The flow rate was of 0.4 mL min−1and the column was thermostatted at 40 °C. MS analysis was per-formed with a TripleTOF 5600 mass spectrometer in SWATH acquisition mode with eight Q1 windows of 20 u from m/z 494 to m/z 638. There was an overlap of 2m/z between each Q1 window. The TOF mass range was m/z 50–1000. Seven product ion experiments were further performed with Q1 set at unit resolution for the precursor ions: 538.3 (M1), 542.3 (M1-d4), 552.3 (Bosentan), 556.3 (Bosentan-d4), 554.3 (M3), 568.3 (M2), and 572.3 (M2-d4). The TOF mass range was m/z 50–650. The accumulation time was set for all experiments at 25 ms for a total cycle time of 375 ms. Nitrogen was used as collision gas and the collision energy was ramped from 20 to 60 eV. Quantification was performed with MultiQuant 2.0 software (AB Sciex). The integration algorithm was MQL, applying a standard Gaussian smoothing algorithm with a half-width equal to 1 point and using Wagner regression fit. The extraction window was set at 25 mDa for the bosentan, its metabolites and the d4 internal standards.
Results and discussion
Quantification of acetaminophen in human plasma by HR-SRM
Triple-quadrupole mass spectrometers have become the instruments most widely used for quantitative LC–MS anal-ysis in the selected reaction monitoring mode (SRM). The
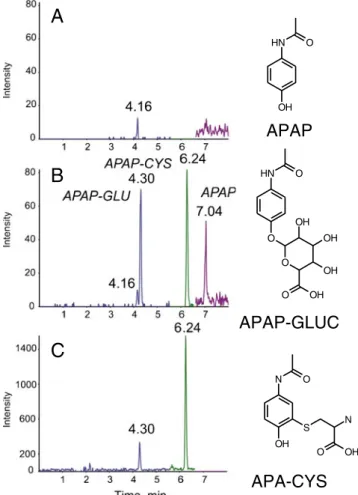
objective of this work was to evaluate the quantitative performance (i.e., precision, accuracy, and linearity) of the QqTOF instrument (TripleTOF 5600) in MS–MS mode for quantitative analysis of APAP in human plasma. The major advantage of high resolution MS–MS on a QqTOF, also referred as HR-SRM, compared with SRM is the limited MS method development. Indeed with HR-SRM acquisi-tion, the full-scan product-ion spectrum is recorded, and for quantitative analysis there is no need to define the product ion in advance; moreover, the MS–MS spectrum enables compound structural characterization to be performed. The analytes were isolated from the matrix by protein precipita-tion and separated by an LC gradient before MS detecprecipita-tion using positive polarity electrospray. The method was found to be linear over three orders of magnitudes (3.573 to 10,000 ng mL−1). Precision and accuracy for APAP quality controls (QC) are listed in Table1and were better than 15%. The dynamic range and limit of quantification were found to be similar to those of a triple-quadrupole instrument (4000 QTRAP, AB Sciex; data not shown), demonstrating the quantitative ability of the HR-SRM mode for APAP. Repre-sentative chromatograms obtained from a blank plasma sample and from a quality-control sample at the limit of quantification are shown in Fig. 1a and b. The LC–HR-SRM traces of two other monitored metabolites: APAP-GLU, a phase II metabolite of APAP, and APAP-CYS, a further metabolite of the APAP-glutathione metabolite, are also presented in Fig.1. The APAP-GLU trace of the blank plasma shows an interfering ion at tr04.16 min, which is
Table 1 Precision and accuracy for quantification of APAP in human plasma (calibration and QC samples) Calibration standards Conc. (ng mL−1) Measured concentration (ng mL−1) Mean (ng mL−1) RSD (%) Accuracy (%) Day 1 Day 2
Series 1 Series 2 Series 3
Cal 1 3.573 3.695 3.497 3.386 3.526 4.4 98.7 Cal 2 6.253 5.966 6.350 6.768 6.361 6.3 102 Cal 3 15.63 15.25 16.62 15.92 15.93 4.3 102 Cal 4 40.02 38.41 38.15 39.83 38.80 2.3 96.9 Cal 5 100.1 103.3 103.8 103.6 103.6 0.2 103 Cal 6 250.1 244.8 258.2 254.8 252.6 2.8 101 Cal 7 640.3 680.9 677.3 656.6 671.6 2.0 105 Cal 8 1601 1651 1586 1565 1601 2.8 100 Cal 9 4002 4131 3846 3828 3935 4.3 98.3 Cal 10 10010 9404 9108 9435 9316 1.9 93.1 QC LLOQ 3.573 3.060 3.784 3.881 3.575 13 100 Low 6.253 5.918 6.711 6.005 6.211 7.0 99.3 Medium 250.1 244.2 253.9 265.9 254.7 4.3 102 High 10010 9174 9348 9075 9199 1.5 91.9
well separated from APAP-GLU eluting at tr04.3 min and is
small enough to not affect quantitative performance. Inter-estingly, the extracted ion current profile in TOF mode at RP 30,000 (i.e., high resolution selected ion monitoring, or HR-SIM) does not show the interference (Fig.1c). It is generally accepted that MS–MS provides additional selectivity and therefore better limits of quantification. However, one must remember that isolation of the precursor ion is performed at unit mass. In this case, several ions were observed in 1-u precursor windows at m/z 328 in TOF mode, and one of these generated isobaric fragment interference. To define which acquisition mode between HR-SIM and HR-SRM is optimum for quantification performance, and which RP is required, remains a difficult task. Certainly a resolving power of 10,000 is not sufficient and it is considered that an RP of 30,000 seems to be adequate for HR-SIM analysis [15]. How-ever, HR-SRM gains from better signal-to-noise ratio and, in general, several product ions are available for quantitative analysis. Ultimately, which approach will be more efficient is
certainly analyte and limit of quantification-dependent and the use of both approaches is highly recommended.
LC–MS analysis of talinolol incubations in liver microsomes
Investigation of metabolic stability in microsomes is an important step in early drug characterization. Degradation of the parent drug can be measured on a triple-quadrupole instrument by using the selected reaction monitoring mode, and the metabolites can be detected by using subsequent experiments, for example targeted product ion, neutral loss, or precursor ion scan modes. However, triple-quadrupole instruments suffer from limited sensitivity in these modes and, generally, product-ion spectra are recorded on ion-trap or triple-quadrupole linear ion-trap instruments. High-resolution mass spectrometry offers unique possibilities for quantification of the parent drug but also for identification of metabolites. Quantification can be performed in selected-ion monitoring mode post-acquisition or in HR-selected reaction monitoring mode, and metabolites can be identified using either predictive metabolism [16] or mass defect filtering [17].
Talinolol is a highly efficient and selective β1
-adreno-ceptor blocking agent. Oxidation at the cyclohexyl moiety has been described as the major metabolic pathway gener-ating several metabolites hydroxylated in different stereo-chemical positions [18]. After incubation for 2 h of a 1 μmol L−1 solution talinolol in rat liver microsomes, six hydroxylated metabolites could be identified (Fig. 2, M1– M6) by use of mass-defect filtering. A mass defect filter is based on the shift of the mass defect from the parent drug (the non-integral value from the nominal value) to its metab-olites. The filter (windows of 25 mDa for phase I metabo-lites) retains m/z ions, defects of which are close to that of the parent drug, and interfering ions are automatically re-moved. Elemental formulas are generated with accurate
A
B
C
APAP
APAP-GLUC
APA-CYS
O N H OH O N H O OH OH OH O O OH O N OH S N OH OFig. 1 LC–MS traces of APAP, APAP-CYS, and APAP-GLU in human plasma. (A) HR-SRM traces obtained from blank plasma. (B) HR-SRM traces obtained from an APAP quality-control sample at the LOQ (3.573 ng mL−1). (C) HR-SIM traces obtained from an APAP quality-control sample at the LOQ (3.573 ng mL−1)
talinolol M1 M2 M3 M4 M5 M6 m/z 364.2595 ± 0.0125 m/z 380.2444 ± 0.0125 minutes counts N H N H O N H OH O
Fig. 2 Extracted ion current profile for talinolol and its hydroxylated metabolites from MS-TOF acquisition at a resolving power of 30,000 after incubation of talinolol with rat liver microsomes for 2 h
mass and isotopic distribution fit. The decrease of the parent drug and the increase of the metabolites during incubation for 6 h could be quantified post-acquisition by use of HR-SIM. Chromatographic resolving power is essential in drug metabolism studies, particularly when many isobaric metab-olites are generated. With our chromatographic arrangement using 1.7-μm particle columns, the chromatographic peak width was approximately 1–2 s. For quantitative analysis, approximately 10–12 data points are required, meaning that the total duty cycle of all experiments should not exceed 350 ms to maintain chromatographic performance. Whereas HR full scan can be used to find and quantify metabolites, generation of product-ion spectra remains essential for char-acterization of structure. Typical metabolite identification is based on information-dependent acquisition (IDA) in which HR full scan serves as survey scan and four product ion spectra are recorded as dependent scans by applying on-the-fly selection criteria to the survey scan, for example mass defect filtering. The product-ion spectrum of metabolite M4 is illustrated in Fig.3a. Hydroxylation is a major metabolic process and hydroxylation of talinolol can occur at the tert-butyl, benzyl, or cyclohexyl moiety. Spectra interpretation is often challenging and a variety of approaches can be con-sidered, for example:
1. comparison with synthetic reference; or
2. use of prediction software based on fragmentation rules. Accurate mass is particularly useful for interpretation of MS–MS spectra because it enables calculation of elemental formulae for the fragments and definition of whether they are even or odd-electron ions [10]. In this instance we used a bottom-up approach to perform spectral interpretation on the basis of the structural constraints of the talinolol and the
A
B
C
counts counts countsFig. 3 Mass spectrum of metabolite M4 at retention time 1.74 min. (A) Information-independent acquisition mode with a dependent product-ion spectrum, Q1 at unit mass. (B) MSALL, high-energy experi-ment. (C) SWATH spectrum with Q1 window m/z 374–394
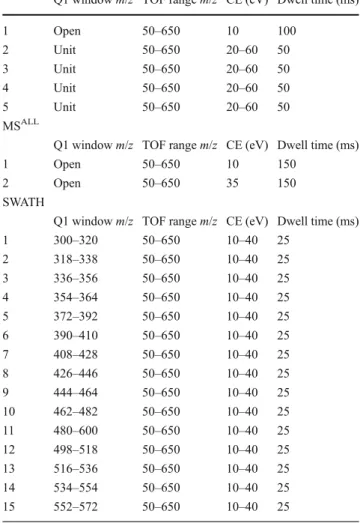
Table 2 Experimental arrangement of talinolol LC–MS analysis after two incubations in rat liver microsomes Information-dependent acquisition
Q1 window m/z TOF range m/z CE (eV) Dwell time (ms)
1 Open 50–650 10 100 2 Unit 50–650 20–60 50 3 Unit 50–650 20–60 50 4 Unit 50–650 20–60 50 5 Unit 50–650 20–60 50 MSALL
Q1 window m/z TOF range m/z CE (eV) Dwell time (ms)
1 Open 50–650 10 150
2 Open 50–650 35 150
SWATH
Q1 window m/z TOF range m/z CE (eV) Dwell time (ms)
1 300–320 50–650 10–40 25 2 318–338 50–650 10–40 25 3 336–356 50–650 10–40 25 4 354–364 50–650 10–40 25 5 372–392 50–650 10–40 25 6 390–410 50–650 10–40 25 7 408–428 50–650 10–40 25 8 426–446 50–650 10–40 25 9 444–464 50–650 10–40 25 10 462–482 50–650 10–40 25 11 480–600 50–650 10–40 25 12 498–518 50–650 10–40 25 13 516–536 50–650 10–40 25 14 534–554 50–650 10–40 25 15 552–572 50–650 10–40 25
measured fragments. PeakView software has a fragment pane option that calculates all possible even or odd-electron frag-ments by cutting existing bonds. For the fragfrag-ments of metab-olite M4, m/z 209 and 226 ions were found to be specific for the unchanged benzyl moiety. At that stage, it could be pos-tulated that hydroxylation occurred at the tert-butyl or cyclo-hexyl moiety. In a second iteration, both possible structures were submitted to the fragment pane routine and it was found that fragments at m/z 324 and m/z 116 were specific for the structure with the hydroxylation at the cyclohexyl moiety. M2 to M6 could be identified as talinolol hydroxylated at the cyclohexyl moiety, and M1 was oxidized at the tert-butyl moiety. The major advantage of the bottom-up approach compared with the use of fragmentation rules is that the software is issued to match the fragment ions with the struc-tural and elemental composition constraints of the parent drug in a first iteration and is independent of fragmentation rules that are compound-dependent.
IDA is a powerful supervised MS(–MS) acquisition tech-nique but has two main limitations:
1. some relevant precursor ions will not be selected for performing collision-induced dissociation whatever se-lection criteria are defined; and
2. quantification is challenging because no continuous da-ta are collected during the complete LC peak elution. In combination with liquid chromatography, unsupervised MS and MS–MS spectra generation have been described and are generally referred as MSEor MSALL. In such an arrange-ment, data are collected on a high-resolution instrument typ-ically of QqTOF geometry with the quadrupole operating in wideband mode and collecting, alternately, mass spectra with and without fragmentation by setting the collision energy of the collision cell in low (i.e. 10 eV) and high mode (i.e. 40 eV). Because only two experiments are necessary, the MS duty cycle is far less critical compared with IDA or multiple product ion scan experiments. The background-subtracted MSALLspectrum (high-energy) of metabolite M4 (talinolol incubation 2 h) is illustrated in Fig.3b. Most of the ions present in Fig.3aare present in this spectrum. Compared with the product-ion spectrum obtained by unit mass Q1 isolation, the MSALLexperiment has no selection of the pre-cursor ion and additional ions are observed at m/z 80 or m/z 428 which do not originate from the hydroxylated talinolol precursor ion but arise from co-eluting interferences. Data processing can be used to improve the quality of the spectra but does not enable generation of high-quality spectra [19] from low-intensity peaks, for example those of metabolites M2 and M1. MSALLtheoretically enables generation of MS– MS data for any precursor ion but suffers from lack of selec-tivity, because of the absence of precursor ion selection, and therefore challenges data processing, in particular with dirty
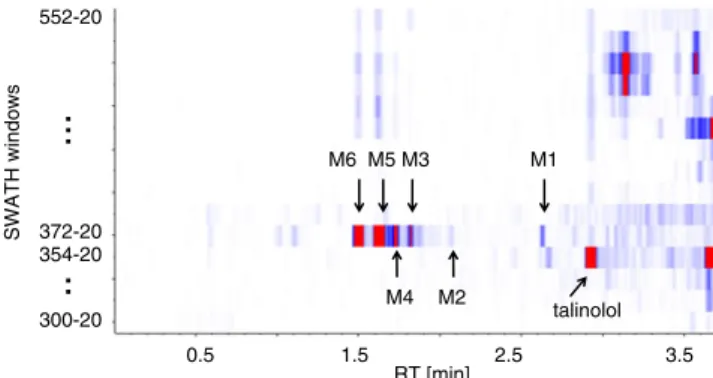
0.5 1.5 2.5 3.5 300-20 372-20 354-20 552-20 talinolol M6 M5 M4 M3 M2 M1 SWATH windows RT [min]
...
..
Fig. 4 Heat map of SWATH experiments (15 product-ion experi-ments) of the LC–MS analysis after incubation of talinolol with rat liver microsomes for 2 h. Blue (zero), red max signal corresponding to 10% of base peak O NH S O O O N N N N O OH R1 R2 P : R2 : H R1 : CH3 M1 :R2 : H R1 : H M2 : R2 : OH R1 : CH3 M3 : R2 : OH R1 : H P M1 M2 M3
A
B
cps cps Fig. 5 LC–MS analysis of bosentan and its metabolites spiked at 100 ng mL−1in urine. (A) Total ion chromatogram obtained from 15 MS–MS experiments (eight SWATH and seven product-ion experi-ments). (B) Extracted ion cur-rent profile from SWATH windows using a 0.025-u windowsamples. On the other hand, on the LC time scale, using unit Q1 window, a given mass range (i.e. m/z 50-650) would result in 600 MS–MS experiments being performed.
An interesting approach to keep the benefits of the MSALL approach and to reduce sample complexity is to use multiple Q1 precursor ion windows at a given width (i.e. 25 u). This independent acquisition method is referred as sequential win-dow acquisition of all theoretical fragment ions spectra (SWATH) and has been described for analysis of peptides [20,21]. It has also been used for qualitative analysis of low-molecular-weight compounds, and was called global precursor ions scan mode (GPS) [22]. The talinolol sample incubated for 2 h with rat liver microsomes was analyzed using 15 product-ion scan experiments (m/z 50–650) with Q1 set at an increas-ing 20 u window (Table 2). To maintain a reasonable duty cycle of 375 ms for UHPLC, the duty cycle for each experi-ment was set to 25 ms on the QqTOF instruexperi-ment. In contrast with MSALL, for which two experiments are necessary, in SWATH mode intact precursor and fragment ions are collected in the same spectrum. This is achieved by using a collision energy ramp in the collision cell (i.e. 10, to 45 eV) from low to high. Each acquired Q1 isolation window can be processed individually by applying a variety of filtering techniques, for example isotope filter or mass defect filter. An elegant way to visualize the data is to use heat-map representation as illustrat-ed in Fig.4. It can be clearly seen that metabolites M1–M6 are measured in the same window (m/z 372–392) whereas talino-lol is measured in a different one (m/z 354–374). In this analysis, the mass range covered was 272 u, which is sufficient to investigate phase I metabolites. The Q1 isolation window was set to 20 u and centered on the m/z value of talinolol. To cover phase I and II metabolites variable windows sizes should be defined. In a SWATH experiment, all the relevant data are collected in a single LC–MS analysis and the data can be processed post-acquisition using any strategy. The product
ions spectrum of metabolite M4 is presented in Fig.3cand, compared with the MSALL experiment, no interferences are observed around low mass fragments. In contrast with the MSALLexperiments, metabolites M1 and M2 could also clear-ly be characterized from their product-ion spectra. As a matter of fact, SWATH has several advantages over MSALL: 1. precursor and fragment ions in the same spectrum; 2. fewer precursor ion interferences; and
3. quantitative analysis can be performed on the precursor ion or on any fragment ions.
QUAL/QUAN analysis of bosentan in urine by sequential window acquisition of all theoretical fragment ions spectra or global precursor ions scan
Bosentan (Tracleer) is an oral dual endothelin receptor antagonist which is currently approved for treatment of
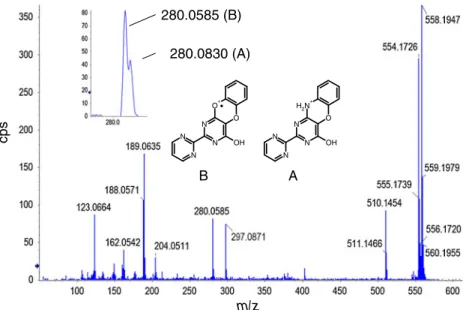
280.0585 (B) 280.0830 (A) N N N N O O+ OH N N N N O N H2 + OH B A cps m/z
Fig. 6 SWATH spectrum of metabolite M3 from Fig.5, with Q1 window m/z 548–568
Table 3 Precision and accuracy for analysis of bosentan and its desmethylhydroxy metabolite in urine, on the basis of quality-control samples ng mL−1 n01 n02 n03 Average RSD (%) Accuracy (%) Bosentan QC01 5 4.42 4.40 4.93 4.58 6.6 91.6 QC02 10 10.6 10.8 10.2 10.6 2.9 105 QC06 250 252 306 296 285 10 114 QC08 1000 651 1182 1181 1005 31 101 Desmethylhydroxybosentan QC01 5 4.29 4.19 3.53 4.00 10 80 QC02 10 8.80 7.21 7.78 7.90 10 79 QC06 250 301 259 232 265 14 106 QC08 1000 1080 897 1101 1026 11 103
pulmonary arterial hypertension (PAH) [23]. Bosentan forms three metabolites (Fig.5): M1, desmethylbosentan, M2, hydroxy bosentan, and M3, desmethylhydroxylbo-sentan. Several LC–MS–MS methods have been devel-oped to quantify bosentan and its metabolites in plasma using the selected reaction monitoring mode [24] and the fragmentation mechanism has been extensively investi-gated [10,25]. Bosentan was used as a model compound to further investigate the potential and limitations of GPS for QUAL/QUAN approaches. In this study the analytes were analyzed from 5 to 2,500 ng mL−1, in urine, be-cause urine resulted in a more complex endogenous background (Fig. 5a) than plasma. With GPS analysis, only one type of spectrum is generated, namely a product-ion spectrum. By use of collision energy spread, typically of 40 V, the precursor ions are still present in the spectrum and also fragment ions can be recorded over the complete mass range (Fig. 6) and can be used for quantification. For bosentan and its metabolites, deu-terium labeling (d4) of the internal standards is located on the hydroxyethoxy side chain and the product-ion spectra of the d0 and d4 analogs give exactly the same fragments. Therefore, with a Q1 isolation window of 20 u it is not always possible to perform quantitative anal-ysis in HR-SRM mode with isotopically labeled internal standards. However, it is still possible to perform HR-selected ion monitoring (HR-SIM) quantitative analysis on the precursor’s ions, on the basis of their different m/ z. Precision and accuracy for quality-control samples of bosentan and its desmethylhydroxyl metabolite over the concentration range 5–2,500 ng mL−1 are summarized in Table 3. Considering the accumulation time was only 25 ms, the results were found to be acceptable for drug-discovery work. If the objective is to follow the parent drug pharmacokinetics by use of HR-SRM mode, one can also combine GPS experiments with classical product-ion scans in which the Q1 isolation window is 1 u. As discussed previously, the major interest in SWATH or GPS experiments is to collect all information in a single LC–MS analysis, which is of great interest for identification of biotransformation of the parent drug and for absolute and relative quantification. Bosentan remains one of the first examples of fragmentation at low energy involving a radical fragmentation of an even-electron ion at the sulfonamide bond [25]. Also, two different frag-mentation mechanisms illustrated for the different metab-olites involve loss of radical hydroxyl (.OH, m/z 280.0585) or neutral ammonia (NH3, m/z 280.030) both
of 16 u. A resolving power of 10,000 was not sufficient to clearly differentiate both mechanisms and a RP of at least 20,000 was necessary to distinguish these frag-ments, as illustrated in Fig. 6. Because many pharma-ceutical compounds are composed by C, H, N, O, or S,
an RP lower than 20,000 is considered to be critical for MS and MS–MS spectra interpretation.
Conclusions
High-resolution mass spectrometry on a rapid acquisition (<50 ms) QqTOF instrument with resolving power above 20,000 leads to new possibilities in QUAL/QUAN analysis. First, it enables the analyst to benefit fully from the in-creased separation performance of fast or ultra-high perfor-mance liquid chromatography without compromising chromatographic performance. Second, in quantitative anal-ysis of acetaminophen in the HR-SRM mode, similar quan-titative performance could be achieved as for quadrupole-type instruments. For QUAL/QUAN drug-discovery work, several dependent and independent MS strategies were con-sidered including: targeted product ions scan, information-dependent acquisition, MSALL, and the sequential window acquisition of all theoretical fragment ions spectra concept. Compared with MSALL, global precursor ions scan (GPS), which is the low-molecular-weight version of SWATH, resulted in significant performance improvement and simplified data processing, because all the information is collected in a single LC–MS run and precursor and fragment ions are recorded within the same spectrum. Al-though the potential of GPS has been demonstrated for drug metabolism, it could also be applied in environmental, tox-icology, doping, or food analysis, and in metabolomics investigations.
Acknowledgements The authors would like to acknowledge Dionex (F. Steiner, M. Martin, F. Sabini) for support with the UltiMate 3000 Dual RSLC system. The authors would also thank Stephen Tate and Yves J.C. Le Blanc (AB Sciex) for their support with the SWATH experiments and Lyle Burton and Ron Bonner (AB Sciex) for Peak-View software support.
References
1. Hopfgartner G, Bourgogne E (2003) Quantitative high-throughput analysis of drugs in biological matrices by mass spectrometry. Mass Spectrom Rev 22(3):195–214
2. Jemal M, Xia YQ (2006) LC–MS development strategies for quantitative bioanalysis. Curr Drug Metab 7(5):491–502 3. Korfmacher W (2005) Bioanalytical assays in a drug discovery
environment In: Korfmacher W (ed) Using mass spectrometry for drug metabolism. CRC Press, Boca Raton, FL
4. Olah TV, McLoughlin DA, Gilbert JD (1997) The simultaneous determination of mixtures of drug candidates by liquid chromatog-raphy atmospheric pressure chemical ionization mass spectrometry as an in vivo drug screening procedure. Rapid Commun Mas Sp 11 (1):17–23
5. Poon GK, Kwei G, Wang R, Lyons K, Chen Q, Didolkar V, Hop CECA (1999) Integrating qualitative and quantitative liquid
chromatography/tandem mass spectrometric analysis to support drug discovery. Rapid Commun Mas Sp 13(19):1943–1950 6. Hopfgartner G, Husser C, Zell M (2003) Rapid screening and
characterization of drug metabolites using a new quadrupole –lin-ear ion trap mass spectrometer. J Mass Spectrom 38(2):138–150 7. Wrona M, Mauriala T, Bateman KP, Mortishire-Smith RJ, O'Connor
D (2005) 'All-in-One' analysis for metabolite identification using liquid chromatography/hybrid quadrupole time-of-flight mass spec-trometry with collision energy switching. Rapid Commun Mas Sp 19 (18):2597–2602
8. Bateman KP, Kellmann M, Muenster H, Papp R, Taylor L (2009) Quantitative–Qualitative Data Acquisition Using a Benchtop Orbi-trap Mass Spectrometer. J Am Soc Mass Spectrom 20(8):1441– 1450
9. Cappiello A, Trufelli H, Palma P, Famiglini G (2011) An Overview of Matrix Effects in Liquid Chromatography–Mass Spectrometry. Mass Spectrom Rev 30(3):491–509
10. Hopfgartner G, Chernushevich IV, Covey T, Plomley JB, Bonner R (1999) Exact mass measurement of product ions for the struc-tural elucidation of drug metabolites with a tandem quadrupole orthogonal-acceleration time-of-flight mass spectrometer. J Am Soc Mass Spectrom 10(12):1305–1314
11. Zhang HW, Henion J, Yang Y, Spooner N (2000) Application of atmospheric pressure ionization time-of-flight mass spectrometry coupled with liquid chromatography for the characterization of in vitro drug metabolites. Anal Chem 72(14):3342–3348
12. Scigelova M, Makarov A (2010) Coupling liquid chromatography to Orbitrap mass spectrometry. J Chromatogr A 1217(25):3938– 3945. doi:10.1016/j.chroma.2010.02.022
13. Hopfgartner G (2011) Can MS fully exploit the benefits of fast chromatography? Bioanalysis 3(2):121–123
14. Korfmacher W (2011) High-resolution mass spectrometry will dramatically change our drug-discovery bioanalysis procedures. Bioanalysis 3(11):1169–1171. doi:10.4155/Bio.11.98
15. Ramanathan R, Jemal M, Ramagiri S, Xia Y-Q, Humpreys WG, Olah T, Korfmacher WA (2011) It is time for a paradigm shift in drug discovery bioanalysis: from SRM to HRMS. J Mass Spec-trom 46(6):595–601
16. Anari MR, Baillie TA (2005) Bridging cheminformatic metabolite prediction and tandem mass spectrometry. Drug Discov Today 10 (10):711–717
17. Zhang HY, Zhang DL, Ray K, Zhu MS (2009) Mass defect filter technique and its applications to drug metabolite identification by high-resolution mass spectrometry. J Mass Spectrom 44(7):999– 1016
18. Schupke H, Hempel R, Eckardt R, Kronbach T (1996) Identifica-tion of talinolol metabolites in urine of man, dog, rat and mouse after oral administration by high-performance liquid chromatogra-phy thermospray tandem mass spectrometry. J Mass Spectrom 31 (12):1371–1381
19. Bonner R, Ivosev G, Burton L (2008) Dimensionality reduction and visualization in principal component analysis. Anal Chem 80 (13):4933–4944
20. Navarro P, Gillet L, Tate S, Rinner O, Reiter L, Nan J, Bonner R, Aebersold R An extended bioinformatics pipeline for the high-throughput SRM-like analysis of data generated upon swath MS data independent acquisition. In: Proceedings of the 59th ASMS Conference on Mass Spectrometry and Allied Topics, Denver, CO, 2011
21. Gillet L, Navarro P, Tate S, Röst H, Bonner R, Aebersold R Swath MS: a novel data independent acquisition method with sequential precursor isolation windows allowing unlimited SRM-like data analysis and quantification In: Proceedings of the 59th ASMS Conference on Mass Spectrometry and Allied Topics Denver, CO, 2011
22. Hopfgartner G, Tonoli D, Varesio E High Resolution Mass Spec-trometry for Structural Elucidation and Quantitation of Drugs and their Metabolites based on Multiple MS and MS/MS Workflows In: Proceedings of the 59th ASMS Conference on Mass Spectrom-etry and Allied Topics, Denver, CO, 2011
23. Roux S, Breu V, Ertel SI, Clozel M (1999) Endothelin antagonism with bosentan: a review of potential applications. J Mol Med 77 (4):364–376
24. Dell D, Lausecker B, Hopfgartner G, Van Giersbergen PLM, Dingemanse J (2002) Evolving bioanalytical methods for the cardiovascular drug bosentan. Chromatographia 55(Suppl):S115– S120
25. Hopfgartner G, Vetter W, Meister W, Ramuz H (1996) Fragmen-tation of Bosentan (Ro 47-0203) in ion-spray mass spectrometry after collision-induced dissociation at low energy: a case of radical fragmentation of an even-electron ion. J Mass Spectrom 31(1):69– 76