HAL Id: hal-00318025
https://hal.archives-ouvertes.fr/hal-00318025
Submitted on 30 Nov 2005
HAL is a multi-disciplinary open access
archive for the deposit and dissemination of
sci-entific research documents, whether they are
pub-lished or not. The documents may come from
teaching and research institutions in France or
abroad, or from public or private research centers.
L’archive ouverte pluridisciplinaire HAL, est
destinée au dépôt et à la diffusion de documents
scientifiques de niveau recherche, publiés ou non,
émanant des établissements d’enseignement et de
recherche français ou étrangers, des laboratoires
publics ou privés.
Studies on atmospheric gravity wave activity in the
troposphere and lower stratosphere over a tropical
station at Gadanki
I. V. Subba Reddy, D. Narayana Rao, A. Narendra Babu, M. Venkat Ratnam,
P. Kishore, S. Vijaya Bhaskara Rao
To cite this version:
I. V. Subba Reddy, D. Narayana Rao, A. Narendra Babu, M. Venkat Ratnam, P. Kishore, et al..
Studies on atmospheric gravity wave activity in the troposphere and lower stratosphere over a tropical
station at Gadanki. Annales Geophysicae, European Geosciences Union, 2005, 23 (10), pp.3237-3260.
�hal-00318025�
© European Geosciences Union 2005
Geophysicae
Studies on atmospheric gravity wave activity in the troposphere and
lower stratosphere over a tropical station at Gadanki
I. V. Subba Reddy1, D. Narayana Rao2, A. Narendra Babu1, M. Venkat Ratnam3, P. Kishore4, and S. Vijaya Bhaskara Rao1
1Department of Physics, Sri Venkateswara University, Tirupati - 517 502, India 2National MST Radar Facility, Department. of Space, Gadanki - 517 112, India
3Research Institute for Sustainable Humanosphere, Kyoto University, Uji, Kyoto 611 0011, Japan 4National Institute of Information and Communications Technology, Tokyo 184-8795, Japan
Received: 1 December 2003 – Revised: 25 August 2005 – Accepted: 20 September 20054 – Published: 30 November 2005
Abstract. MST radars are powerful tools to study the meso-sphere, stratosphere and troposphere and have made consid-erable contributions to the studies of the dynamics of the upper, middle and lower atmosphere. Atmospheric gravity waves play a significant role in controlling middle and up-per atmospheric dynamics. To date, frontal systems, con-vection, wind shear and topography have been thought to be the sources of gravity waves in the troposphere. All these studies pointed out that it is very essential to understand the generation, propagation and climatology of gravity waves. In this regard, several campaigns using Indian MST Radar ob-servations have been carried out to explore the gravity wave activity over Gadanki in the troposphere and the lower strato-sphere. The signatures of the gravity waves in the wind fields have been studied in four seasons viz., summer, monsoon, post-monsoon and winter. The large wind fluctuations were more prominent above 10 km during the summer and mon-soon seasons. The wave periods are ranging from 10 min– 175 min. The power spectral densities of gravity waves are found to be maximum in the stratospheric region. The ver-tical wavelength and the propagation direction of gravity waves were determined using hodograph analysis. The re-sults show both down ward and upward propagating waves with a maximum vertical wave length of 3.3 km. The grav-ity wave associated momentum fluxes show that long period gravity waves carry more momentum flux than the short pe-riod waves and this is presented.
Keywords. Meteorology and atmospheric dynamics (Con-vective processes; Middle atmosphere dynamics; Tropical meteorology; Waves and tides)
1 Introduction
Gravity waves play an important role in transporting the momentum and energy through longer distances, both Correspondence to: I. V. Subba Reddy
(isubbareddy@rediffmail.com)
horizontally and vertically and they can also be important in both the large- and small-scale dynamics of the atmosphere through their vertical transport of horizontal momentum and energy, and through complex wave/turbulence interactions. The upward propagating waves with increasing amplitude have the ability to transfer momentum and energy, and to deposit the same in the upper atmosphere through dissipa-tion. The MST radars have established the importance of gravity waves in the lower stratosphere and troposphere re-gions and are diagnostic of the dynamics of the troposphere and stratosphere. Recent theoretical studies on gravity waves have shown the importance of excitation and vertical propa-gation of gravity waves and their forcing on the large-scale circulation and structure of the lower and middle atmosphere. Considerable progress has occurred in our understanding of middle atmosphere gravity waves in the four decades since the pioneering study by Hines (1960). A thorough review of the understanding of the processes responsible for gravity wave saturation, and its effects and variability of saturation is given by Dunkerton (1989) and Fritts (1989). Recently, Fritts and Alexander (2003) have reviewed the gravity wave dynamics and effects in the middle atmosphere. In spite of the importance and significant advancements, only very few studies are available in the tropical latitudes. Owing to smaller temporal and spatial scale sizes of cumulus convec-tion, its observations at meso-scale using existing techniques like rockets and satellites have been extremely difficult. Sig-nificant improvements in the MST radar technique have led to study these wave phenomena with large spatial and tem-poral resolutions (Balsley and Gage, 1980; Worthington and Thomas, 1997; Chang et al., 1997). VHF radar is a promising tool to study such events and their dynamical effects, because MST radars offer the unique capability of directly measuring the vertical velocity and also horizontal velocities with high spatial and temporal resolutions. Although vertical motions are of several orders of magnitude smaller than horizontal motion, they are important for studying dynamical processes in the atmosphere.
3238 I. V. Subba Reddy et al.: Studies on atmospheric gravity wave activity at Gadanki Most of the sources for the generation of gravity waves
lie in the troposphere (Fritts and Nastrom, 1992). The high-frequency gravity waves dominate energy and momentum transport, and these waves propagate nearly vertically and are thus more likely to evoke localized responses in the mid-dle atmosphere to local sources at lower levels. Many efforts in the past had been made to study the sources of short-period gravity waves. Some of the sources have been identified as topography (Nastrom et al., 1987; Nastrom and Fritts, 1992), convective and frontal activity (Clark et al., 1986; Fritts and Nastrom, 1992) and wind shear (Fritts, 1982, 1984), unstable wind shears and convection (Fritts et al., 1984 and Nastrom et al., 1990). Karoly et al. (1996) have shown the existence of seasonal dependence in the occurrence of convection waves in the tropics. There have been a few important observa-tions on the generation of gravity waves due to convection processes using VHF radars (Fritts and Nastrom, 1992; Sato, 1993; Sato et al., 1995) which showed strong wind fluctua-tions, like gravity waves associated with a cold vortex, using the MU radar at Shigaraki, Japan. Shibagaki et al. (1997) re-ported on intensive observations of a vertical wind pattern near “Baiu Front”, using VHF (MU radar) and other mi-crowave radars.
Studies of gravity wave excitation sources (Nastrom and Fritts, 1992; Fritts and Nastrom, 1992) showed that the wind velocity variance, which is considered to be an index of grav-ity wave activgrav-ity, enhanced over rough terrain, and also dur-ing events of jet stream enhancement, fronts, and strong con-vection. Tsuda et al. (1994a) reported that in the equatorial region, gravity wave generation was typically associated with deep convection. Dhaka et al. (2001, 2002) showed gravity wave activity associated with convection over a tropical re-gion by using Indian MST Radar. These waves have typi-cally periods of a few tens of minutes. The generation of gravity waves has also been attributed to various instability mechanisms occurring in the tropospheric region. Kelvin-Helmholtz instability is one such kind. These unstable wind shears are common sources of vertically propagating gravity waves in the atmosphere (Fritts, 1982). Jet streams are iden-tified as a source of gravity wave generation (Fritts and Luo, 1992). One possible source of long-period gravity waves in the atmosphere is the jet stream (e.g. Schubert et al., 1980; Fritts and Luo, 1992; Luo and Fritts, 1993; Sasi et al., 1998). Near the jet stream maximum wind shears are very high, providing conditions favorable for the occurrence of shear instability and the generation of gravity waves. Tsuda et al. (1994a), using radiosondes, measured the variability in gravity wave activities over a station in Indonesia (7.57◦S, 112.68◦E) and suggested a correlation between convection and enhancement in the gravity wave activities. Ogino et al. (1995) studied a data set of rawinsondes launched from a research vessel which sailed from 14◦S–25◦N over the Western Pacific and pointed out that the tropical convection system acts as a major tropospheric source for gravity waves. It was further seen that gravity wave activity in the tropics, particularly in the wet season, is larger than in the subtropics (Allen and Vincent, 1995). They also found that gravity wave
activity in the lower stratosphere was larger at low latitudes and maximized during the winter at mid-latitudes and dur-ing the wet season (December to February) at low-latitudes. Karoly et al. (1996) have shown the existence of seasonal de-pendence in the occurrence of convection waves in the trop-ics. The analyses of satellite data have provided a global view on gravity wave activities which represents their sea-sonal and vertical variations, as well as geographic patterns (Fetzer and Gille, 1994; Wu and Waters, 1996). These obser-vations suggest that the tropical region acts as a significant source for the generation of gravity waves.
Fritts and Nastrom (1992) analysed Global Atmospheric Sampling Program (GASP) data collected by commercial aircraft, as well as meteorological satellite data, in order to determine the influence of gravity wave sources near the tropopause on horizontal velocity and temperature variances. They found that the mean variances increased considerably with the presence of a jet stream, frontal activity, as well as nonfrontal convection. Using radiosonde observations Tsuda et al. (1994a) showed that gravity waves were mostly gen-erated in the middle troposphere and that the waves which reached the stratosphere were propagating upward.
It is considered highly desirable to formalise the sta-tus of gravity wave efforts engaged in long-term and cam-paign studies of an important and poorly understood region in the atmosphere, which includes the mesopause and the tropopause, including the dynamo region. It is the region through which the mesosphere, stratosphere and troposphere are dynamically coupled, and hence bear relevance to the overall theme of stratosphere-troposphere exchange (STE).
In this regard, several campaigns using Indian MST Radar have been carried out to explore the gravity wave activity in the troposphere and the lower stratosphere. In this pa-per observational evidence for the generation and propaga-tion of short period gravity waves from a tropical easterly jet stream, convection, and wind shear over the Indian sub-continent is presented. The signatures of the gravity waves in the wind fields have been studied in the troposphere and lower stratosphere. The large wind fluctuations are more prominent above 10 km during the summer and monsoon seasons. The dominant wave periods and their height profiles of amplitudes are studied. The vertical wavelength and the propagation direction of gravity waves are determined using hodograph analysis, are also presented. A method of com-puting the vertical flux of zonal and meridional momentum fluxes associated with gravity waves from the radial veloci-ties in two orthogonal beams measured by the Indian MST Radar at Gadanki (13.5◦N, 79.2◦E) is presented. Alexan-der and Pfister (1995) studied the vertical flux of horizontal momentum carried by short horizontal scale gravity waves (λx=10–100 km) using aircraft measured winds in the lower stratosphere. Chang et al. (1997) used ST radar data from Christmas Island to study tropospheric gravity waves, and they found a broad range of frequency associated with grav-ity wave activgrav-ity in the troposphere. The derived flux values agree well with the values obtained from MU radar and by Rao et al. (1997), Dhaka et al. (2001).
This paper is organized as follows. The system description and database are discussed in Sect. 2. In Sect. 3 methodol-ogy used for the present study and the calculation of gravity wave momentum fluxes are presented. In Sect. 4 results and discussions about the background wind field, time evolution of the three components of the wind field, frequency spectra and hodographs are given. Momentum fluxes are given in Sect. 5 and the conclusions are presented in Sect. 6.
2 System description and database 2.1 Indian MST Radar
The Indian MST Radar is a coherent pulsed Doppler VHF radar operating at 53 MHz with an average power aperture product of 7×10⁸Wm2and is located at Gadanki (13.5◦N, 79.2◦E), India. The peak-transmitted power is 2.5 MW and the transmitters can be operated up to a maximum duty ra-tio of 2.5%. The antenna system occupying an area of 130 m×130 m is a phased array of 32×32 three element Yagi antennas consisting of two orthogonal sets, one for each po-larization (magnetic E–W and N–S). It generates a radia-tion pattern with the main lobe at a 3◦-width (between 3 dB points), a gain of 36 dB and a first side lobe level of –20 dB. The main beam can be positioned at any look angle within ±20◦off zenith in the two major planes (E–W and N–S). The number of FFT points are up to 512 and coherent integra-tions are from 4 to 512 (selectable in binary steps). The un-coded pulse widths can be from 1µs–32µs (in binary steps) and the coded ones, 16µs and 32µs with 1µs baud length. The complete time series of the decoded and integrated sig-nal samples are subjected to FFT for the online computation of the Doppler power spectra for each range bin. The of-fline data processing for the parameterization of the Doppler spectra involves removal of dc, an estimation of the average noise level, incoherent integration (if any) and the compu-tation of the three low order moments, and the wind fields are derived from the radial velocities. For estimating the av-erage noise level, an objective method developed by Hilbrand and Sekhon (1974) has been adopted here. More de-tails of this system and signal processing see Kishore (1995) and Rao et al. (1995).
2.2 Database
In the present study VHF radar at Gadanki (13.5◦N, 79.2◦E), a tropical station, is used to study the gravity wave activ-ity on four typical days in different seasons, namely the pre-monsoon (March–May), monsoon (June–September), post-monsoon (October–November) and winter (December– February) seasons. The radar observations were taken during 9–12 April 2001 (pre-monsoon), 19–22 July 1999, 16–19 July 2001 (monsoon), 16–19 October 2000, 26– 29 November 2001 (post-monsoon) and 22–25 January 2002 (winter). Data were collected for three days in each sea-son at 10:00–16:00 LT, 20:00–20:30 LT, 00:30–01:00 LT, and 05:00–05:30 LT on each day. The radar antenna beam
pointed towards 6 beam directions viz., east, west, north, south, inclined at an angle of 10◦from the zenith and along two vertical beams, one in east–west polarization and the other in north–south polarization. For all six beam direc-tions, mean radial velocities observed in a 3.6-min interval provided the original data. In the present study, we have six beams using a 16-µs coded pulse (with a 1-µs sub-pulse width, corresponding to a range resolution of 150 m) and a 2-µs uncoded pulse width (corresponding to a range resolu-tion of 300 m) with an IPP of 1000 and 250 µs, respectively. The effective sampling interval for each beam was 36 s. The received echo signals were sampled at a height resolution of 150 m during 16–19 July 2001, 26–29 November 2001 and 22–25 January 2002 and a 300-m height resolution during 16–19 October 2000 and 9–12 April 2001.
3 Methodology
3.1 Method of analysis using Indian MST Radar
The VHF radar is a powerful tool to examine small-scale gravity waves with a high accuracy, since wind measure-ments have been made with fine height and time resolutions. In the present study, time series data of winds were taken and these were subjected to a 3-point running average in height, to reduce the small-scale wind fluctuations. There exist a few data gaps in the time series, which are filled by linearly in-terpolated values obtained from a cubic spline interpolation technique. These time series data values are averaged for the entire time period and are subtracted from the individ-ual values of time series data to obtain the wind fluctuations. The obtained wind fluctuations are subjected to Fast Fourier Transform to obtain the frequency spectra. From this power spectral densities of zonal, meridional, and vertical velocities are calculated and this is presented in this paper. The hodo-graph analysis is used for the wind fluctuations, to obtain the vertical wavelength and propagation direction of gravity waves.
3.2 Methodology for momentum flux
The variance of zonal and meridional velocities clearly shows the intensity of gravity waves and was also found to in-crease up to about 10 km, reaching high values above 10 km. Vertical flux of zonal and meridional momentum flux was calculated using the radial velocity variances of the east-west and north-south beam pairs (i.e. in the four-beam method), respectively, suggested by Vincent and Reid (1983). The mo-mentum fluxes are proportional to the difference between the variances of the radial velocities in two opposite beam direc-tions. Therefore, the zonal and meridional momentum fluxes per unit mass were estimated as
U0W0=V 12 E −V 12 W 2 sin 2θ (1)
3240 I. V. Subba Reddy et al.: Studies on atmospheric gravity wave activity at Gadanki 27 Fig. 1. 4 6 8 10 12 14 16 18 20 -20-15-10 -5 0 5 10 Vertical Velocity (m/s) Meridional Velocity (m/s) He ig ht ( k m) Zonal Velocity (m/s) 4 6 8 10 12 14 16 18 20 -10 -5 0 5 10 15 20 (a) 10 April 2001 4 6 8 10 12 14 16 18 20 -0.5 0.0 0.5 4 6 8 10 12 14 16 18 20 -20-15-10 -5 0 5 10 Zonal velocity (m/s) He ight ( k m ) 4 6 8 10 12 14 16 18 20 -10 -5 0 5 10 15 20 Meridional velocity (m/s) 4 6 8 10 12 14 16 18 20 -0.5 0.0 0.5 (c) Vertical velocity (m/s) 26 November 2001 4 6 8 10 12 14 16 18 20 -20-15-10 -5 0 5 10
Meridional velocity (m/s) Vertical Velocity (m/s) Zonal Velocity (m/s) H e igh t (k m ) 4 6 8 10 12 14 16 18 20 -10 -5 0 5 10 15 204 6 8 10 12 14 16 18 20 -0.5 0.0 0.5 (d) 22 January 2002 4 6 8 10 12 14 16 18 20 -40 -30 -20 -10 0 10 20 Zonal Velocity (m/s) 4 6 8 10 12 14 16 18 20 -10 -5 0 5 10 15 20 17 July 2001 Meridional Velocity (m/s) 4 6 8 10 12 14 16 18 20 -0.5 0.0 0.5 (b) Vertical Velocity (m/s) He ig h t ( k m)
Fig. 1. Mean vertical profiles of zonal, meridional and vertical velocities along with error bars indicating standard deviations of the time
period of total 6 h (LT) observed during (a) 10 April 2001, (b) 17 July 2001, (c) 26 November 2001 and (d) 22 January 2002. An average is made for the entire time period of observations for 6 h on each day.
V0W0= V 12 N −V1 2 S 2 sin 2θ , (2)
where V1E2, V1W2, V1N2and V1S2 are the variances of the radial velocities in the east, west, north and south beam directions, respectively, and the over bar denotes the time average for 6 h (i.e. 10:00–16:00 LT).
4 Results and discussions 4.1 Mean velocity observations
For the present study the Indian MST Radar winds were taken and averaged to know the background wind informa-tion on a typical day in different seasons. Figure 1 shows mean vertical profiles of zonal, meridional and vertical veloc-ity observations with error bars indicating the standard devi-ation of the time period of the total 6 h during 10 April 2001
(pre-monsoon), 17 July 2001 (monsoon), 26 November 2001 (post-monsoon) and 22 January 2002 (winter), representing a typical day in different seasons. On 10 April 2001 zonal velocities were easterlies (westward) from 4–6 km, wester-lies (eastward) from 6–14 km and easterwester-lies above 14 km. The meridional velocities were almost southerlies (north-ward) from 4.5–17.5 km. It was observed that the standard deviations were more between 9–10 km and above 13 km for zonal velocities. On 17 July 2001, due to jet streams, the zonal velocities were maximum reaching –38 m/s around 17 km, and above 9 km the velocities were easterlies and be-low this height the zonal velocities were westerlies. The jet stream activity was more prominent during July in the In-dian subcontinent (Rao et al., 2000). During 26 November 2001 the zonal velocities were almost easterlies in the entire height range with less magnitude compared to the other days, and meridional velocities were northerlies below 8 km and were southerlies above 8 km. The maximum of the velocity
28
Fig. 2a.
28
Fig. 2a.
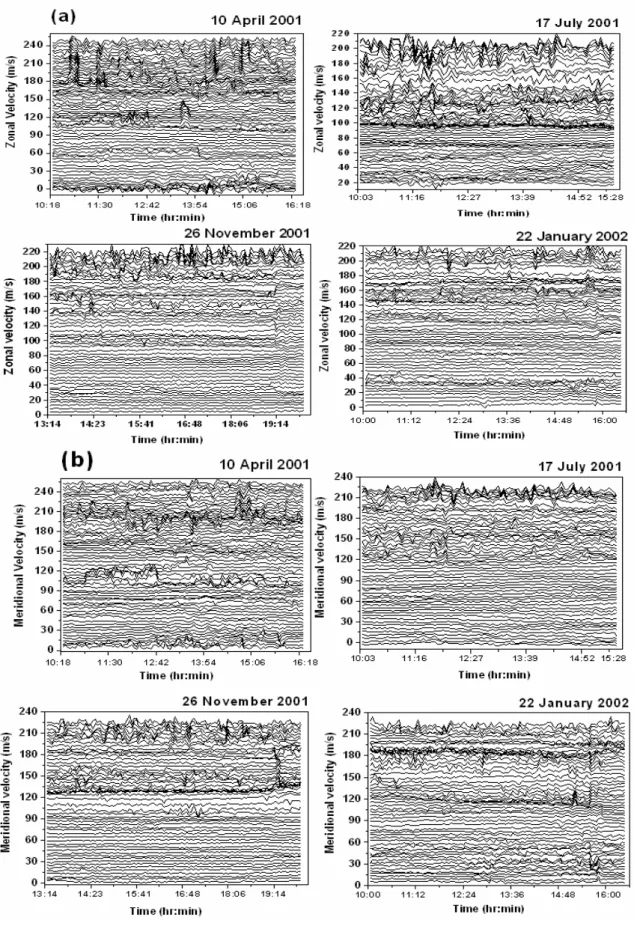
Fig. 2. Time series of (a) zonal and (b) meridional velocities during 10 April 2001, 17 July 2001, 26 November 2001 and 22 January 2002
for a 6-h period of observations on a typical day in different seasons. For clarity each profile (300-m height resolution) has been shifted by 4 m/s for zonal and meridional velocities.
3242 I. V. Subba Reddy et al.: Studies on atmospheric gravity wave activity at Gadanki
29
Fig. 2b.
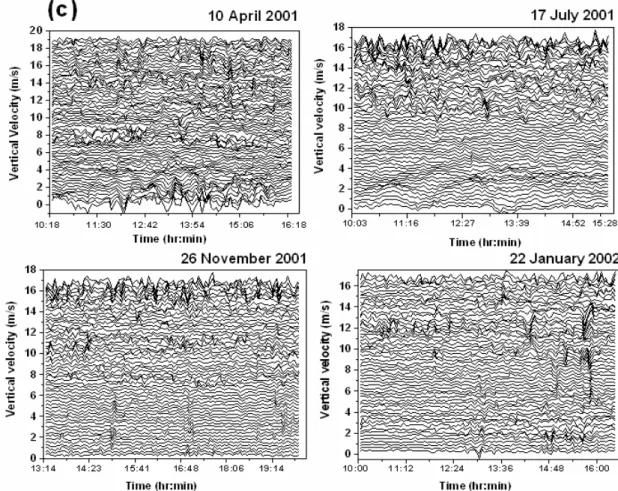
Fig. 2. Continued. Same as Fig. 2a, but for the vertical velocities during the same days. For clarity each profile has been shifted by 0.4 m/s.
gradient has been observed between 11–13 km in meridional velocity. Standard deviations were more above 13 km for both zonal and meridional velocities. The vertical velocities were small with large standard deviations in the entire height range. During 22 January 2002 the zonal velocities were westerlies below 10 km and were easterlies above 11km. The meridional velocities were northerlies below ∼10 km, 12.6– 14.6 km, 17.2–20 and were southerlies from 14.6–17.2 km, and there was a large velocity gradient at 14.6–17.2 km. In all the seasons vertical velocities were small with upward and downward oscillations. The standard deviations were more above 10 km during 10 April 2001, 26 November 2001 and 22 January 2002 in almost all the components, indicating variability of winds.
4.2 Temporal evolution of the winds
Figure 2a represents the time series plot of zonal (upper panel a) and meridional (lower panel b) velocities on a typi-cal day in different seasons, for the same days as mentioned in Fig. 1, for a 6-h period of observation. Each profile cor-responds to a height resolution of 300 m and for clarity each profile has been shifted by 4 m/s for zonal and meridional velocities. The magnitude of the zonal velocities seems to be increasing with height above 10 km during 10 April 2001
and 17 July 2001 and above 14 km during 26 November 2001 and 22 January 2002. The magnitudes of the meridional ve-locities increased above 10 km for all the days. Above 10 km the velocity disturbances were more prominent and while go-ing upward the magnitude of the disturbances increased, and this implies that wave motions were vertically propagating (Hoppe and Fritts, 1995) and it is evident from Fig. 2a that a wave-like structure exists in the time series with a clear phase variation, especially on 17 July 2001, above 12 km, between 11:52–14:15 LT, with different characteristic peri-ods. The wave activity was also seen above 10 km during 26 November 2001 and 22 January 2002 but wind variations were small. During the pre-monsoon (10 April 2001) and monsoon seasons (17 July 2001), the wave activity was more dominant. In Fig. 2b, the time series data of vertical veloci-ties are also presented for the same days as Fig. 2a, and each profile has been shifted by 0.4 m/s for all the days. Verti-cal velocity variations were clearly observed on all the days even though the magnitudes of vertical velocities were small. From this it was observed that the time series of vertical ve-locities on all the days clearly shows the increasing tendency of wave activity with increasing height, which is more promi-nent at tropospheric and lower stratospheric heights and the same was continued throughout the observation time.
30
Fig. 3.
-8 -6 -4 -2 0 2 4 6 8 4 6 8 10 12 14 16 18 20 Average 10 April 2001 Height (km)Zonal velocity fluctuations (m/s)
-8 -6 -4 -2 0 2 4 6 8 4 6 8 10 12 14 16 18 20 Average 17 July 2001 H e ig h t (k m )
Zonal velocity fluctuations (m/s)
-8 -6 -4 -2 0 2 4 6 8 4 6 8 10 12 14 16 18 20 Average 26 Novem ber 2001 H e ight ( k m )
Zonal velocity fluctuations(m /s)
-8 -6 -4 -2 0 2 4 6 8 4 6 8 10 12 14 16 18 20 Average 22 January 2002 He ight ( k m )
Zonal velocity fluctuations (m/s)
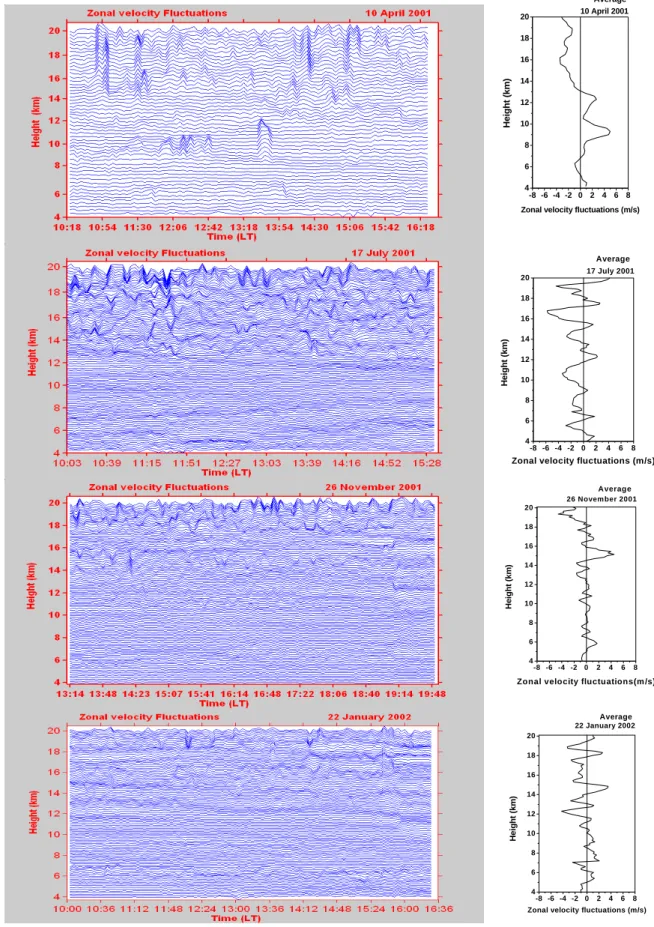
Fig. 3. Height-time variation of zonal velocity fluctuations obtained by removing the background wind velocity at each height for a typical
day, observed 6 h with Indian MST Radar during 10 April 2001, 17 July 2001, 26 November 2001 and 22 January 2002. Successive profiles are displaced by 4 m/s, 2 m/s, 3m/s and 3 m/s, respectively.
3244 I. V. Subba Reddy et al.: Studies on atmospheric gravity wave activity at Gadanki
31
Fig. 4.
-8 -6 -4 -2 0 2 4 6 8 4 6 8 10 12 14 16 18 20 Average 10 April 2001 He ight (k m)Meridional velocity fluctuations (m /s)
-8 -6 -4 -2 0 2 4 6 8 4 6 8 10 12 14 16 18 20 Average 17 Julyl 2001 H e ig ht ( k m )
Meridional velocity fluctuations(m/s)
-8 -6 -4 -2 0 2 4 6 8 4 6 8 10 12 14 16 18 20 A verage 26 N ovem ber 2001 H e ight (km )
M eridional velocity fluctuations (m /s)
-8 -6 -4 -2 0 2 4 6 8 4 6 8 10 12 14 16 18 20 Average 22 January 2002 H e ight (km )
Meridional velocity fluctuations (m/s)
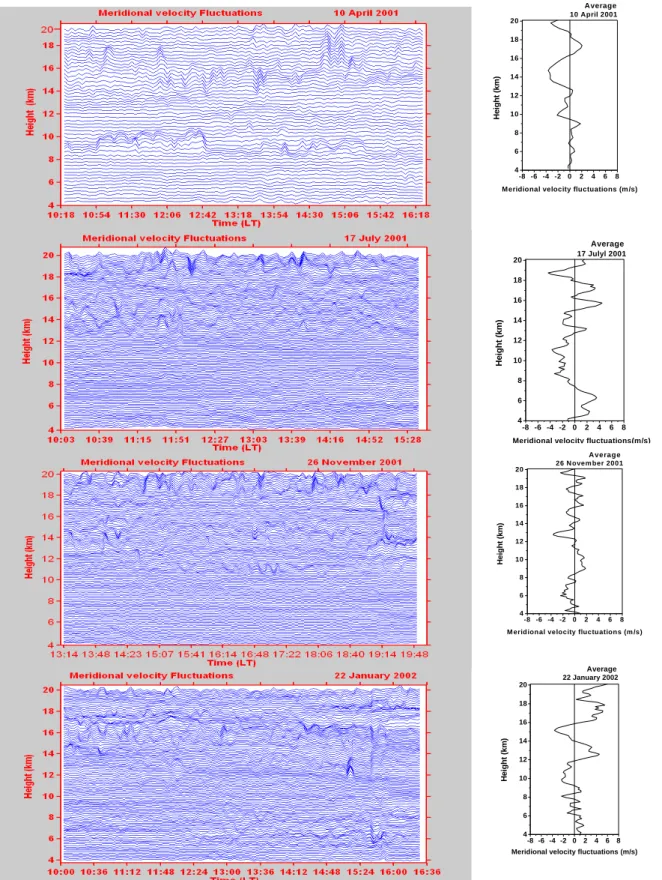
Fig. 4. Same as Fig. 3, but for the meridional velocity fluctuations obtained by removing the background wind velocity at each height for a
typical day, observed 6 h with Indian MST Radar during 10 April 2001, 17 July 2001, 26 November 2001 and 22 January 2002. Successive profiles are displaced by 4 m/s, 2 m/s, 3 m/s and 3 m/s, respectively.
32
Fig. 5.
-0.50 -0.254 0.00 0.25 0.50 6 8 10 12 14 16 18 20 Average 26 November 2001 He ig ht (k m )Vertical velocity fluctuations (m/s) -0.50 -0.25 0.004 0.25 0.50 6 8 10 12 14 16 18 20 Average 17 Julyl 2001 Hei ght ( k m )
Vertical velocity fluctuations (m/s) -0.50 -0.25 0.00 0.25 0.50 4 6 8 10 12 14 16 18 20 Average 10 April 2001 H e ig h t (k m )
Vertical velocity fluctuations (m/s)
-0.50 -0.254 0.00 0.25 0.50 6 8 10 12 14 16 18 20 Average 22 January 2002 Heig ht ( k m )
Vertical velocity fluctuations (m/s)
Fig. 5. Same as Fig. 3, but for the vertical velocity fluctuations obtained by removing the background wind velocity at each height for a
typical day, observed 6 h with Indian MST Radar during 10 April 2001, 17 July 2001, 26 November 2001, 22 January 2002. Successive profiles are displaced by 0.2m/s, 0.2 m/s, 0.2 m/s and 0.2 m/s, respectively.
3246 I. V. Subba Reddy et al.: Studies on atmospheric gravity wave activity at Gadanki The height-time variation of the zonal, meridional and
ver-tical velocity fluctuations, at each height is given in Figs. 3, 4 and 5, respectively. For clarity each profile (300-m height resolution during 10 April 2001 and 150-m height resolu-tion during 17 July 2001, 26 November 2001, 22 January 2002) has been shifted by 4 m/s, 2 m/s, 3 m/s and 3 m/s dur-ing 10 April 2001, 17 July 2001, 26 November 2001 and 22 January 2002, respectively. On the x-axis each scan cy-cle can be repeated at a time interval of 3.6 min. The wave structure is clearly evident from this figure and in addition to the dominant component, different wave activities can be recognized in the wind velocity fluctuation, although the am-plitude of the perturbation is generally smaller in the lower troposphere. According to wave periods and vertical scales, these fluctuations can be decomposed into different waves. In Fig. 3, during 17 July 2001, the zonal velocity fluctuations are more compared to other profiles and the wave activity is more dominant in the upper troposphere. Figure 4 is simi-lar to Fig. 3, but for meridional velocity fluctuations. In this figure the velocity fluctuations are more in the upper tropo-sphere, indicating that the waves are originating in the lower atmosphere and they can propagate into the higher heights from their source region. Even though the vertical veloci-ties are small, the vertical velocity fluctuations are more and Fig. 5 clearly shows the wave activity with different propa-gating character. It may be noted that these fluctuations are due to waves with periods less than the observation period. The fact that the perturbation amplitudes are more in the tro-posphere and lower stratosphere but considerably lower in the lower troposphere (below 10 km) represents that the wave activity is more in the troposphere and lower stratosphere.
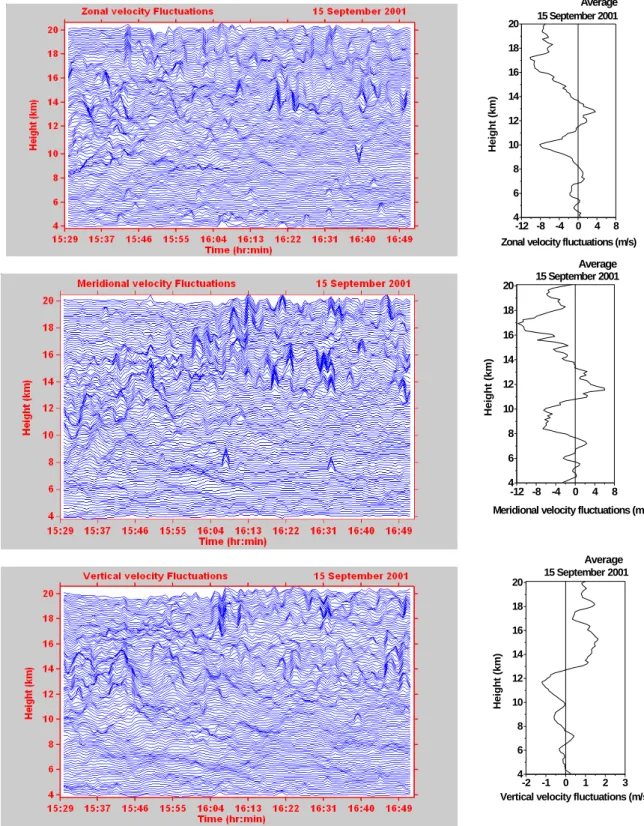
Convection is one of the source mechanisms for generat-ing gravity waves. In order to show the convective gener-ated gravity waves, one typical day of convection has been taken during 15 September 2001, occurred between 15:29– 16:52 LT and is shown in Fig. 6. During the convection event, due to the large thermal plumes, the air parcels move with large vertical velocities. Figure 6 shows the zonal, meridional and vertical velocity fluctuations during convec-tion event. The velocity fluctuaconvec-tions are consistent with time for zonal, meridional and vertical velocities with large ve-locity fluctuations, with increasing height. The right-hand side of the figure shows the average velocity fluctuations for the corresponding velocities and it is evident from this fig-ure that during the convection event velocity fluctuations are large compared to other days, as shown in Figs. 3, 4 and 5. These figures show that velocity fluctuations increase with increasing height and are maximizing at the upper tropo-sphere and lower stratotropo-sphere. Using the vertical beam (Zy), signal strength (SNR), spectral width (without correction) and vertical velocities are calculated and shown in Fig. 7. The enhancement in signal strength extending up to 17 km, increasing spectral width and large vertical velocities with increasing height are an indication of convection. In gen-eral, on non convection days vertical velocities are very small (<1 m/s) but during convection days vertical velocities were large (see third panel of Fig. 7), up to 8 m/s in the present
case, and it is also evident from the figure that convection is more prominent during 15:29–16:13 LT.
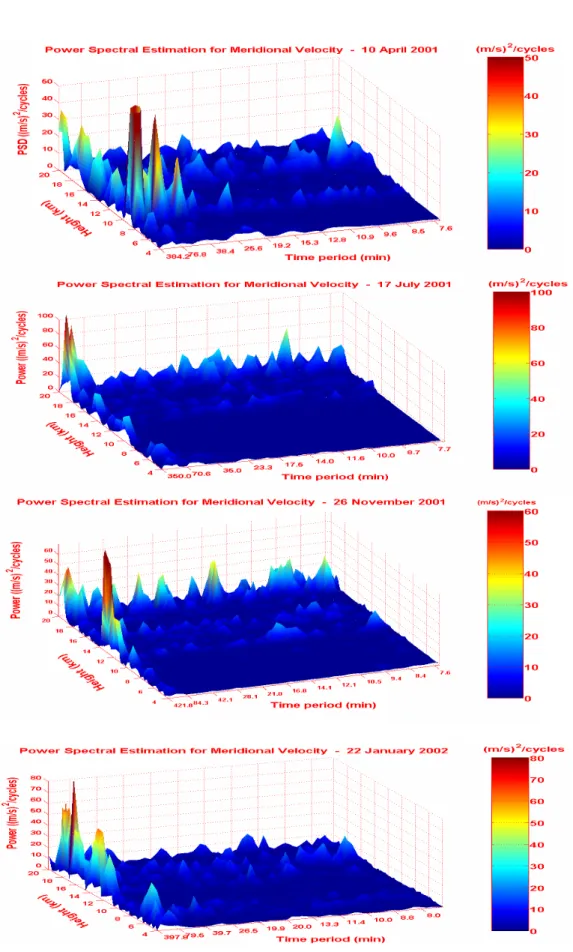
The time series data of wind fluctuations are taken to study the dominant frequency components and are subjected to power spectral density (PSD) analysis. Before applying the PSD the time series data of wind fluctuation were detrended and then a high pass filter has been used for the data to eliminate low frequency components. Figure 8 shows power spectral estimation for zonal velocities during 10 April 2001, 17 July 2001, 26 November 2001 and 22 January 2002 for 6 h observation. These observations show waves dominate with different frequency components and the corresponding time periods are 2 h 8 min, 54 min, 38 min, 13 min and 10 min dur-ing 10 April 2001, 2 h 55 min, 1 h 56 min, 1 h 20 min, 25 min, 17 min during 17 July 2001, 2 h 20 min, 60 min, 26 min, 17 min during 26 November 2001 and 2 h 12 min, 1 h 39 min, 30 min, 21 min during 22 January 2002. The maximum PSD is found during 17 July 2001 for the periodicities of 2 h 55 min and 1 h 56 min. During 10 April 2001 and 17 July 2001 high periodicities of waves have more PSDs than low periodicities of waves, but during 26 November 2001 and 22 January 2002 low periodicities of waves (below 1 h) have more PSDs than high periodicities of waves (>1 h). Accord-ing to Tsuda et al. (1994b), the periods rangAccord-ing from 5 min to 2 h are mainly due to the large wind shears, which are mainly observed during jet streams. The observed periods near the jet streams in the present study (around 16–17 km) lie within the periods, as reported by Tsuda et al. (1994). Previous stud-ies revealed that gravity waves of such wave periods exist over this radar site (Nagpal et al., 1994; Keshav Kumar et al., 1994; Dutta et al., 1999; Jagannadha Rao et al., 2002).
The height variations of PSDs for meridional and vertical velocities are given in Figs. 9 and 10, respectively. The power spectral density peaks repeat at different heights, represent-ing different periodicities of waves propagatrepresent-ing in the atmo-sphere, and the fact that the PSDs of these waves are max-imum at upper heights represents that the sources of these waves exist in the lower atmosphere and they can propagate upward with carrying energy and momentum. In Fig. 8, dur-ing 17 July 2001 (monsoon) and 26 November 2001 (post-monsoon), the zonal velocity PSDs are more than meridional velocity because the zonal velocity perturbations are more than meridional velocity. But PSDs of vertical velocities are small compared to zonal and meridional velocities. In comparison to other days during 10 April 2001 and 22 Jan-uary 2002 at all the heights various frequency components are observed with different PSDs in vertical velocity. The dominant time periods, heights and the corresponding PSDs are given in Table 1 for zonal, meridional and vertical ve-locities. From Table 1 it is clear that for zonal, meridional and vertical velocities the similar time periods do not repeat for three components of velocities which means after gen-erating, the gravity waves are not propagating equally in all the directions with the same characteristic period. Figure 11 represents the frequency-power spectral estimation for verti-cal velocity fluctuations during 15 September 2001 during the convection event. It is observed that three frequency
33 Fig. 6. -12 -8 -4 0 4 8 4 6 8 10 12 14 16 18 20 Average 15 September 2001 Hei g ht (km)
Zonal velocity fluctuations (m/s)
-12 -8 -4 0 4 8 4 6 8 10 12 14 16 18 20 15 September 2001 Average Heigh t (km )
Meridional velocity fluctuations (m/s)
-2 -1 0 1 2 3 4 6 8 10 12 14 16 18 20 Average 15 September 2001 Hei ght ( k m)
Vertical velocity fluctuations (m/s)
Fig. 6. Height-time variation of zonal, meridional and vertical velocity fluctuations obtained by removing the background wind velocity at
each height during the convection event on 15 September 2001 observed with Indian MST Radar. Successive profiles are displaced by 5 m/s, 8 m/s and 0.75 m/s, respectively.
3248 I. V. Subba Reddy et al.: Studies on atmospheric gravity wave activity at Gadanki
34
Fig. 7.
Fig. 7. Image plot of signal-to-noise ratio (SNR), spectral width and vertical velocity on 15 September 2001 during the convection event.
SNR represents signal strength, spectral width is an indication of turbulence and vertical velocity indicates the updraft and downdraft of the air-mass.
35
Fig. 8.
Fig. 8. Frequency-power spectral estimation for zonal velocity fluctuations as a function of height for a typical day, observed 6 h with Indian
3250 I. V. Subba Reddy et al.: Studies on atmospheric gravity wave activity at Gadanki
36
Fig. 9.
37
Fig. 10.
3252 I. V. Subba Reddy et al.: Studies on atmospheric gravity wave activity at Gadanki
Table 1. Power Spectral Densities for zonal, meridional and vertical velocity fluctuations for different days.
26
Table 1.
Zonal Velocity Date Harmo-nic No. Time period (min) Altitude (km) Power Spectral Density (m/s)2/cycles 10 April 2001 3 7 10 28 35 128 54 38 13 10 15 16-18 18-20 14 18 18-20 50-60 30-40 ,, 20-30 20-30 20-30 17 July 2001 2 3 4 14 20 175 116 88 25 17 5 12-15 5-6 16-18 19-20 18-20 18-20 80-90 ,, 80-90 60-70 70-80 60-70 70-80 26 November 2001 3 7 16 25 140 60 26 17 18-20 18-20 18-20 18-20 20-30 20-30 30-40 30-40 22 January 2002 3 4 13 19 132 99 30 21 12-16 17 19 19 15-20 15-20 20-25 20-25 Meridional velocity DateHarmo-nic No. period Time (min)
Altitude
(km) Power Spectral Density (m/s)2/ cycles 10 April 2001 3 6 10 14 38 128 64 38 27 10 9-10 14-16 16-18 19-20 9-10 9-10 16-16.6 16 45-50 30-35 35-40 35-40 40-50 35-40 25-30 20-25 17 July 2001 3 13 20 25 31 117 27 18 14 11 18-20 18-20 ,, ,, ,, 80-90 20-40 ‘’ ‘’ ‘’ 26 November 2001 3 5 10 16 20 140 84 42 26 21 13 14-16 19-20 ,, ,, ,, ,, 50-60 40-50 30-40 30-40 ,, ,, 22 January 2002 3 4 5 19 29 132 99 80 21 14 16-18 19 16 15.5-16 16 70-80 60-70 40-50 40-50 20-30 25 26 Table 1. Zonal Velocity Date
Harmo-nic No. period Time
(min)
Altitude
(km) Power Spectral Density
(m/s)2/cycles 10 April 2001 3 7 10 28 35 128 54 38 13 10 15 16-18 18-20 14 18 18-20 50-60 30-40 ,, 20-30 20-30 20-30 17 July 2001 2 3 4 14 20 175 116 88 25 17 5 12-15 5-6 16-18 19-20 18-20 18-20 80-90 ,, 80-90 60-70 70-80 60-70 70-80 26 November 2001 3 7 16 25 140 60 26 17 18-20 18-20 18-20 18-20 20-30 20-30 30-40 30-40 22 January 2002 3 4 13 19 132 99 30 21 12-16 17 19 19 15-20 15-20 20-25 20-25 Meridional velocity Date
Harmo-nic No. period Time
(min)
Altitude
(km) Power Spectral Density
(m/s)2/ cycles 10 April 2001 3 6 10 14 38 128 64 38 27 10 9-10 14-16 16-18 19-20 9-10 9-10 16-16.6 16 45-50 30-35 35-40 35-40 40-50 35-40 25-30 20-25 17 July 2001 3 13 20 25 31 117 27 18 14 11 18-20 18-20 ,, ,, ,, 80-90 20-40 ‘’ ‘’ ‘’ 26 November 2001 3 5 10 16 20 140 84 42 26 21 13 14-16 19-20 ,, ,, ,, ,, 50-60 40-50 30-40 30-40 ,, ,, 22 January 2002 3 4 5 19 29 132 99 80 21 14 16-18 19 16 15.5-16 16 70-80 60-70 40-50 40-50 20-30 25 27 Vertical Velocity Date Harmoni
c No. Time period (min) Height(km) Density (m/s)Power Spectral 2/cycles
10 April 2001 4 6 8 27 34 96 64 48 14 11 5 18 10 19 11 16 19 0.35-0.4 0.35-0.4 0.25-0.3 0.25-0.3 0.25-0.3 ,, ,, 17 July 2001 6 11 13 15 22 26 58 31 27 23 16 13 6 19 16 16 15 19 19 0.6-0.7 0.4-0.5 0.4-0.5 0.4-0.5 0.3-0.4 0.3-0.4 0.4-0.45 26 November 2001 10 13 28 34 42 32 15 12.4 19 19 19-20 19-20 0.2-0.3 0.3-0.4 0.2-0.3 0.3-0.4 22 January 2002 5 16 26 33 79 24 15 12 16 19 16 11 0.05-0.1 0.1-0.15 0.15-0.2 0.05-0.1 26
I. V. Subba Reddy et al.: Studies on atmospheric gravity wave activity at Gadanki 3253
38
Fig. 11.
Fig. 11. Shows the frequency-power spectral estimation for vertical velocity on 15 September 2001 during the convection event observed for
1 h 23 min.
components dominate with time periods of 45 min, 31 min, and 16 min and the maximum PSDs are 12–16 (m/s)2/cycles at 16–20 km. PSDs for these frequency components are in-creasing from 10–20 km, indicating that the waves are verti-cally propagating upward and are maximum at upper heights (18–20 km). But one interesting feature is that during the convection event the magnitude of the PSDs is much more than during the events of jet streams and wind shear events, and it can be clearly seen from Figs. 10 and 11.
The vertical wavelength and propagation direction of grav-ity waves have been calculated using hodograph analysis for the zonal and meridional velocity fluctuations. Figure 12 represents the vertical wavelength and propagation direction of gravity waves obtained by using hodograph analysis dur-ing 10 April 2001, 17 July 2001, 26 November 2001 and 22 January 2002. For hodograph analysis zonal velocity fluc-tuations (u0 in m/s) are taken on the x-axis and meridional velocity fluctuations (v0 in m/s) are taken on the y-axis for the time period of 1 h between 11:00–12:00 LT. Figure 12a shows a hodograph for 10 April 2001, from 6.9–10.5 km dur-ing 11:00–12:00 LT. It is observed that durdur-ing 10 April 2001 beginning at a height of 6.9 km for a 300-m height resolu-tion, for the interval 11:00–12:00 LT, an anticlockwise rota-tion with increasing height corresponds to a downward prop-agating wave with 3.6-km vertical wavelength. It is close to the value obtained by Wang and Geller (2003) using ra-diosonde analysis. If the rotation of the wind vector is in the clockwise direction, it represents the upward energy trans-portation with downward phase velocity (e.g. Gossard and Hooke, 1975). If it is in the anticlockwise direction, it in-dicates downward energy transportation with upward phase
velocity. So this plot clearly shows the downward propagat-ing waves in the lower atmosphere towards the north-east di-rection. In Fig. 12b, during 17 July 2001 in the height range of 12.75–15.0 km with 150-m height resolution for the inter-val of 11:00–12:00 LT it is found that the rotation is anti-clockwise direction with a downward propagating wave to-wards the south-west direction with a vertical wave length of 2.25 km. Figures 12c–e are similar to Fig. 12b with a 150-m height resolution, during 26 November 2001. It is observed that between 7.5–9.0 km (in Fig. 12c) the rotation was in the clockwise direction with an upward propagating wave, with a vertical wavelength of 1.5 km, between 13.2– 16.5 km (in Fig. 12d) the rotation was in the anticlockwise direction, indicating a downward propagating wave, with a vertical wave length of 3.3 km and between 4.8–6.3 km (in Fig. 12e) the rotation was in the anticlockwise direction with a downward propagating wave, with a vertical wave length of 1.5 km. During 22 January 2002 in Figs. 12f, g, between 9.3–10.2 km, the rotation was in the clockwise direction, in-dicating an upward propagating wave, with a vertical wave length of 0.9 km in the south-east direction and between 13.8–17.1 km (in Fig. 12g), the rotation was in the clock-wise direction, indicating an upward propagating wave with a vertical wavelength of 3.3 km.
5 Momentum fluxes
Figure 13 shows the height variation of mean zonal, merid-ional momentum flux, zonal, meridmerid-ional and vertical vari-ances for the 17 July 2001 (upper panel) and 22 January
3254 I. V. Subba Reddy et al.: Studies on atmospheric gravity wave activity at Gadanki 39 Fig. 12.
(a)
(e)
(f)
(b)
(c)
(d)
(g)
Fig. 12. Hodograph of perturbation velocities, based on mean values over 1 h and 300-m increasing height intervals during 10 April 2001
and 150-m increasing height intervals during 17 July 2001, 26 November 2001 and 22 January 2002. The starting and ending heights are marked and the direction of rotation with increasing heights is indicated by arrows. The fitted ellipse to the observed points is shown as a red line.
2002 (lower panel). Zonal momentum flux for 17 July 2001 (upper panel) is westward almost in the entire height range, and westward flux (–0.55 m2/s2) is dominating at 10.5 and 15.3 km. Meridional momentum flux is southward
in the height range of 4.8–7 km and 8.5–14.5 km. Above 14.5 km the meridional flux is northward in direction and its value was maximum (∼0.58 m2/s2) around 16–17 km. Zonal and meridional variances were varying with height
40 Fig. 13. Indian MST Radar Date : 17 July 2001 Height (km )
Date : 22 January 2002
Height (km )Zonal flux Meridional flux Zonal/Meridional variances Vertical variances
2 '
'W(m/s)
U V'W'(m/s)2 (m/s)2 (m/s)2
Fig. 13. Momentum flux and variance of wind fluctuations estimated from the MST radar data during 10:00–16:00 LT on 17 July 2001
(upper panel) and 22 January 2002 (lower panel). Six hours of observations are averaged. Dotted line represents the meridional variance and the solid line represents the zonal variance.
and their magnitude was increasing above 12 km with in-creasing height. The zonal variance dominates the merid-ional variance above 16 km. The vertical variance is also varying with height and is maximum at 14.5 and 18.7 km. During 22 January 2002 the lower panel of Fig. 13 shows that the zonal momentum flux was eastward except between 7.2–11.4 km, and is maximum (0.78 m2/s2)at around 6.3 km, and the westward flux is maximum (−0.6 m2/s2) around
10.5 km. The meridional momentum flux was southward from 11–13 km and above 17.3 km and is northward below 11 km and 13–17.3 km. Southward momentum flux is dom-inating (−0.58 m2/s2)at 18–18.5 km. The zonal and merid-ional variances vary with height and are maximum above 12 km. The meridional variance dominates rather than the zonal variance from 5–18.5 km. Above 18.5 km the zonal variance was dominating the zonal variance. The maximum
3256 I. V. Subba Reddy et al.: Studies on atmospheric gravity wave activity at Gadanki 41 Fig. 14.
Indian MST Radar Date : 16-19 July 2001 U'W' ' 'W V Indian MST Radar Date : 22-25 January 2002 Hei g ht (km ) Height (km ) Height (km )
2-16 hours 2-8 hours 30 min-2 hours
2-16 hours 2-8 hours 30 min-2 hours
Fig. 14. Vertical profiles of zonal and meridional momentum fluxes estimated from the four beam method for different frequency bands
(2–16 h, 2–8 h, 30 min–2 h) during 16–19 July 2001 (upper panel) and 22–25 January 2002 (lower panel). The solid line represents zonal momentum flux and the dotted line represents the meridional momentum flux.
meridional variance is seen around 17.3 km. Vertical vari-ances are maximum around 16 km.
The momentum fluxes are calculated for different fre-quency bands corresponding to periods of 30 min–2 h (short period) and 2–8 h, 2-16 h (long period). To calculate the fre-quency dependence momentum fluxes, three days of data have been taken and data gaps are filled by linear inter-polation. The band-pass filter is used for the time series data of variances for the frequency bands 30 min-2 h, 2–8 h
and 2–16 h for the calculation of momentum fluxes for both short periods (30 min–2 h) and long periods (2–8 h, 2–16 h). The vertical profiles of zonal and meridional flux in each frequency band are found to be consistent, in general, with the total flux. Figure 14 shows the height variation of zonal and meridional momentum fluxes for 30 min–2 h, 2–8 h and 2–16 h during 16–19 July 2001 (upper panel) and 22–25 Jan-uary 2002 (lower panel). The solid line represents zonal mo-mentum flux and the dotted line represents the meridional
42
Fig. 15.
Height (km
)
Indian MST Radar
Date : 16-19 October 2000
30 min-2 hours
2-8 hours
2-16 hours
Momentum Flux (m/s)
2Momentum Flux (m/s)
2Momentum Flux (m/s)
2Height (km
)
Indian MST Radar
Date : 09-12 April 2001
30 min-2 hours 2-8 hours 2-16 hours
Momentum Flux (m/s)
2Momentum Flux (m/s)
2Momentum Flux (m/s)
2U
'W
' ' 'W
V
42
Fig. 15.
Height (km
)
Indian MST Radar
Date : 16-19 October 2000
30 min-2 hours
2-8 hours
2-16 hours
Momentum Flux (m/s)
2Momentum Flux (m/s)
2Momentum Flux (m/s)
2Height (km
)
Indian MST Radar
Date : 09-12 April 2001
30 min-2 hours 2-8 hours 2-16 hours
Momentum Flux (m/s)
2Momentum Flux (m/s)
2Momentum Flux (m/s)
2U
W
' 'W
V
Fig. 15. Vertical profiles of zonal and meridional momentum fluxes estimated from the four beam method for different frequency bands
(30 min–2 h, 2–8 h, 2–16 h) during 16–19 October 2000 (upper panel) and 9–12 April 2001 (lower panel). The solid line represents the zonal momentum flux and the dotted line represents the meridional momentum flux.
momentum flux. Zonal fluxes are small at lower levels and increasingly negative (westward) at higher heights for both shorter and longer periods. The dominant contributions to
the meridional flux occur in the long periods (2–8, 2–16 h) towards northward. In particulary, in the height range of 13– 16.8 km, for both longer and shorter periods, the meridional
3258 I. V. Subba Reddy et al.: Studies on atmospheric gravity wave activity at Gadanki momentum fluxes are towards north and above 11 km zonal
momentum fluxes are towards the westward direction. The zonal momentum flux reaches maximum values in all the periods in the lower stratospheric levels and it is maximum around 12 km. From this figure it is clear that more momen-tum flux has been carried by long period waves. For all fre-quency bands at most of the height regions meridional mo-mentum fluxes are dominating and are in the northward di-rection. Zonal momentum fluxes are maximum for the long period rather than the short periods. In Fig. 14, the lower panel shows zonal and meridional momentum fluxes during 22–25 January 2002 for 30 min–2 h, 2–8 h and 2–16 h. Zonal and meridional fluxes are small below 13 km and reach max-imum values around the tropopause height (16 km). It was observed that during 22–25 January 2002, for short and long periods, zonal momentum fluxes are in the eastward direc-tion from 4–20 km and meridional momentum fluxes are in the southward direction with increasing altitude above 10 km and reaching maximum values at higher heights. Large mo-mentum flux is associated with long periods for both zonal and meridional momentum fluxes in either direction.
Figure 15 is the same as Fig. 14, but for 16–19 October 2000 (upper panel) and 9–12 April 2001 (lower panel). In Fig. 15, the upper panel shows (during 16–19 October 2000) short period zonal momentum flux is the eastward direction below 14.5 km and 16–19 km. The zonal momentum fluxes are increasing with height and reaching maximum values in all periods around the tropopause (16–18 km) height. Merid-ional momentum fluxes are towards the northward direction for both shorter and longer periods. It is observed that there is a clear change in direction for zonal momentum fluxes around 14–19 km for all frequency bands, from westward to eastward direction. Below 15 km, the zonal momentum flux carried by short periods is greater. Between 16–18 km, the momentum flux carried by long periods is greater because at these heights the velocity variances are greater. The domi-nant contributions to the meridional momentum flux occur in the longer periods towards the northward direction and reach maximum values above 19 km. The lower panel of Fig. 15, (during 9–12 April 2001) shows zonal momentum fluxes for all the periods towards the westward direction below 15 km and above 16.5 km, and reaching maximum values for longer periods at 12 km for 2–8 h and at 8 km and 14 km for 2–16 h. Short and long period zonal momentum fluxes change their direction from the westward to the eastward direction in the height range of 15–16.5 km. Meridional momentum fluxes are towards the southward direction for both short and long periods. There is a clear change in direction for the zonal momentum fluxes around 14–17 km for all frequency bands from the westward to the eastward direction.
The results for long periods (2–8 h, 2–16 h) show little zonal momentum flux in either direction below 10 km, but for short periods the magnitude of the zonal fluxes are greater than the longer periods. During 16–19 October 2000, it is observed that there is a clear and consistent eastward di-rection below 14 km for short periods (30 min–2 h) and be-low 12 km the zonal momentum fluxes are small for long
periods (2–8 h, 2–16 h). The short period momentum flux for the meridional component is highly variable but shows a general increase between troposphere and lower strato-sphere during 22–25 January 2002, similar to the results ob-tained by Prichard and Thomas (1993). During 16–19 Oc-tober 2000, the meridional momentum flux for both short and long periods is towards the northward direction but dur-ing 9–12 April 2001 it is in the southward direction. The zonal momentum flux for short periods is towards the east-ward direction, up to ∼14 km, during 16–19 October 2000 but during 9–12 April 2001 the zonal momentum flux is to-wards the westward direction for both short and long periods in the height range of 2–14.5 km and above 17 km. During 22–25 January 2002 both zonal and meridional momentum fluxes are highly variable with height for short and long pe-riod fluxes. The zonal component shows a westward flux at nearly all the heights, with magnitudes comparable to those of the long periods except between 15–17 km, where it in-creases rapidly and becomes dominant during 9–12 April 2001. It is found that for tropospheric heights the momentum fluxes deduced for shorter periods are smaller than longer periods, for both zonal and meridional components. It is found that in the troposphere and lower stratosphere during 9–12 April 2001 (summer) and 22–25 January 2002 (winter,) the zonal momentum flux is in the westward and eastward directions, respectively, but this is the reverse of the observa-tions at mesospheric heights. In the mesosphere, Nakamura et al. (1996) found that the momentum flux determined with the 4–5 days of observation of mesospheric wind velocities with the MU radar also showed a very clear eastward and westward preference in summer and winter, respectively. For meridional momentum flux during 9–12 April 2001 (sum-mer) from 4–20 km and 22–25 January 2002 (winter) above 11 km both observations show a southward direction, but during 16–19 October 2000 (post-monsoon) meridional mo-mentum flux is in the northward direction. For momo-mentum flux in the mesosphere observed by MU radar Nakamura et al. (1996) showed a clear northward flux in the summer and a weak or southward flux in the winter, especially for periods longer than 30 min–1 h.
6 Conclusions
The gravity wave activity in the troposphere and lower strato-sphere are studied based on wind velocity observations made with the Indian MST Radar for typical days in different sea-sons. The mean zonal velocity was maximum on 17 July 2002 (monsoon season) and was –38 m/s around 17 km. The excitation source of short period gravity waves is suggested to be located near the peak of the mean zonal velocity and it is evident from the time series data of velocity fluctua-tions, as shown in Fig. 3. During 26 November 2001 and 22 January 2002, the meridional velocity gradients are max-imum between 11–13 km and 15–17 km, respectively. The zonal, meridional and vertical velocity field exhibited mo-tions with periods ranging from a few minutes to a few
hours, with propagating character. It was shown in Figs. 2, 3, 4 and 5 that the time series data of the 3-point running average of zonal, meridional and vertical velocities are in-creasing with inin-creasing height in the troposphere and lower stratosphere, indicating that the gravity waves are generated at lower heights and they can propagate in to upper atmo-sphere. It is well known that gravity waves originating in the lower troposphere through wind shear (during 26 Novem-ber 2001, 22 January 2002 and 10 April 2001), jet streams (during 17 July 2001) and convection (15 September 2001) effects will propagate upwards with increasing amplitudes (Fritts, 1989). This increase in amplitude of zonal veloc-ity with respect to height is clearly seen in the Figs. 3, 4, 5 and 6. It can be noted from the figures that the waves show much variation both in amplitude and phase with altitude, suggesting that the waves are propagating vertically (Liziola and Balsley, 1997). These vertically propagating waves will begin to break when there is a sudden change in the tem-perature lapse rate and will dissipate, producing turbulence. It can be seen from Figs. 8, 9, 10 and 11 that the spectral peaks repeat in spectra at different heights, which can be at-tributed to propagating internal gravity waves. Gavrilov et al. (1996) reported that the spectral peaks repeat in spectra at different altitudes, which can be attributed to propagat-ing internal gravity waves. Allen and Vincent (1995) also found that gravity wave activity in the lower stratosphere is larger at low latitudes and is maximum during winter at mid-latitudes and during the wet season (December to Febru-ary) at low-latitudes. The long period gravity waves which cause the wind fluctuations are generated in the lower tro-posphere and the observed results suggest that the horizontal propagation of gravity waves is azimuthally isotropic near the wave source, and the eastward travelling waves seem to be filtered out during their upward propagation, which might result in the observed westward bias of the momentum flux. The overall results suggest that (Figs. 14 and 15), due to their persistent southward direction of propagation, long-period waves make a contribution to the momentum flux in the lower stratosphere, which is comparable to that of short-period waves during 9–12 April 2001 and 22–25 January 2002. During 16–19 October 2000 (post-monsoon), merid-ional momentum flux is northward direction. It is found that in the troposphere and lower stratosphere, during 9–12 April 2001 (summer) and 22–25 January 2002 (winter), the zonal momentum flux is in the westward and eastward direction, respectively, but it is the reverse of the observations at meso-spheric heights reported by Nakamura et al. (1996).
Acknowledgements. The authors are thankful to the UGC-SVU
Center for MST radar Applications, S. V. University, Tirupati and National MST radar Facility (NMRF), Gadanki for providing nec-essary facilities to carry out this work. I. V. Subba Reddy is thankful to the Advanced Centre for Atmospheric Sciences, Department of Space, Govt. of India and also to the Council of Scientific and In-dustrial Research (CSIR) for providing Junior Research Fellowship and Senior Research Fellowship, respectively.
Topical Editor U.-P. Hoppe thanks two referees for their help in evaluating this paper.
References
Alexander, M. J. and Pfister, L. P.: Gravity wave momentum flux in the lower stratosphere over convection, Geophys. Res. Lett., 22, 2029–2032, 1995.
Allen, S. and Vincent, R. A.: Gravity wave activity in the lower at-mosphere: seasonal and latitudinal variations, J. Geophys. Res., 100, 1327–1350, 1995.
Balsley, B. B. and Gage, K. S.: The MST radar technique: Potential for middle atmospheric studies, Pure Appl. Geophys., 118, 452– 493, 1980.
Chang, J. L., Avery, S. K., and Riddle, A. C.: First results of tropo-spheric gravity wave momentum flux measurements over Christ-mas Island, Radio Sci., 32, 727–748, 1997.
Clark, T. E., Hauf, T., and Kuettner, J. P.: Convectively forced in-ternal gravity waves: Results from two-dimensional numerical experiments, Quart. J. Roy. Meteorol. Soc., 112, 899–925, 1986. Dhaka, S. K., Devarajan, P. K., Shibagaki, Y., Choudhary, R. K., and Fukao, S.: Indian MST radar observations of gravity wave activities associated with tropical convection, J. Atmos. Solar-Terr. Phys., 63, 1631–1642, 2001.
Dhaka, S. K., Choudhary, R. K., Malik, S., Shibagaki, Y., Ya-manaka, M. D., and Fukao, S.: Observable signatures of a con-vectively generated gravity wave field over the tropics using
In-dian MST radar at Gadanki (13.5◦N, 79.2◦E), Geophys. Res.
Lett., 29, 1872–1875, 2002.
Dunkerton, T. J.: Theory of internal gravity wave saturation, Pure Appl. Geophys., 130, 373–397, 1989.
Dutta, G., Bapiraju, B., Balasubramanyam, P., and Aleem Basha, H.: VHF radar observations of gravity waves at a low latitude, Ann. Geophys., 17, 1012–1019, 1999.
Fetzer, E. J. and Gille, J. C.: Gravity wave variance LIMS temper-atures, I. Variability and comparison with background winds, J. Atmos. Sci., 51, 2461–2483, 1994.
Fritts, D. C.: Shear excitation of atmospheric gravity waves, J. At-mos. Sci., 39, 1936–1952, 1982.
Fritts, D. C.: Shear excitation of atmospheric gravity waves, part II, Nonlinear radiation from a free shear layer, J. Atmos. Sci., 41, 524–537, 1984.
Fritts D. C.: A Review of gravity wave saturation process, effects and variability in the middle atmosphere, Pageoph, 130, 343– 371, 1989.
Fritts, D. C. and Luo, Z.: Gravity wave excitation by geostrophic adjustment of the jet stream, part II, Two-dimensional forcing, J. Atmos. Sci., 49, 861–697, 1992.
Fritts, D. C. and Nastrom, G. D.: Sources of mesoscale variability of gravity waves, II, Frontal, Convective and Jet stream excitation, J. Atmos. Sci., 49, 111–127, 1992.
Fritts, D. C. and Alexander, M. J.: Gravity wave dynamics and ef-fects in the middle atmosphere, Rev. Geophys., 41, 3–60, 2003. Fritts, D. C., Geller, M. A., Balsley, B. B., Chanin, M. L., Hirota, I.,
Holton, J. R., Kato, S., Lindzen, R. S., Schoebert, M. R., Vincent, R. A., and Woodman, R. F.: Research status and recommenda-tions from the Alaska workshop on gravity waves and turbulence in the middle atmosphere, Bull. Amer. Meteorol. Soc., 65, 149– 159, 1984.
Gavrilov, N. M., Fukao, S., Nakamura, T., Tsuda, T., Yamanaka, M. D., and Yamamoto, M.: Statistical analysis of gravity waves ob-served with the middle and upper atmosphere radar in the middle atmosphere, 1. Method and general characteristics, J. Geophys. Res., 101, 29 511–29 521, 1996.
3260 I. V. Subba Reddy et al.: Studies on atmospheric gravity wave activity at Gadanki
Gossard, E. E. and Hooke, W. H.: Waves in the atmosphere, Else-vier Scientific publishing company, Amsterdam, 1975.
Hildebrand, P. H. and Sekhon, R. S.: Objective determination of the noise level in Doppler spectra, J. Appl. Meteorol., 13, 808–811, 1974.
Hines, C. O.: Internal atmospheric gravity waves at Ionospheric heights, Can. J. Phys., 38, 1440–1481, 1960.
Hoppe, U. P. and Fritts, D. C.: High resolution measurements of vertical velocity with the European incoherent scatter VHF radar, 1. Motion field characteristics and measurement biases, J. Geo-phys. Res., 100, 16 813–16 825, 1995.
Jagannadha Rao, V. V. M., Venkat Ratnam, M., and Narayana Rao, D.: Study of mean vertical motions over Gadanki (13.5◦N, 79.2◦E), a tropical station, using Indian MST radar, Radio Sci., 137, 06, 1108–1116, 2002.
Karoly, D. J., Roff, G. L., and Reeder, M. J.: Gravity wave activity associated with tropical convection detected in TOGA COARE sounding data, Geophys. Res. Lett., 23, 261–264, 1996. Keshav Kumar, Sachchidanand Singh, Mahajan, K. K., and
Srivas-tava, S. K.: Short period waves in the vertical wind using the Indian MST radar, Indian J. Radio and Space Phys., 23, 21–29, 1994.
Kishore, P.: Atmospheric studies using Indian MST radar – winds and turbulence parameters, Ph.D. Thesis, Sri Venkateswara Uni-versity, Tirupati, India, 1995.
Liziola, L. E. and Balsley, B. B.: Horizontally propagating quasi-sinusoidal tropospheric waves observed in the lee of the Andes, Geophys. Res. Lett., 24, 1075–1078, 1997.
Luo, Z. and Fritts, D. C.: Gravity wave excitation by geostrophic adjustment of the jet stream, part II: Three-dimensional forcing, J. Atmos. Sci., 50, 104–115, 1993.
Nagpal, O. P., Praveen Kumar, D., and Dhaka, S. K.: Characteristics of tropospheric gravity waves by the Indian MST radar: ST mode operation, Indian J. Radio and Space Phys., 23, 6–11, 1994. Nakamura, T., Tsuda, T., Fukao, S., Manson, A. H., Meek, C. E.,
Vincent, R. A., and Reid, I. M.: Mesospheric gravity waves at Saskatoon (52◦N), Kyoto (35◦N), and Adelaide (35◦S), J. Geo-phys. Res., 101, 7005–7012, 1996.
Nastrom, G. D., Fritts, D. C., and Gage, K. S.: An investigation of terrain effects on the mesoscale spectrum of atmospheric mo-tions, J. Atmos. Sci., 44, 3087–3096, 1987.
Nastrom, G. D., Peterson, M. R., Green, J. L., Gage, K. S., and VanZandt, T. E.: Sources of gravity wave activity seen in the vertical velocities observed by the Flatland VHF radar, J. Appl. Meteorol., 25, 783–792, 1990.
Nastrom, G. D. and Fritts, D. C.: Sources of mesoscale variability of gravity waves, I: Topographic excitation, J. Atmos. Sci., 49, 101–110, 1992.
Ogino, S., Yamanaka, M. D., and Fukao, S.: Meridional varia-tion of lower stratospheric gravity wave activity: a quick look at Hakuho-Maru J-COARE Cruise rawinsonde data, J. Meteorol. Soc. Japan., 73, 407–413, 1995.
Prichard, I. T. and Thomas, L.: Radar observatiopns of gravity-wave momentum fluxes in the tropospher and lower stratosphere, Ann. Geophys., 11, 1075–1083, 1993.
Rao, P. B., Jain, A. R., Kishore, P., Balamuralidhar, P., Damle, S. H., and Viswanathan, G.: Indian MST radar, 1, System description and sample vector wind measurements in ST mode, Radio Sci., 30, 1125–1138, 1995.
Rao, D. N., Kishore, P., Rao, T. N., Rao, S. V. B., Reddy, K. K., Yarraiah, M., and Hareesh, M.: Studies on refractivity structure constant, eddy dissipation rate, and momentum flux at a tropical latitude, Radio Sci., 32, 1375–1389, 1997.
Rao, D. N., Thulasiraman, S., Rao, S. V. B., Rao, T. N., Kishore, P., Venkat Ratnam, M., and Reddy, K. K.: VHF radar observations of tropical easterly jet stream over Gadanki, Adv. Space Res., 26, 943–946, 2000.
Sasi, M. N., Lekshmi Vijayan Deepa, V., and Krishna Murthy, B. V.: Possible gravity wave generation and propagation in the tropical easterly jet region, STEP hand Book, Proceedings of the Eighth workshop on technical and scientific aspects of MST radar, edited by: Edwards, B., 119–122, 1998.
Sato, K.: Small-scale wind disturbances observed with the MU radar during the passage of typhoon Kelly, J. Atmos. Sci., 50, 518–537, 1993.
Sato, K., Hashiguchi, H., and Fukao, S.: Gravity waves and turbulence associated with cumulus convection observed with the UHF/VHF clear-air Doppler radars, J. Geophys. Res., 100, 7111–7119, 1995.
Schubert, W. H., Hack, J. J., Silva Dias, P. L., and Fulton, S. R.: Geostrophic adjustment of an anti symmetric vortex, J. Atmos. Sci., 37, 1464–1484, 1980.
Shibagaki, Y., Yamanaka, M. D., Uyeda, H., Watanabe, A., Maekawa, Y., and Fukao, S.: Hierarchical structures of medium scale cyclones and cloud clusters near the Baiu front observed by the MU and Meteorological radars: outline and preliminary results of three weeks campaign, J. Geomagnetism and Geoelec-tricity, 67, 151–160, 1997.
Tsuda, T., Murayama, Y., Nakamura, T., Vincent, R. A., Manson, A. H., Meek, C. E., and Wilson, R. L.: Variations of gravity wave characteristics with height season and latitude revealed by com-parative observations, J. Atmos. Terr. Phys, 56, 555–568, 1994. Tsuda, T., Murayama, Y., Wiryosumarto, H., Harijono, S. W. B.,
and Kato, S.: Radiosonde observations of equatorial atmosphere dynamics over Indonesia 1. Equatorial waves and diurnal tides, J. Geophys. Res., 99, 10 491–10 506, 1994a.
Tsuda, T., Murayama, Y., Wiryosumarto, H., Harijono, S. W. B., and Kato, S.: Radiosonde observations of equatorial atmosphere dynamics over Indonesia, 2. Characteristics of gravity waves, J. Geophys. Res., 99, 10 507–10 516, 1994b.
Vincent, R. A. and Reid, I. M.: HF Doppler measurements of mesospheric gravity wave momentum fluxes, J. Atmos. Sci., 40, 1321–1333, 1983.
Wang, L. and Geller, M. A.: Morphology of gravity-wave energy as observed from 4 years (1998–2001) of high vertical resolution U. S. radiosonde data, J. Geophys. Res., 108, 4489–4507, 2003. Worthington R. M. and Thomas, L.: Long-period unstable
grav-ity waves and associated VHF radar echoes, Ann. Geophys., 15, 813–822, 1997,
SRef-ID: 1432-0576/ag/1997-15-813.
Wu, D. L. and Waters, J. W.: Satellite observations of atmospheric variances: A possible indication of gravity waves, Geophys. Res. Lett., 23, 3631–3634, 1996.