HAL Id: hal-03235256
https://hal.archives-ouvertes.fr/hal-03235256
Submitted on 27 May 2021
HAL is a multi-disciplinary open access
archive for the deposit and dissemination of
sci-entific research documents, whether they are
pub-lished or not. The documents may come from
teaching and research institutions in France or
abroad, or from public or private research centers.
L’archive ouverte pluridisciplinaire HAL, est
destinée au dépôt et à la diffusion de documents
scientifiques de niveau recherche, publiés ou non,
émanant des établissements d’enseignement et de
recherche français ou étrangers, des laboratoires
publics ou privés.
Distributed under a Creative Commons Attribution - NoDerivatives| 4.0 International
L- and P-bands
Samira Hosseini, Franck Garestier
To cite this version:
Samira Hosseini, Franck Garestier. Pol-InSAR sensitivity to hemi-boreal forest structure at L- and
P-bands. International Journal of Applied Earth Observation and Geoinformation, Elsevier, 2021, 94,
pp.102213. �10.1016/j.jag.2020.102213�. �hal-03235256�
Contents lists available atScienceDirect
Int J Appl Earth Obs Geoinformation
journal homepage:www.elsevier.com/locate/jag
Pol-InSAR sensitivity to hemi-boreal forest structure at L- and P-bands
Samira Hosseini
*
, Franck Garestier
University of Caen, France, Lab M2C, UMR CNRS 6143 Appart 2, Caen 14000, France
A R T I C L E I N F O Keywords: Forest Pol-InSAR Biomass Structure A B S T R A C T
A dual-frequency approach is proposed to discriminate hemi-boreal forest species using L- and P-band data. First, it is shown that L-band is less sensitive to the forest structure than P-band. Second, the underlying ground topography is estimated using polarimetric sub-space decomposition at P-band to minimize any potential bias. Then, the Gaussian backscatter model is employed to extract the forest vertical backscatter at P-band. The inverted profiles differ significantly over the various forest stands and in the polarimetric channels, indicating important P-band sensitivity to the forest vertical structure. According to these measurements, it is shown that tree species, as pines and spruces, were presenting different signatures related to the vertical distribution of their structural elements. On the contrary, sensitivity to the forest vertical heterogeneity is low at L-band, allowing to accurately invert the forest height from an empirical structure function. A general workflow taking advantage of both frequencies is finally proposed to discriminate the forest species.
1. Introduction
Boreal forests constitute 1/3 of global forest biomass. They cover about 15% of the Earth's land surface and play an important role in the global cycling of energy, carbon and water (Bonan and Shugart, 1989; Esseen et al., 1997). They are one of the most significant carbon sinks in the world and are considered global areas of increased warming, which represent possible important tipping points for climate change. There-fore, assessment of the boreal forest height and specie distribution using global coverage and constant revisit remote sensing techniques is cru-cial (Ulander et al., 2011). The forest height and structure, i.e. its vertical heterogeneity, are the main parameters for estimating above ground biomass (Hardy, 2003). Radar imagery is especially adapted to forest monitoring due to its low sensitivity to weather conditions (Richards et al., 1987; Ranson and Sun, 1994; Rignot et al., 1995) and polarimetric SAR interferometry (Pol-InSAR) has appeared in recent years as a promising technique to estimate forest biomass due to its sensitivity to forest height and vertical structure (Garestier et al., 2008; Praks et al., 2007; Tebaldini, 2009; Neumann et al., 2010).
The random volume over ground (RVoG) model, which represents the forest medium as a homogeneous random volume, has been widely used for forest height estimation at different frequencies (Cloude and Papathanassiou, 2003; Mette et al., 2006; Arnaubec et al., 2014; Babu and Kumar, 2018). This model assumes the volume interferometric coherence as a function of physical parameters: forest height, volume mean extinction coefficient, ground to volume power ratio and ground
interferometric phase. One of its drawbacks is that it considers the forest as a homogeneous layer containing randomly oriented uniform particles and does not take into account the forest vertical hetero-geneity (Fu et al., 2017), that is why structural volume over ground (SVoG) has been developed to take in to account the forest vertical heterogeneity (Cloude, 2006; Lavalle et al., 2018, 2017). Also the method based on an eigenvector analysis of the scattering coherency matrix was applied to estimate forest structure parameters (Cloude et al., 2007). At high frequency, the forest modeling especially fulfil this assumption as radar wave interaction occur at the top part of the ca-nopy, where the smallest structural elements are located, like leaves and twigs. But at low frequency, such as P-band, it is known that radar waves interact with structural elements, potentially lower in the forest canopies. They interact with the biggest tree structural elements that are not distributed homogeneously in the vertical direction.
In the recent decade, integration of the forest vertical heterogeneity in the Pol-InSAR models has led to various models (Garestier and Le Toan, 2010a, 2010b; Neumann et al., 2010; Tebaldini and Rocca, 2012). First, a model that represents RVoG by considering a vertically varying extinction is published inGarestier and Le Toan (2010b). In the same paper, the interferometric coherence expression associated with a truncated Gaussian backscatter profile has been proposed to investigate the forest vertical heterogeneity using single baseline data. Also, po-larization coherence tomography (PCT) was developed to estimate forest vertical backscatter profile using several baselines (Cloude, 2006; Kugler et al., 2009). The number of baselines increases the complexity
https://doi.org/10.1016/j.jag.2020.102213
Received 30 January 2020; Received in revised form 2 June 2020; Accepted 5 August 2020
⁎Corresponding author.
E-mail address:[email protected](S. Hosseini).
Int J Appl Earth Obs Geoinformation 94 (2021) 102213
Available online 03 September 2020
0303-2434/ © 2020 The Authors. Published by Elsevier B.V. This is an open access article under the CC BY-NC-ND license (http://creativecommons.org/licenses/by-nc-nd/4.0/).
of the inverted vertical backscatter function. In a similar way, multi-baseline approaches were formalized to estimate forest height and ground phase (Neumann, 2009; Tebaldini and Rocca, 2012; Neumann et al., 2010; Fu et al., 2016; Aghababaee et al., 2018). Finally, a weighted complex least squares adjustment algorithm was proposed to extract the forest height from multi-baseline Pol-InSAR data (Sun et al., 2019). The main drawback of this method is the use of multiple base-lines that can introduce temporal decorrelation (Zebker et al., 1992; Lavalle et al., 2012; Minh et al., 2015). Another limitation of these methods can be found in the acquisition constraints in terms of re-solution (Tello et al., 2016). More recently, a dual frequency approach has been investigated, where statistical models are fitted to different combinations of topographic-corrected SAR backscatter and forest heights estimated from RVoG model for the biomass estimation (Schlund and Davidson, 2018).
The aim of this work is to detect and estimate potentially hetero-geneous vertical structure using Gaussian backscatter model (GBm) over the hemiboreal forest at L- and P-bands. Our method relies on single baseline acquisitions to minimize the sensitivity of the approach to temporal decorrelation (Lavalle et al., 2012). We then selected
interferometric pairs with a short temporal baseline to investigate the forest vertical heterogeneity effect on the Pol-InSAR signal in the ab-sence of temporal decorrelation. Furthermore, the analysis is conducted over different stands to evaluate the capacity of this approach to dis-tinguish different forest species. A dual-frequency approach is then proposed to estimate the forest height and the vertical backscatter profile to distinguish the forest species, by taking advantage of both L-and P-bL-and specificities.
Section2introduces the test site and the Pol-InSAR data. Section3
deals with the integration of vertical structure/heterogeneity in the forest models. Forest structure inversion is evaluated at both fre-quencies in Section 4. Also, potential of hemi-boreal forest species discrimination at low frequency is investigated in this section. Section5
is dedicated to accuracy assessment of the proposed dual frequency approach. It includes ground topography, forest height estimation and species discrimination.
2. Test site and data presentation
The test site is located in the Remningstorp forest, southern Sweden, Fig. 1. (a) Location of interferometric coherence associated with Gaussian vertical backscatter model in yellow, for a given height and varying relative elevations/
standard deviations. (b) Backscatter profile comparison of RVoG and GBm where relative elevation is set to one (orange diamonds in (a)). (c) and (d) Possible backscatter profiles for blue and red curves, respectively, of (a). (For interpretation of the references to color in this figure legend, the reader is referred to the web version of this article.)
(58°28′ N, 13°38′ E) and includes 1200 ha of managed hemiboreal forest (Hajnsek et al., 2008, 2009; Ulander et al., 2011). The forested area is dominated by Norway spruce (Picea abies), Scots pine (Pinus sylvestris) and birch (Betula spp). The topography is fairly flat, with an elevation range of approximately 20 m, between 120 and 140 m above sea level. The forest height is between 5 and 35 m, and the maximum biomass reaches 370 tons/ha at the stand level (Ulander et al., 2011).
DLR (German Aerospace Center)'s E-SAR system acquired data over the Remningstorp forest at L- and P-bands, during the BIOSAR cam-paign, at three different dates: March 9, March 31, and May 2, 2007. The flight altitude is 3900 m above the ground and the look angle varies from 25° to 55° from near to far range. The slant range resolution is 2 m and azimuth resolution is 1.6 m. The temporal baseline does not exceed some hours and the nominal spatial baseline spacing is 8 m at L-band and 19 m at P-band. LiDAR data was acquired over the Remningstorp estate in August and September 2010 by the helicopter-borne laser scanning system TopEye. A raster image file that covers the most parts of the Remningstorp estate contains one of the LiDAR metrics, i.e. the 95th percentile of LiDAR return values above the height threshold. The height threshold was 1 m and 10% of the maximum height (perc95). In the ground truth data, there were stands that were dominated by pine, spruce and birch with their coordinates. These stands are located and described inUlander et al. (2011). Also, the ground truth data (specie distribution, structural parameters, etc.) and the reference LiDAR data (DSM for forest height and DTM for ground level), used in this study, were collected from BioSAR2010 ESA Earth Observation Campaigns (Ulander et al., 2011).
3. Integration of vertical structure/heterogeneity in the forest models
The general formulation of the interferometric coherence associated with a penetrable layer of thickness hνis,
= P z e P z ( ) dz ( )dz h z h 0 ik 0 z (1) where P(z) is the vertical backscatter function and kz is the vertical
wave number (Rosen et al., 2000). The effect of terrain slope is not taken into consideration in our analysis, as it is low, then the latter is defined as, = = k H 4 sin 2 z 2 (2)
H2πis height of ambiguity, λ is the wavelength and δθ expresses the incidence angle difference between the two interferometric antennas.
The RVoG model uses an exponential law to describe the height distribution of the backscatter power as (Cloude and Papathanassiou, 2003),
= P z( , )z e
z
cosz (3)
where θ is the local incidence angle and σ is the mean extinction coefficient.
The interferometric coherence can then be formulated as, Fig. 2. Polarimetric phase centers associated with the lexicographic basis at L- and P- bands (a,b) and highest/lowest polarimetric phase centers (c,d) as a function of
the forest height at L- and P- bands.
= = + +
(
)
h e e e e e ( , ) dz dz 1 1 1 1 z h z jk z h z h z h 0 2 cos 0 2 cos jk cos 2 jk 2 cos z z z z z 2 cos (4) To take into account the forest vertical heterogeneity, the GBm uses a truncated Gaussian function to describe height distribution of the backscatter power as (Garestier and Le Toan, 2010),= P z( , , ) e , z [0,h] z ( ) 2 2 2 (5)
where δ is associated with the relative elevation (expressing the nor-malized elevation) of the strongest backscattered power (relative peak elevation of curve in the canopy layer) and χ with relative the standard deviation (normalized standard elevation) of the vertical profile (ver-tical extent of the scatterers).
Interferometric volume coherence associated with a backscatter power distributed over a height interval hνis then calculated as,
= = + + + + +
(
) (
)
( )
( )
(
)
(
)
h e e e j k j k ( , , ) dz dz . erf erf erf erf h z h k j k z z h h 0 jk 0 2 1 2 1 2 2 2 z z z z z ( )2 2 2 ( )2 2 2 2 2 (6) where erf is the Gaussian error function.The location of the interferometric coherence associated with a Gaussian backscatter profile, in the complex plane, is given inFig. 1(a). For a volume of given height, increase of relative elevation induces a rotation in the complex plane, as the interferometric phase impact on the angular position. However, increasing of standard deviation induces volume decorrelation, then leads to migration from trigonometric circle
to the center of complex plane, because the radial position is associated with the coherence. But when the relative elevation is not equal to the half of the forest height, the truncated Gaussian profile tends to become even more asymmetric so that the standard deviation increases. Con-sequently, the interferometric coherence will migrate radially while rotating to join the location of a uniform profile interferometric co-herence. It is equivalent to a null extinction random volume and an-gularly located at the half of the one associated with the top volume position. Possible Gaussian backscatter profiles associated with red and blue curves, corresponding to 0.4 and 0.75 relative elevations respec-tively, are shown in Fig. 1(c)-1 (d), using the same color code. In
Fig. 1(a), interferometric coherence associated with a RVoG of com-parable height is symbolized by orange diamonds. When RVoG ex-tinction decreases from infinity to null value, the interferometric co-herence migrates toward the center of the complex plane, the angular position is reduced by a factor 2 (the volume phase center falls at half of the volume height). As observable inFig. 1(a), the orange diamonds appear almost superimposed to the last yellow curve, meaning that a random volume has close properties of a 1 relative elevation GBm. For the latter, the backscatter profile is modeled with a half Gaussian then, increasing standard deviation is equivalent to decreasing extinction in RVoG forest representation (Fig. 1(b)). It means that GBm can also describe homogeneous media: when relative elevation exceeds 1, it tends to fit a decreasing exponential.
4. Hemiboreal forest vertical heterogeneity estimation at L- and P-band
4.1. Vertical distribution of the phase centers at both frequencies
In this work, we selected forest stands of various heights derived from the DSM over 58 training stands. All the forest stands are located in the central part of the data, illuminated by E-SAR in BioSAR 2007 and by SETHI in 2010 (Ulander et al., 2011). The mutual spatial overlap of the L- and P-band acquisitions is analyzed, where the half of the height of ambiguity exceeds the maximum forest height at both fre-quencies (the possible maximum phase center interferometric co-herence remains in the upper half of the complex plane). We first analyzed the distribution of the phase center heights at L- and P-bands, as a function of the forest height. To do this, LiDAR derived vegetation height is estimated from DSM histogram associated with each ROI. The underlying ground interferometric phase is derived from DTM after matching the mean of the co-polar interferometric phases over close bare ground surfaces (HH and VV interferometric phases are known to present high SNR over bare soils).
Fig. 2(a) and (b) shows the height of the polarimetric phase centers associated with the lexicographic basis as a function of the forest height at L- and P- band, respectively. Firstly, it is observed that the phase centers are located some meters higher at L-band than at P-band due to reduced penetration. It is located on the top part of the canopy for the lowest forest stands. Also, the polarimetric phase centers appear more stable at P-band than at L-band. Over the lowest forest stands, the high VV phase center height could account for signature of an oriented vo-lume (oriented vovo-lume over ground model (Hajnsek and Cloude, 2005)). Over the highest forest stands characterized by lower tree density, the co-polar phase centers fall due to the increasing of ground contribution.
Fig. 2(c) and (d) represents highest and lowest polarimetric phase centers as a function of the forest height at L- and P- band, respectively. According toFlynn et al. (2002)andColin et al. (2006), the boundary of the coherence region are computed after solving the eigenproblem of Eq.(7)for each ϕ value,
=
T 12 H( )T 12 ( ) (7)
With, Fig. 3. Maximum phase center height difference at L- (black) and P-band (grey)
as a function of the forest height (top). Maximum phase center height difference at P-band versus at L-band (bottom).
= + = + T 1 T T e e 2( ) and ( ) 1 2( ), [0, [ H j j 11 22 12 12† (8) The optimal ω eigenvectors correspond to the polarization that max-imizes and minmax-imizes the interferometric phase.
In the bottom part ofFig. 2, polarimetric phase center extent and mean elevation are higher at L-band than at P-band. At P-band, the lowest phase center is located around 4 m above the ground level on average.
To go a little in depth about the interaction with the forest media at both frequencies, let's consider their maximum phase center height difference as a function of the forest height, represented in the top part ofFig. 3. It confirms that the phase centers are globally more spaced at L-band but it also appears that their maximum difference is also more variable, compared to P-band, especially for the highest stands. In the bottom part ofFig. 3, the maximum phase center height difference is faced at both frequencies. The overall difference results in a deviation from the 1:1 line, clearly observable for the lowest stands, contrary to Fig. 4. δ − χ space solutions for different forest heights at L- (left) and P-band (right).
the highest ones. In accordance withFig. 2, the sole effect of extinction explains the observed differences over the youngest stands. On the other hand, the higher ground to volume power ratio at P-band seems to limit its variations between the polarimetric channels, leading to more stable phase center height positions for the highest stands.
Be that as it may, it can be noted that the co- and cross-polarizations of the lexicographic basis are representative of the polarimetric in-formation diversity. Therefore, this basis will be selected for the fol-lowing Pol-InSAR analyses.
4.2. Sensitivity to forest vertical structure at both frequencies
To avoid any error propagation in the forest height estimation, we used the Lidar derived ground topography map to extract the ground interferometric phase below all the investigated forest stands using the simple methodology described in Section4.1.
Fig. 4 displays the results of the inversion of the forest vertical heterogeneity using GBm. It is taken over the whole data, ROIs corre-spond to all the homogeneous forested areas (the homogeneity is se-lected from both LiDAR DEM value and texture). To avoid introducing bias in our analysis, we chose to not assume reception of pure volume
contribution in the polarimetric channel associated with the highest phase center. As we concluded in Section4.1that the polarizations of the lexicographic basis were representative of the polarimetric diversity of the phase center heights, the GBm inversion was performed in these three polarimetric channels, associated with distinct scattering me-chanisms. We then linearly extrapolated the ensemble of solutions of the vertical backscatter profile from both ground and polarimetric in-terferometric coherences.
Fig. 4shows different trends in the 2D δ − χ space at L- and P-bands. To illustrate the possible vertical backscatter profiles associated with such trends,Fig. 5shows three typical cases. For the black curve, standard deviation does not vary in a wide extent and elevation globally takes high values. For the red curve, variation of standard deviation is important with an almost constant elevation. Then, the blue curve corresponds to a decreasing elevation and increasing standard devia-tion. These curves cover the different structures that can be detected using GBm and the possible backscatter profiles are represented in
Fig. 5(b)–(d), respectively.
First,Fig. 4shows that the forest vertical heterogeneity seen by the SAR interferometer varies from one polarization to another, but more importantly at P-band than at L-band. At L-band, this variation remains Fig. 5. (a) Three typical two dimensional δ − χ space solutions and associated possible backscatter profiles (b–d). (b) Standard deviation does not vary in a wide
extent and elevation takes high values. (c) Decreasing elevation and increasing standard deviation. (d) Variation of standard deviation is high with an almost constant elevation. (For interpretation of the references to color in this figure citation, the reader is referred to the web version of this article.)
low and the peak of the backscatter profile always reaches high ele-vation in the canopy. According toFig. 5, such curve trend in the δ − χ space is associated with a quite low penetration in the forest medium. The radar waves interact with the upper part of the canopy, as expected at L-band. The inverted backscatter profiles do not differ so much from a polarimetric channel to another. According toFig. 1(b), the inverted backscatter profile present some similarity with a decreasing
exponential. Consequently, the hemi-boreal forest presents properties close to a random volume or an oriented volume with a small or-ientation effect.
4.3. Specie discrimination at P-band
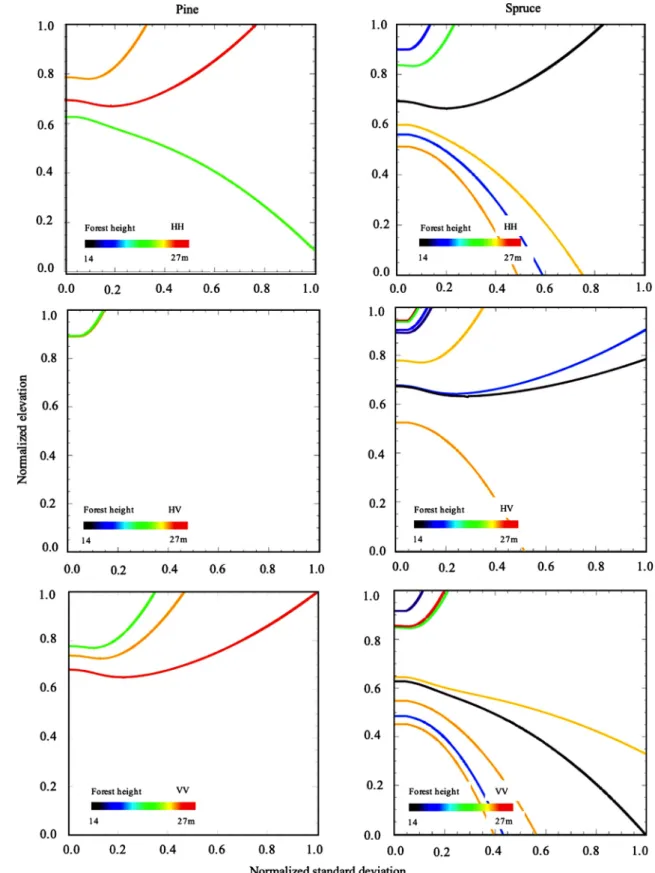
At P-band, a wide variety of trends is observed in the δ − χ space: Fig. 6. δ − χ space solutions for different forest heights pine (left) and spruce (right) at P-band.
the backscatter profiles that can be estimated using GBm potentially show their maximum elevation from bottom (blue curve ofFig. 5(a)) to top of the canopy (black line ofFig. 5(a)). When the relative standard deviation tends to infinity, if the slope of the δ − χ curve is positive, the backscatter profile becomes in fact similar to the exponential RVoG one. At the contrary, the stands associated with curves of negative slopes cannot be represented by such model. Then, the widely different δ − χ signatures recorded in the different polarimetric channels take the forest representation even further away from a random volume. To go in depth in the understanding and in the interpretation of P-band waves interaction with forest, the stands that have accurate ground mea-surements will now be analyzed.
Over hemi-boreal forest, pines and spruces are characterized by a separated crown, and by the presence of primary branches over its whole height, respectively (Hajnsek et al., 2008, 2009).Fig. 6shows extracted possible backscatter profiles using GBm over stands domi-nated by pines (left) and spruces (right). For dominant pine tree stands, the inverted backscatter profiles globally show important elevations and low standard deviations. It suggests a backscatter peak at the bottom of the crown, as already observed in a temperate maritime pine forest (Garestier and Le Toan, 2010a). At the contrary, several stands dominated by spruces are associated with curves of negative slope, especially in co-polar channel. It looks in accordance with the spruce structure, presenting primary branches in the lower half of the canopy.
5. Accuracy assessment of forest height and structure estimates
5.1. Ground phase estimation at P-band
In a two-layer model, the theoretical validity domain of the inter-ferometric coherence associated with a given power ratio of both con-tributions is a line in the complex plane. This line joins the interfero-metric coherences associated with each layer. Its position is dependent on the ground-to-volume scattering ratio of both contributions in the backscattered signal, which varies with polarization (Papathanassiou and Cloude, 2001; Cloude and Papathanassiou, 1998). Describing the forest with ground and volume layers in the absence of any temporal decorrelation, the interferometric coherence associated with a polar-ization ω can be defined as,
= + + e m m ( ) ( ) 1 ( )(1 ) i 0 (9) where ϕ0is the ground interferometric phase, γνis the volume
inter-ferometric coherence and m(ω) is the effective ground to volume power ratio.
Fig. 7shows the offset of ground height estimation from Pol-InSAR L- and P-band data compared to LiDAR derived ground level. Ground interferometric phase is estimated after linear extrapolation of the in-terferometric coherences associated with Pauli and lexicographic bases, in the complex plane. We found that the bias was higher at L-band and the estimated values show important dispersion at P-band for lower forests. It is noticeable that insertion of the optimal interferometric coherences in the linear regression problem did not provide better re-sults. Therefore, to reduce the bias in the ground phase estimation, we investigated the reduction of the problem to a dual-pol formulation. The short temporal baselines satisfy the condition of polarimetric sta-bility and the interferometric coherence expression can be contracted as, = T T ( ) † (1/2) 12 (1/2) (10) In fact, at dual-pol, as T−(1/2)Ω 12T−(1/2) is a two dimensional complex quadratic form. Its field of values draws an ellipse in the complex plane. The eigenvalues of the quadratic form locate the foci of the ellipse. It will be employed to linearly extrapolate the ground phase in the complex plane. All the possible polarimetric combinations have been evaluated but only the contraction in the HH-HV dual-pol space has improved the ground estimation at P-band. It is shown in red in
Fig. 7. It is noticeable that the inversion performance can be improved using a multi-baseline approach, as demonstrated in Kugler et al. (2008), the linear extrapolation of the ground phase being independent of the temporal decorrelation of the canopy.
Fig. 7. Ground height estimation using lexicographic and Pauli basis at L- and
P-bands (in gray and black colors, respectively), and using foci of the dual-pol HH-HV region of coherence at P-band (in red color). (For interpretation of the references to color in this figure legend, the reader is referred to the web ver-sion of this article.)
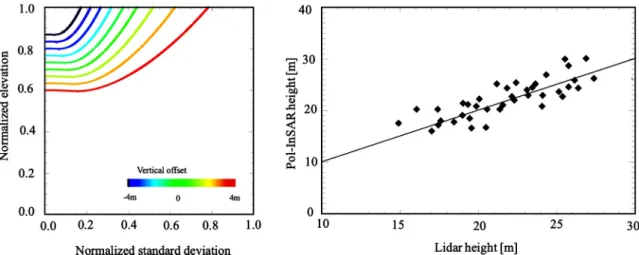
Fig. 8. Error assessment in the δ − χ space for height bias ranging from −4 to +4 m, in context of a 25 m height forest with a 60 m height of ambiguity (left). Forest
5.2. Forest height inversion at L-band
Concerning the forest height inversion, the most suitable frequency should minimize the sensitivity to forest structure to provide robust
estimates. It has been observed inFig. 4that the lowest diversity of the signatures in the δ − χ space was occurring at L-band, especially in the HV channel. As the GBm depends on three structural parameters, the mean ˆ= f( )relation associated with HV channel at L-band appears the best candidate to get an unique solution for forest height estimation. Then, by fitting a polynomial on the mean of the curves in HV channel at L-band, Eq.(11)can be extracted:
= + + +
ˆ 0.86 0.16 10.21 2 166.17 3 694.63 4 1097 5 (11)
Finally, by injecting Eq.(11)in Eq.(6), the latter will be reduced to one unknown, then the forest height can be estimated unambiguously. The left side ofFig. 8represents the bias in the forest height esti-mation induced by such approxiesti-mation. The examples of a 25 m height forest and a 60 m height of ambiguity, in accordance with our data, are taken. It appears that the bias is between −3 and +3 m. To evaluate this theoretical accuracy assessment over the data, we performed the height inversion over a set of smaller ROIs that does not intersect the forest boundaries, included in the initial bigger ones. We then verify that potential height heterogeneities included in the initial bigger ROIs didn’t affect the estimation of Eq.(11). In fact, the right side ofFig. 8
shows that the height is retrieved with an accuracy of the same order and remains unbiased (the RMSE is 2.16 m and R2is 0.65).
5.3. Dual frequency approach for specie discrimination
The methodology proposed in this paper will use both L- and P-bands for species discrimination. As summarized inFig. 9, the ground phase is estimated at P-band, in the dual-pol HH-HV space, because it provides a minimal potential bias. The reduction of the coherence re-gion to a dual-pol space forms an ellipse of which the foci are linearly extrapolated to intersect the trigonometric circle and estimate the ground phase, as shown inFig. 9(a).
The lowest sensitivity to the forest vertical heterogeneity is ob-served at L-band, especially in HV channel. Therefore, the δ − χ mean trend, expressed by Eq.(11), is employed as a structural model to es-timate the forest height. The dimension reduction of the GBm allows then to estimate the forest height without any ambiguity. The height solution ideally displays a line segment superimposed on the one joining HV and pure ground interferometric coherences in the complex plane, as shown inFig. 9(b).
Finally, pine and spruce species can be distinguished using their structural properties. From the forest height, estimated at L-band, a
δ − χ ensemble of solutions can be inverted using GBm at P-band, this
frequency maximizing the sensitivity to the forest vertical hetero-geneity. A simple and physically based criterion for forest specie dis-crimination can rely on the slope of the line joining both ends of the
δ − χ curves represented in Fig. 9(c). Among all the polarimetric channels, the minimum slope is displayed inTable 1.
It clearly appears that even if the stands are not composed of a single specie, the dominant specie has an influence on the δ − χ slope. The spruce dominant stands present the lowest values, which means that a scattering mechanism, associated with at least one of the linear polarization states, occurs in the lower part of the canopy. At the contrary, the pine dominant stands show higher values. The inverted backscatter domain of validity is consistent with the vertical distribu-tion of the structural elements of these two species: as shown by the photographs of pp. 23–24 inUlander et al. (2011), the pine branches are only located in the crown whereas spruces have branches from its lower part (pp. 25–26).Table 1shows that the species can be detected by the minimum δ– slope among the polarimetric channels. All the dominant spruce stands take lower values than pine dominant ones, except for a stand of low forest height. Note that these results are also consistent withGarestier and Le Toan (2010a), obtained over a tem-perate maritime pine forest. It is shown that the δ − χ curves all have positive slopes suggesting a backscatter occurring above the basis of the Fig. 9. Summary of the dual frequency approach for specie discrimination.
crown, Pinus pinaster presenting a comparable vertical structure to that of Pinus sylvestris.
Illustration of the robustness of the species discrimination using GBm is provided in Fig. 10. To do this, different biases induced by ground level and/or forest height estimation (leading to a similar effect in the δ − χ space) are numerically simulated from −4 to + 4 m. Ac-cording to the data, a 25 m height forest is considered with a 90 m height of ambiguity. Example of two vertical structures are taken, where the maximum backscatter is located within the top and bottom halfs of the canopy, respectively.
It is observed that the δ − χ space signature is not enough affected by 8 m height bias interval to avoid species discrimination (for the two typical cases of 0 m offset green curves).
Finally, the vertical wavenumber has an influence on the inversion performance, as the height and the vertical backscatter profile estimates depend on both the volume decorrelation and the interferometric phase.
InKugler et al. (2015), it is stated that high kzcompared to the
volume height would lead to coherence saturation as well as phase wrapping. For height inversion, it would then induce underestimation. For structure inversion, it may underestimate the relative standard deviation (by underestimating the volume decorrelation), as the slope in the δ − χ space would remain the same. In this sense, it may not affect the specie discrimination. Note that high kzwould induce more
decorrelation for a given volume height. Then, the consequent loss of accuracy of the interferometric phase, that could be compensated by an increase of the size of the estimation window, would affect both height estimation accuracy as well as specie discrimination through the com-putation of the slope in the δ − χ space. Anyway, for the method em-ployed in this paper, based on linear extrapolation in the complex plane, the vertical wavenumber must satisfy the condition: kz< π/hν.
On the contrary, too low kzwill make the inversion sensitive to
addi-tional residual decorrelations. In Kugler et al. (2015), it is re-commended that kzmust exceed 0.05 rad/m.
6. Conclusions
This paper proposes a dual frequency approach to estimate both forest height and vertical structure, which constitutes the main objec-tive of Pol-InSAR over forests (Caicoya et al., 2010; Renaudin et al., 2012). In fact, height is linked to above ground biomass through specie-specific allometric relation. The forest vertical heterogeneity differs from a specie to another then, this parameter is essential to accurately estimate the above ground biomass.
The sensitivity of the Pol-InSAR signal to the complexity of the forest vertical structure at long wavelengths is evaluated using GBm over SAR fully polarimetric interferometric data acquired at L- and P-bands. Vertical heterogeneity of the forest has been inverted through the estimate of two Gaussian parameters, the normalized standard de-viation and the normalized elevation.
At L-band, because of lower penetration, inverted truncated Gaussian profiles present high elevations with intermediate standard deviations. It suggests interaction mainly with the upper part of the canopy. Moreover, interaction of the radar waves seems to be less de-pendent on the polarization. It means that, even if the effect of vertical heterogeneity is present, hemiboreal forest can be approximated as an almost vertically homogeneous media at L-band.
At P-band, the reconstructed vertical backscatter profiles are more variables from one forest stand to another and some of them show low elevation Gaussian profiles. These different trends show how this SAR frequency is sensitive to the forest vertical heterogeneity. It is also observed that the interaction with the canopy is more polarization dependent.
The use of GBm allowed to distinguish different signatures for dominant spruces and dominant pines stand at P-band. Over dominant pine stands, the backscatter peak is almost always located in the upper part of the canopy. It is placed at the basis of the crown where the primary branches are the biggest. Over dominant spruce stands, in-verted backscatter peak spread into the lower half of the canopy, in agreement with the spruce branch distribution.
Table 1
Minimum slope in the δ − χ space among the linear polarizations.
Spruce dominant Pine dominant
−0.97 −1.14 −1.12 −0.79 −0.63 −1.08 −1.20 0.74 0.32 0.56 −0.54
Fig. 10. Error assessment in the δ − χ space for height bias ranging from −4 to +4 m, a 25 m forest height with a 90 m height of ambiguity, and two different
Consequently, an approach gaining benefit of the specificity of each frequency is proposed. The deeper penetration of P-band is exploited for ground level estimation. The diversity of the canopy structure in the polarimetric channels induces a bias in the linear extrapolation of the ground. It can be decreased by reducing the problem to a dual-pol formulation. In fact, selection of HH and HV channels ensures optimi-zation of the vertical separation of the phase centers while minimizing the difference of vertical extinction. This step would use several base-lines to increase the inversion performance as it remains independent of the temporal decorrelation of the canopy.
The lowest sensitivity to forest vertical structure is observed at L-band, especially in HV channel. It is shown that over the various forest stands, the forest vertical backscatter profile remains stable, in-dependent of the species and height. Then, an empirical structural model is provided to unambiguously estimate the forest height at this frequency.
Finally, using height and ground level estimates, the information of forest vertical heterogeneity is assessed at P-band through solution es-timation in the δ − χ space. Based on the accurate ground measure-ments performed over some restricted plots, analyses revealed different signatures between pine and spruces trees. It shows that the minimum slope, among the linear polarizations, of the δ − χ solution constitutes a species discrimination estimator.
In summary, this work showed first that the vertical heterogeneity has to be considered for Pol-InSAR parameter extraction at low fre-quencies, especially at P-band. The sensitivity of P-band to the forest vertical structure could be employed complementary to L-band Pol-InSAR data to distinguish the species and to estimate above ground biomass from the forest height using species related allometric equa-tions (Navar, 2009; Aboal et al., 2005). Even if the boreal forest bio-diversity is low, its above ground biomass constitutes 1/3 of global forest biomass. Therefore, assessment of the species distribution is of a great interest for better constraining the carbon exchanges with atmo-sphere. To complete these first results, further work is now required to evaluate the approach more in depth using more extended ground measurements over different forests of the boreal environment. Authors’ contribution
Samira Hosseini: conceptualization, methodology, writing – original draft, writing – reviewing and editing. Franck Garestier: con-ceptualization, methodology, writing – original draft, writing – re-viewing and editing.
Conflict of interest None declared.
Declaration of Competing Interest
The authors report no declarations of interest. References
Aboal, J.R., Arévalo, J.R., Fernández, Á., 2005. Allometric relationships of different tree species and stand above ground biomass in the Gomera laurel forest (Canary Islands). Flora-Morphol. Distrib. Funct. Ecol. Plants 200, 264–274.
Aghababaee, H., Budillon, A., Ferraioli, G., Fornaro, G., Pascazio, V., Schirinzi, G., 2018. Phase error compensation in multi-baseline SAR tomography. IGARSS 2018 – 2018 IEEE International Geoscience and Remote Sensing Symposium 6743–6745.
Arnaubec, A., Roueff, A., Dubois-Fernandez, P.C., Réfrégier, P., 2014. Vegetation height estimation precision with compact polinsar and homogeneous random volume over ground model. IEEE Trans. Geosci. Rem. Sens. 52, 1879–1891.
Babu, A., Kumar, S., 2018. Tree canopy height estimation using multi baseline RVoG inversion technique. International Archives of the Photogrammetry, Remote Sensing & Spatial Information Sciences.
Bonan, G.B., Shugart, H.H., 1989. Environmental factors and ecological processes in boreal forests. Annu. Rev. Ecol. Systemat. 20, 1–28.
Caicoya, A.T., Kugler, F., Papathanassiou, K., Biber, P., Pretzsch, H., 2010. Biomass
estimation as a function of vertical forest structure and forest height-potential and limitations for radar remote sensing. 8th European Conference on Synthetic Aperture Radar 1–4.
Cloude, S., Papathanassiou, K., 2003. Three-stage inversion process for polarimetric SAR interferometry. IEE Proceedings-Radar, Sonar and Navigation 150, 125–134.
Cloude, S., Viergerver, K., Woodhouse, I.H., 2007. Forest structure estimation using po-linsar. CD Proceedings of the First Joint PI Symposium of ALOS Data Nodes for ALOS Science Program in Kyoto.
Cloude, S.R., 2006. Polarization coherence tomography. Radio Sci. 41.
Cloude, S.R., Papathanassiou, K.P., 1998. Polarimetric SAR interferometry. IEEE Trans. Geosci. Rem. Sens. 36, 1551–1565.
Colin, E., Titin-Schnaider, C., Tabbara, W., 2006. An interferometric coherence optimi-zation method in radar polarimetry for high-resolution imagery. IEEE Trans. Geosci. Rem. Sens. 44, 167–175.
Esseen, P.A., Ehnström, B., Ericson, L., Sjöberg, K., 1997. Boreal forests. Ecol. Bull. 16–47.
Flynn, T., Tabb, M., Carande, R., 2002. Coherence region shape extraction for vegetation parameter estimation in polarimetric SAR interferometry. Geoscience and Remote Sensing Symposium, 2002. IGARSS’02. 2002 IEEE International 2596–2598.
Fu, H., Wang, C., Zhu, J., Xie, Q., Zhang, B., 2016. Estimation of pine forest height and underlying DEM using multi-baseline p-band polinsar data. Rem. Sens. 8, 820.
Fu, W., Guo, H., Song, P., Tian, B., Li, X., Sun, Z., 2017. Combination of polinsar and lidar techniques for forest height estimation. IEEE Geosci. Rem. Sens. Lett. 14, 1218–1222.
Garestier, F., Dubois-Fernandez, P.C., Papathanassiou, K.P., 2008. Pine forest height in-version using single-pass x-band polinsar data. IEEE Trans. Geosci. Rem. Sens. 46, 59–68.
Garestier, F., Le Toan, T., 2010a. Estimation of the backscatter vertical profile of a pine forest using single baseline p-band (pol-)insar data. IEEE Trans. Geosci. Rem. Sens. 48, 3340–3348.
Garestier, F., Le Toan, T., 2010b. Forest modeling for height inversion using single-baseline insar/pol-insar data. IEEE Trans. Geosci. Rem. Sens. 48, 1528–1539.
Hajnsek, I., Cloude, S., 2005. Differential extinction estimation over agricultural vege-tation from polinsar. ESA Special Publication 29.
Hajnsek, I., Scheiber, R., Keller, M., Horn, R., Lee, S., Ulander, L., Gustavsson, A., Sandberg, G., Toan, T.L., Tebaldini, S., Guarnieri, A.M., Rocca, F., 2009. BIOSAR 2008 Technical Assistance for the Development of Airborne SAR and Geophysical Measurements during the BioSAR 2008 Experiment. Technical Report.
Hajnsek, I., Scheiber, R., Ulander, L., Gustavsson, A., Sandberg, G., Tebaldini, S., Guarnieri, A.M., Rocca, F., Bombardini, F., Pardini, M., 2008. BIOSAR 2007 Technical Assistance for the Development of Airborne SAR and Geophysical Measurements during the BioSAR 2007 Experiment. Technical Report.
Hardy, J.T., 2003. Climate Change: Causes, Effects, and Solutions. John Wiley & Sons.
Kugler, F., Lee, S., Hajnsek, I., Papathanassiou, K.P., 2015. Forest height estimation by means of pol-insar data inversion: the role of the vertical wavenumber. IEEE Trans. Geosci. Rem. Sens. 53, 5294–5311.
Kugler, F., Lee, S.K., Papathanassiou, K.P., 2009. Estimation of forest vertical sructure parameter by means of multi-baseline pol-insar. 2009 IEEE International Geoscience and Remote Sensing Symposium pp. IV-721.
Kugler, F., Lopez-Martinez, C., Papathanassiou, K., Lee, S., 2008. Estimation of ground topography in forested terrain by means of polarimetric SAR interferometry. Geoscience and Remote Sensing Symposium, IGARSS’08.
Lavalle, M., Hawkins, B., Hensley, S., 2017. Tomographic imaging with uavsar: Current status and new results from the 2016 afrisar campaign. 2017 IEEE International Geoscience and Remote Sensing Symposium (IGARSS) 2485–2488.
Lavalle, M., Riel, B., Shiroma, G., Hawkins, B., 2018. Afrisar: Canopy Structure Derived from Polinsar and Coherence Tomosar Nisar Tools. Ornl Daac, Oak Ridge, Tennessee, USA.
Lavalle, M., Simard, M., Hensley, S., 2012. A temporal decorrelation model for polari-metric radar interferometers. IEEE Trans. Geosci. Rem. Sens. 50, 2880–2888.
Mette, T., Kugler, F., Papathanassiou, K., Hajnsek, I., 2006. Forest and the random volume over ground-nature and effect of 3 possible error types. European Conference on Synthetic Aperture Radar (EUSAR) 1–4.
Minh, D.H.T., Tebaldini, S., Rocca, F., Le Toan, T., 2015. The impact of temporal dec-orrelation on biomass tomography of tropical forests. IEEE Geosci. Rem. Sens. Lett. 12, 1297–1301.
Navar, J., 2009. Allometric equations for tree species and carbon stocks for forests of northwestern Mexico. Forest Ecol. Manag. 257, 427–434.
Neumann, M., 2009. Remote Sensing of Vegetation Using Multi-Baseline Polarimetric SAR Interferometry: Theoretical Modeling and Physical Parameter Retrieval. Univ. Rennes, Rennes, France (Ph.D. thesis, Ph.D. dissertation).
Neumann, M., Ferro-Famil, L., Reigber, A., 2010. Estimation of forest structure, ground, and canopy layer characteristics from multibaseline polarimetric interferometric SAR data. IEEE Trans. Geosci. Rem. Sens. 48, 1086–1104.
Papathanassiou, K.P., Cloude, S.R., 2001. Single-baseline polarimetric sar interferometry. IEEE Trans. Geosci. Rem. Sens. 39, 2352–2363.
Praks, J., Kugler, F., Papathanassiou, K.P., Hajnsek, I., Hallikainen, M., 2007. Height estimation of boreal forest: interferometric model-based inversion at l- and x-band versus hutscat profiling scatterometer. IEEE Geosci. Rem. Sens. Lett. 4, 466–470.
Ranson, K., Sun, G., 1994. Mapping biomass of a northern forest using multifrequency SAR data. IEEE Trans. Geosci. Rem. Sens. 32, 388–396.
Renaudin, E., Mercer, B., Zhang, Q., Collins, M., 2012. Biomass estimation using vertical forest structure from SAR tomography: a case study in Canadian boreal forest. Int. Arch. Photogram. Rem. Sens. Spatial Inform. Sci. 39, B8.
Richards, J.A., Sun, G., Simonett, q., 1987. L-band radar backscatter modeling of forest stands. IEEE Trans. Geosci. Rem. Sens. 487–498.
Rignot, E.J., Zimmermann, R., van Zyl, J.J., 1995. Spaceborne applications of p band imaging radars for measuring forest biomass. IEEE Trans. Geosci. Rem. Sens. 33,
1162–1169.
Rosen, P.A., Hensley, S., Joughin, I.R., Li, F.K., Madsen, S.N., Rodriguez, E., Goldstein, R.M., 2000. Synthetic aperture radar interferometry. Proc. IEEE 88, 333–382. Schlund, M., Davidson, M.W.J., 2018. Aboveground forest biomass estimation combining
l- and p-band SAR acquisitions. Rem. Sens. 10.https://doi.org/10.3390/rs10071151.
Sun, X., Wang, B., Xiang, M., Jiang, S., Fu, X., 2019. Forest height estimation based on constrained Gaussian vertical backscatter model using multi-baseline p-band pol-insar data. Rem. Sens. 11, 42.
Tebaldini, S., 2009. Algebraic synthesis of forest scenarios from multibaseline polinsar data. IEEE Trans. Geosci. Rem. Sens. 47, 4132–4142.
Tebaldini, S., Rocca, F., 2012. Multibaseline polarimetric SAR tomography of a boreal
forest at p- and l-bands. IEEE Trans. Geosci. Rem. Sens. 50, 232–246.
Tello, M., CazcarraBes, V., Pardini, M., Papathanassiou, K., 2016. Assessment of forest structure estimation by means of SAR tomography: Potential and limitations. 2016 IEEE International Geoscience and Remote Sensing Symposium (IGARSS) 32–35.
Ulander, L., Gustavsson, A., Flood, B., Murdin, D., Dubois-Fernandez, P., Dupuis, X., Sandberg, G., J. Soja, M., Eriksson, L., Fransson, J., Holmgren, J., Wallerman, J., 2011. BioSAR 2010 Technical Assistance for the Development of Airborne SAR and Geophysical Measurements during the BioSAR 2010 Experiment. Technical Report.
Zebker, H.A., Villasenor, J., et al., 1992. Decorrelation in interferometric radar echoes. IEEE Trans. Geosci. Rem. Sens. 30, 950–959.