HAL Id: hal-00297828
https://hal.archives-ouvertes.fr/hal-00297828
Submitted on 23 Nov 2005HAL is a multi-disciplinary open access
archive for the deposit and dissemination of sci-entific research documents, whether they are pub-lished or not. The documents may come from teaching and research institutions in France or abroad, or from public or private research centers.
L’archive ouverte pluridisciplinaire HAL, est destinée au dépôt et à la diffusion de documents scientifiques de niveau recherche, publiés ou non, émanant des établissements d’enseignement et de recherche français ou étrangers, des laboratoires publics ou privés.
C2-C10 hydrocarbon emissions from a boreal wetland
and forest floor
H. Hellén, H. Hakola, K.-H. Pystynen, J. Rinne, S. Haapanala
To cite this version:
H. Hellén, H. Hakola, K.-H. Pystynen, J. Rinne, S. Haapanala. C2-C10 hydrocarbon emissions from a boreal wetland and forest floor. Biogeosciences Discussions, European Geosciences Union, 2005, 2 (6), pp.1795-1814. �hal-00297828�
BGD
2, 1795–1814, 2005Boreal wetland and forest floor VOC
emissions
H. Hell ´en et al.
Title Page Abstract Introduction Conclusions References Tables Figures J I J I Back Close
Full Screen / Esc
Print Version Interactive Discussion EGU Biogeosciences Discussions, 2, 1795–1814, 2005 www.biogeosciences.net/bgd/2/1795/ SRef-ID: 1810-6285/bgd/2005-2-1795 European Geosciences Union
Biogeosciences Discussions
Biogeosciences Discussions is the access reviewed discussion forum of Biogeosciences
C
2
-C
10
hydrocarbon emissions from a
boreal wetland and forest floor
H. Hell ´en1, H. Hakola1, K.-H. Pystynen1, J. Rinne2, and S. Haapanala2
1
Finnish Meteorological Institute, PL 503, 00 101 Helsinki, Finland
2
University of Helsinki, Department of Physical Sciences, Helsinki, Finland
Received: 29 September 2005 – Accepted: 13 October 2005 – Published: 23 November 2005 Correspondence to: H. Hell ´en ([email protected])
BGD
2, 1795–1814, 2005Boreal wetland and forest floor VOC
emissions
H. Hell ´en et al.
Title Page Abstract Introduction Conclusions References Tables Figures J I J I Back Close
Full Screen / Esc
Print Version Interactive Discussion
EGU
Abstract
Emissions of various C2-C10 hydrocarbons and halogenated hydrocarbons from a bo-real wetland and Scots pine forest floor were measured by static chamber technique in south-western Finland. Isoprene was the main non-methane hydrocarbon emitted by the wetland but also small emissions of ethene, propane, propene, 1-butene,
2-5
methylpropene, butane, pentane and hexane were detected. The isoprene emission from the wetland was observed to follow the commonly used isoprene emission al-gorithm. The mean emission potential of isoprene was 224 µg m−2h−1 for the whole season. This is lower than the emission potentials published earlier and probably least partly due to the cold and cloudy weather during the measurements. No emissions of
10
monoterpenes or halogenated hydrocarbons from the wetland were detected. High-est hydrocarbon emissions from the Scots pine forHigh-est floor were measured in spring and autumn. Main emitted compounds were monoterpenes. Isoprene emissions were negligible. Highest monoterpene emissions were measured in spring after the snow had melted. Emissions dropped in the summer and increased again in autumn. The
15
total monoterpene emission rates varied from zero to 373 µg m−2h−1. Probable source for these emissions is decaying plant litter. Also small emissions of chloroform (100– 800 ng m−2h−1), ethene, propane, propene, 2-methylpropene, cis-2-butene, pentane, hexane and heptane were detected.
1. Introduction
20
The boreal zone covers large areas in the northern hemisphere and is the largest forested region on Earth. In addition to forests, wetlands are a typical feature of the real zone. Meanwhile the non-methane hydrocarbon (NMHC) emissions from the bo-real forest ecosystems have been studied quite intensively (e.g. Janson, 1993, Hakola et al., 1998, 2001, 2003, 2005; Rinne et al., 2000; Janson and De Serves, 2001;
Tar-25
BGD
2, 1795–1814, 2005Boreal wetland and forest floor VOC
emissions
H. Hell ´en et al.
Title Page Abstract Introduction Conclusions References Tables Figures J I J I Back Close
Full Screen / Esc
Print Version Interactive Discussion
EGU and De Serves (1998) and Haapanala et al. (2005) have shown that boreal wetlands
are a significant isoprene source. In a study by Rinnan et al. (2004) various VOCs, emitted from wetland microcosm samples taken from a wetland in Finland, were iden-tified.
The studies on the VOC emissions from forest ecosystems have mostly been
con-5
centrated on the emissions from tree canopies, as the emissions from e.g. decaying leaf and needle litter has been assumed small compared to the canopy emissions. This has been demonstrated also in the studies by Janson (1993), Janson et al. (1999), and Hayward et al. (2001), who found monoterpene emissions from the forest floor to be insignificant compared to the emissions from trees in summer. However, during the
10
other seasons forest floor may have an important role. Isidorov et al. (2003 and 2005) have found that decomposing leaf litter emits several different VOCs. These emissions would occur during autumn and again in spring after melting of snow and the ground.
Wetlands and forest floor may also be a significant source for the halogenated hydro-carbons which have been observed to be emitted e.g. by wetlands and forest floor in
15
Ireland (Dimmer et al., 2001), by coastal salt marshes in California (Rhew et al., 2000) and by forest floors in Denmark and Netherlands (Haselmann et al., 2000; Hoekstra et al., 2001). Soil emissions have been estimated to be major contributor to the atmo-spheric chloroform burden (Laturnus et al., 2002). However, due to the lack of emission data estimates are still highly uncertain.
20
In this study emissions of different C2-C10 hydrocarbons and halogenated hydro-carbons from a boreal wetland and forest floor were identified and their fluxes to the atmosphere were quantified.
2. Materials and methods
Forest floor measurements were conducted at Hyyti ¨al ¨a SMEAR II measurement
sta-25
tion (61◦510N, 24◦170E, 180 m a.s.l.) in the south boreal zone in southern Finland and the wetland measurements were carried out at Siikaneva fen located a few kilometers
BGD
2, 1795–1814, 2005Boreal wetland and forest floor VOC
emissions
H. Hell ´en et al.
Title Page Abstract Introduction Conclusions References Tables Figures J I J I Back Close
Full Screen / Esc
Print Version Interactive Discussion
EGU west from the SMEAR II station. The forest at the forest floor measurement site is
dominated by Scots pine (Pinus sylvestris L.) with some deciduous trees, such as Eu-ropean aspen (Populus tremula) and birches (Betula pendula and B. pubescens). The ground vegetation consists mainly of shrubs (Vaccinium myrtillus, V. vitis-idaea, Oxalis
acetosella). The forest floor at the site is covered with mosses (Dicranum polysetum,
5
Pleurozium schereberi, Hylocomium splendens). Soil type is Haplic Podzol. Siikaneva
is an open fen and vegetation is dominated by mosses (Sphagnum baltucum, S.
ma-jus and S. papillosum), sedges (Carex rostrata, C. limosa, Eriophorum vaginatum) and
Rannoch-rush (Scheuchezeria palustris). The fen is surrounded by coniferous forests. The measurements at Siikaneva were performed between June and October 2004 and
10
at Hyyti ¨al ¨a between April and October in 2004 and between April and June in 2005. Because of the lack of warm and sunny days in 2004 data, one additional measurement was conducted at Siikaneva on 18 August 2005.
Measurements were conducted using static chamber technique on five different stainless steel collars (60 cm×60 cm) in Siikaneva and on two different collars in
15
Hyyti ¨al ¨a. The collars were installed to the ground half year prior to the measure-ments and remained undisturbed throughout the measurement periods. Two different chambers were used; one with dimensions of 60 cm×60 cm×50 cm and another with 60 cm×60 cm×25 cm. Both chambers were covered inside with transparent Teflon film and a Teflon-membrane pump was used to recycle the air in the chamber.
20
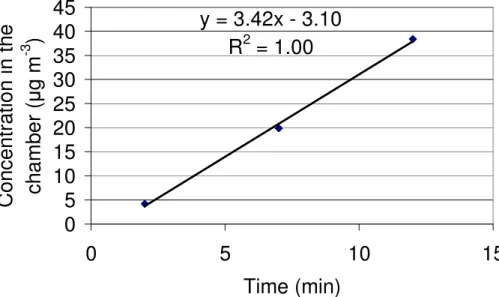
VOC emission was determined from the increase of the concentration in the chamber during the closure. Three samples were taken and analyzed during each closure. The concentration increase was normalized to the plot area and time. Time intervals be-tween the three samples were varied from 5 min to 50 min in order to find the optimum sampling time. In most of the cases 10 min was found to be the best compromise. An
25
example of the increase in concentration in the chamber can be seen in Fig. 1. If the linearity of the concentration increase was poor (correlation coefficient (R2) between concentrations and time less than 0.8), results were not used in flux calculations. Be-cause of too long sampling interval of some of the samples in the beginning of the
BGD
2, 1795–1814, 2005Boreal wetland and forest floor VOC
emissions
H. Hell ´en et al.
Title Page Abstract Introduction Conclusions References Tables Figures J I J I Back Close
Full Screen / Esc
Print Version Interactive Discussion
EGU measurement period in 2004, emissions had to be calculated by using only first two
samples in these cases.
Some of the VOCs, such as monoterpenes, are very reactive towards ozone, which can pose problems in the emission measurements. However, in the studies of Janson et al. (1999) ozone has been found to disappear by dry deposition within 1 min after
5
the closure of a Teflon chamber. Therefore even though any ozone removal techniques were not used in this study, ozone should not be a problem. In 2005 comparisons with a dynamic chamber system, where ozone was removed with MnO2coated copper nets, were conducted. VOC emissions measured by these two systems were at same level and this gave more confirmation that ozone was not a problem in static chamber
10
measurements.
Air temperature in the chambers was observed to increase during the closure. In the studies in Ireland Dimmer et al. (2001) measured increases of air temperature in the chambers from 5◦C to 15◦C, but the maximum increase in soil temperature at 10 cm depth was only 0.2◦C. In our study the increase of air temperature was found to be
15
significant (>2◦C) only on sunny and warm days. As the summer 2004 was exceptional cold and rainy this was not a serious problem in most of the measurements in this study. VOC samples from the chambers were taken using Tenax TA-Carbopack B ad-sorbent tubes and 0.85 L stainless steel canisters. From the adad-sorbent tubes C5 -C10 hydrocarbons (alkanes, alkenes, aromatic HC’s, and terpenes) and some
halo-20
genated hydrocarbons (1,2-dichloroethane, chloroform, 1,1,1-trichloroethane, tetra-chloroethane, trichloroethene, tetrachloroethene) were analysed using a Perkin Elmer ATD-400 thermal desorption unit together with a gas chromatograph (HP-5890) with an HP-1 column (60 m, i.d. 0.25 mm) and a mass spectrometer (HP-5972). In 2004 sam-ples were analysed in SCAN mode but in 2005 more sensitive SIM (selective ion
mon-25
itoring) mode was used. Therefore detection limits in 2005 were lower than in 2004. Lighter C2-C6 and halogenated hydrocarbons were analysed from canisters using a gas chromatograph (HP-6890) with Al2O3/KCl PLOT column. After the column, sam-ple flow was split into two different detectors; C2-C7hydrocarbons were detected using
BGD
2, 1795–1814, 2005Boreal wetland and forest floor VOC
emissions
H. Hell ´en et al.
Title Page Abstract Introduction Conclusions References Tables Figures J I J I Back Close
Full Screen / Esc
Print Version Interactive Discussion
EGU a flame ionization detector (FID) and halogenated hydrocarbons (chloromethane,
CFC-12, CFC-11 and CFC-113) with an electron capture detector (ECD). Before the analysis water and CO2 were removed using a K2CO3/NaOH-drier. Subsequently the sample (ca. 500 ml) was concentrated using two liquid nitrogen traps. For adsorbent samples five-point calibration was performed using liquid standards in methanol solution. For
5
canister samples gas-phase standards from NPL (National Physical Laboratory, UK) for hydrocarbons and from NOAA (National Oceanic and Atmospheric Administration, USA) for halogenated hydrocarbons were used. A blank test was conducted by cov-ering a frame with Teflon film. No production or degradation of measured compounds was detected.
10
3. Results
3.1. Wetland emissions
Main non-methane hydrocarbon emitted by the wetland was isoprene. However, also small emissions of ethene, propane, propene, butane 1-butene, 2-methylpropene, pen-tane and hexane were detected (Table 1). Summer 2004 was very rainy and cold in
15
Siikaneva and the measured emission rates were relatively low, the highest measured emission rate being 53 µg m−2h−1. In 2005, when measurements were conduced only on one warm and sunny day, emission rates varied between 50 and 103 µg m−2h−1.
Isoprene emissions from the vegetation are light and temperature dependent. This dependence can be described by algorithms presented by Guenther et al. (1993) and
20
Guenther (1997). Standard emission potential, obtained by linear fitting of emission rates to the light and temperature activity factors (CT·CL) of the isoprene emission al-gorithm, was 224 µg m−2h−1 (Fig. 2). Coefficient of correlation between measured emission rates and light and temperature activity factor (CT·CL) of Guenther algorithm was 0.69 (Fig. 2). While temperature and PAR can explain much of the variation also
25
con-BGD
2, 1795–1814, 2005Boreal wetland and forest floor VOC
emissions
H. Hell ´en et al.
Title Page Abstract Introduction Conclusions References Tables Figures J I J I Back Close
Full Screen / Esc
Print Version Interactive Discussion
EGU tent may explain part of the variation (Janson and De Serves, 1998). Standard (T=30◦C
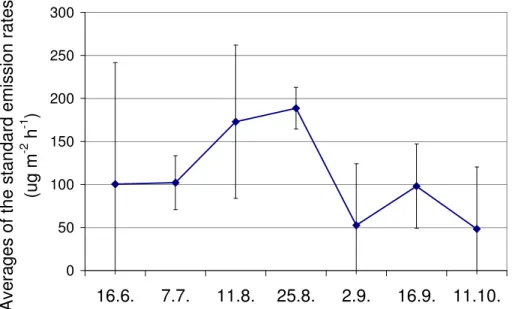
and PAR=1000 µmol m−2s−1) emission potentials of isoprene were calculated for each measurement separately using the isoprene emission algorithm. Daily average values are shown in Fig. 3. The results indicate that highest standard emission potentials are measured in August. However, more measurements are needed to verify this
conclu-5
sion.
In a VOC flux study by the REA technique on Siikaneva in 2004 and 2005, the average standard emission potential of isoprene was found to be 680 µg m−2h−1 (panala et al., 2005) which is several time higher than found in this study. However, Haa-panala et al. (2005) observed that for low CT·CLvalues (<0.2), the emission potential
10
was lower, only 330 µg m−2h−1. This value is closer to the emission potential obtained this study, in which the CT·CL values were low. Other possible reason for differences in the measured emissions is that the REA technique measures flux from much larger area than the chamber technique. However, using the chamber technique Janson and De Serves (1998) found also higher emission potentials (700±400 µg m−2h−1) from the
15
Sphagnum fens in Sweden and Finland in June–August 1997, but their measurements
were also conducted in warm and sunny conditions.
No clear emissions of monoterpenes, aromatic hydrocarbons or other larger volatile organic compounds (>C5) were detected although Rinnan et al. (2004) found emission of 45 different C4-C10volatile organic compounds including aromatic hydrocarbons and
20
monoterpenes from microcosms taken from a Finnish wetland. However, they did not quantify the emissions and raised a question concerning possible contamination of the microcosms during transportation.
Despite of a special effort, no emissions of halogenated hydrocarbons were de-tected. In the studies of Dimmer et al. (2001) significant emissions of CH3Cl, CH3Br,
25
CH3I and CHCl3were found to be emitted from wetlands and forest floor in Ireland and Varner et al. (1999) have reported emissions of CH3Cl and CH3Br from two wetlands in Northeastern Unites States, both dominated by Sphagnum and Carex species.
BGD
2, 1795–1814, 2005Boreal wetland and forest floor VOC
emissions
H. Hell ´en et al.
Title Page Abstract Introduction Conclusions References Tables Figures J I J I Back Close
Full Screen / Esc
Print Version Interactive Discussion
EGU the plots. This did not change the magnitude of the emissions. Standard emission
potential of isoprene from the plot containing only mosses was 127 µg m−2h−1, which is at the same level as the average value of all the plots 224 µg m−2h−1. From the plot where both green mosses and sedges were removed, almost no emissions were detected (emission potential <1 µg m−2h−1). This indicates that the Sphagnum moss
5
is the main source of the isoprene emitted by the fen. 3.2. Forest floor emissions
Highest emissions from forest floor were measured in spring and autumn. Main emitted compounds were monoterpenes (Table 1). Isoprene emissions were small compared to the emissions from Siikaneva fen. Highest monoterpene emissions were measured
10
in spring after the snow had melted (Fig. 3). Emissions dropped in the summer and increased again in autumn. The sum of the measured monoterpene emission rates varied from below the detection limit to 373 µg m−2h−1. The most abundantly emit-ted monoterpene was α-pinene followed by∆3-carene, camphene, limonene and β-pinene. Emissions were found to increase in autumn also in the study by Janson
15
et al. (1993), conducted in a Scots pine forests in Sweden. In those measurements emission rates varied between 2.6 and 232 µg m−2h−1. In the study by Hayward et al. (2001) average monoterpene emissions from the soil of a Sitka spruce forest in UK was 34 µg m−2h−1. The measurements of Hayward et al. (2001) were conducted in the middle of summer, which may explain the relatively low monoterpene emissions as the
20
emission rates were observed to be lower in the middle of the summer also in Hyyti ¨al ¨a. In Hyyti ¨al ¨a, forest floor emissions were not found to be temperature dependent as in a Sitka spruce forest in UK, where measurements were conducted on three summer days (Hayward et al., 2001). Seasonal factors were observed to have greater effect here. However, daily or seasonal emissions might still be temperature dependent.
25
Warneke et al. (1999) suggested that the highest VOC emission rates by litter are observed at the beginning of autumn and in late spring. Based on the observed sea-sonal variation, the probable source of the emissions in Hyyti ¨al ¨a is decaying needle
BGD
2, 1795–1814, 2005Boreal wetland and forest floor VOC
emissions
H. Hell ´en et al.
Title Page Abstract Introduction Conclusions References Tables Figures J I J I Back Close
Full Screen / Esc
Print Version Interactive Discussion
EGU litter. There have been suggestions (Janson et al., 1993) that fine roots are a source
for forest floor emissions. However, in the experiments where emissions originating from different layers of the soil of a Sitka spruce forest in UK were determined by Hay-ward et al. (2001), the emissions were found to be originating from the surface litter. Subsurface parts of the trees were found to emit significant quantities of monoterpenes
5
only if disturbed, damaged or exposed to the atmosphere.
Forest floor emissions of terpenes were compared to the emissions of Scots pine canopy measured by Hakola et al. (2005) using branch chambers. The measured emissions were up-scaled to canopy by assuming a needle biomass density of 300 g(dw) m−2(Fig. 4). In summer Scots pine emissions were much higher than the
for-10
est floor emissions, but in spring and autumn they were at same level and sometimes even higher forest floor emission was observed. This implies that in spring and au-tumn monoterpenes emitted from the forest floor can be a significant source for these compounds into the atmosphere. Springtime emissions from the forest floor are quite high even when compared to the summertime emissions from the Scots pine canopy.
15
This is intriguing as terpenes are assumed to participate in the formation or growth processes of secondary organic aerosols and the maximum in new particle formation event frequency is observed during springtime in Northern European boreal regions (M ¨akel ¨a et al., 2000).
In 2005 when more sensitive SIM method was used to analyze the VOC samples,
20
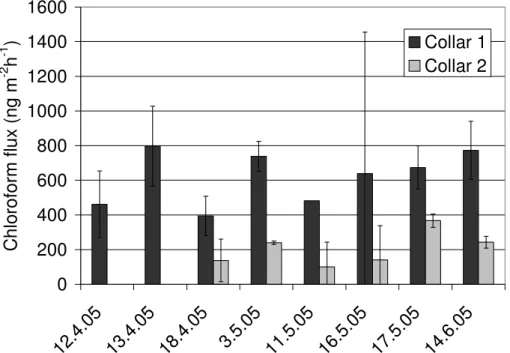
chloroform emission from forest floor was detected on all measurement days, as shown in Fig. 5, except for the collar 2 on the first two days, when the collar was still covered with snow. Daily average emission rates varied between 400 and 800 ng m−2h−1 for the collar 1 and between 100 and 370 ng m−2h−1 for the collar 2. Emissions started after the snow had melted in April and the emission rate remained at the same level
25
also in May and June. This implies that the main chloroform source is not the same as for the terpenes. There are lots of hypotheses on how the chloroform is formed in the soil. Both biotic and abiotic processes have been suggested (Laturnus et al., 2005). However, both formation and degradation processes of chloroform in forest soils and
BGD
2, 1795–1814, 2005Boreal wetland and forest floor VOC
emissions
H. Hell ´en et al.
Title Page Abstract Introduction Conclusions References Tables Figures J I J I Back Close
Full Screen / Esc
Print Version Interactive Discussion
EGU the role of the forest as a sink and/or source of chloroform are still unclear.
Hoekstra et al. (2001) found in their enclosure measurements in Netherlands that wood chip area and Douglas fir forest emit significant amounts of chloroform (up to 1000 ng m−2h−1), but pine forest soil emits only 18–19 ng m−2h−1. Much higher emis-sions were found in this study. Haselmann et al. (2000) studied soil air at different soil
5
layers at a Danish spruce forest site and the results indicated that main source of chlo-roform was biogenic formation in the upper soil layer. Flux calculated from the concen-tration gradients in the soil was 2.6–160 ng m−2h−1, which is lower than the emissions observed in Hyyti ¨al ¨a. Even by using this lower flux Haselmann et al. (2000) estimated that emissions from the northern temperate forests (4.9 Gg) may be an important
con-10
tributor to the atmospheric chloroform burden. However, Laturnus et al. (2002) esti-mated that northern temperate forests are only a minor source globally. By using the average emission rate measured in Hyyti ¨al ¨a (450 ng m−2h−1), and the area of boreal forests (1.6×10⁷km2) by Archibold (1995), the annual average emission from the bo-real forests would be 48 Gg (10–195 Gg). This is at the same range as the global
15
anthropogenic emissions, as estimated by Laturnus et al. (2002). Dimmer et al. (2001) measured halocarbon emissions from Irish peatland sites. Median of the measured chloroform emission rates was 525 ng m−2h−1. Emissions of chloroform have also been measured from the rice fields in China (Khalil et al., 1998), where seasonally averaged emissions varied from 600 to 4400 ng m−2h−1. In Irish peatland, emissions
20
were at the same level as in the Scots pine forest in this study and in rice fields emis-sions were little higher.
Difference in the emissions of chloroform between the two collars is quite high, even though they are spatially close to each other (25 m apart from each other). Substantial variations in chloroform and other halocarbon emissions between forest floor positions
25
located just a few meters apart have also been seen by Dimmer et al. (2001) and Hoekstra et al. (2001). Dimmer et al. (2001) explained the variations by the very local production of halocarbons by wood-rotting fungi and other microorganisms.
BGD
2, 1795–1814, 2005Boreal wetland and forest floor VOC
emissions
H. Hell ´en et al.
Title Page Abstract Introduction Conclusions References Tables Figures J I J I Back Close
Full Screen / Esc
Print Version Interactive Discussion
EGU when monoterpene emissions were highest some emissions of sesquiterpenes
(β-caryophyllene) were detected, with highest emission rates being 0.8 µg m−2h−2. In addition to the terpenes and chloroform also small emissions of ethene, propane, propene, 2-methylpropene, cis-2-butene, pentane, hexane and heptane were found (Table 1).
5
Snow covered forest floor did not emit significant amounts any of studied compounds. As shown in Table 1 only small emissions of propane, propene, 2-methylpropene, chlo-roform and monoterpenes were detected.
4. Conclusions
Isoprene is the dominant non-methane hydrocarbon emitted from the wetland growing
10
Sphagnum moss. Other compounds with detectable emissions were propane,
pen-tane, hexane, bupen-tane, ethene, propene, 1-butene and 2-methylpropene. No emissions of monoterpenes or halogenated hydrocarbons from the wetland were detected. The mean isoprene emission potential was 224 µg m−2h−1, with highest emission poten-tials measured in August. The emission potential obtained here is lower than the
emis-15
sion potentials published earlier and most likely at least partly caused by cloudy and cold weather during the measurements. The Sphagnum moss was found to be the main source of the isoprene from the wetland.
Highest VOC emissions from forest floor were measured in spring and autumn. Main emitted compounds were monoterpenes. Emission rate of the sum of monoterpenes
20
varied between 0 and 373 µg m−2h−1. The most abundantly emitted monoterpene was
α-pinene followed by∆3-carene, camphene, limonene and β-pinene. Isoprene emis-sions were small compared to the emission measured from Siikaneva fen. Compared to the monoterpene emissions from the Scots pine canopy, the forest floor was found to be a significant source of monoterpenes in spring and autumn.
25
In 2005 when more sensitive SIM method was used, chloroform emission was de-tected on all measurement days from forest floor. Emissions started after the snow
BGD
2, 1795–1814, 2005Boreal wetland and forest floor VOC
emissions
H. Hell ´en et al.
Title Page Abstract Introduction Conclusions References Tables Figures J I J I Back Close
Full Screen / Esc
Print Version Interactive Discussion
EGU had melted in April and the emission rate remained at same level also in May and
June. This implies that main chloroform source is not the same as for the terpenes. Small emissions (<2 µg m−2h−1) of ethene, propane, propene, 2-methylpropene, cis-2-butene, pentane, hexane and heptane from the forest floor were detected.
Acknowledgements. We acknowledge the financial support from Maj and Tor Nessling
Foun-5
dation and the Academy of Finland (project 209216). We thank T. Riutta for providing us with meteorological data.
References
Archibold, O. W.: Ecology of World Vegetation. Chapman & Hall, London, 510 pp., 1995. Dimmer, C. H., Simmonds, P. G., Nickless, G., and Bassford, M. R.: Biogenic fluxes of
10
halometanes from Irish peatland ecosystems, Atmos. Environ., 35, 321–330, 2001.
Guenther, A., Zimmerman, P. R., Harley, P. C., Monson, R. K., and Fall, R.: Isoprene and monoterpene emission rate variability: Model evaluations and sensitivity analyses, J. Geo-phys. Res., 98, 12 609–12 617, 1993.
Guenther, A.: Seasonal and spatial variations in natural volatile organic compound emissions,
15
Ecol. Appl., 7, 34–45, 1997.
Haapanala, S., Rinne, J., Pystynen, K.-H., Hell ´en, H., and Hakola, H.: Measurements of hydro-carbon emissions from a boreal fen using the REA technique, Biogeosciences Discuss., 2, 1645–1664, 2005,
SRef-ID: 1810-6285/bgd/2005-2-1645.
20
Hakola, H., Rinne, J., and Laurila T.: The hydrocarbon emission rates of Tea-leafed willow (Salix phylicifolia), Silver birch (Betula pendula) and European aspen (Populus termula), Atmos. Environ., 32, 1825–1833, 1998.
Hakola, H., Laurila, T., Lindfors, V., Hell ´en, H., Gaman A., and Rinne, J.: Variation of the VOC emission rates of birch species during the growing season, Boreal. Environ. Res., 6, 237–
25
249, 2001.
Hakola, H., Tarvainen, V., Laurila, T., Hiltunen, V., Hell ´en, H., and Keronen, P.: Seasonal vari-ation of VOC concentrvari-ations above a boreal coniferous forest, Atmos. Environ., 37, 1623– 1634, 2003.
BGD
2, 1795–1814, 2005Boreal wetland and forest floor VOC
emissions
H. Hell ´en et al.
Title Page Abstract Introduction Conclusions References Tables Figures J I J I Back Close
Full Screen / Esc
Print Version Interactive Discussion
EGU Hakola, H., Tarvainen, V., B ¨ack, J., Ranta, H., Bonn, B., Rinne, J., and Kulmala, M.: Seasonal
variation of mono- and sesquiterpene emission rates of Scots pine, Biogeosciences Discuss., 2, 1697–1717, 2005,
SRef-ID: 1810-6285/bgd/2005-2-1697.
Haselmann, K. F., Ketola, R. A., Laturnus, F., Lauritsen, F. R., and Gron, C.: Occurence and
5
formation of chloroform at Danish forest sites, Atmos. Environ., 34, 187–193, 2000.
Hayward, S., Muncey, R. J., James, A. E., Halsall, C. J., and Hewitt, C. N.: Monoterpene emissions from soil in Sitka spruce forest, Atmos. Environ., 35, 4081–4087, 2001.
Hoekstra, E. J., Duyzer, J. H., Leer, E. W. B., and Brinkman, U. A. T.: Chloroform-concetration gradients in soil air and atmospheric air, and emission fluxes from soil, Atmos. Environ., 35,
10
61–70, 2001.
Isidorov, V. A., Vinogorova, V. T., and Rafalowski, K.: HP-SPME analysis of volatile organic compounds of coniferous needle litter, Atmos. Environ., 37, 4645–4650, 2003.
Isidorov, V. A., Vinogorova, V. T., and Rafalowski, K.: Gas Chromatographic Determination of Extractable Compounds and Emission Rate of Volatile Terpenes from Larch Needle Litter, J.
15
Atmos. Chem., 50, 263–278, 2005.
Janson, R.: Monoterpene emissions from Scots Pine and Norwegian Spruce, J. Geophys. Res., 98, 2839–2850, 1993.
Janson, R. and De Serves, C.: Isoprene emissions from boreal wetlands in Scandinavia, J. Geophys. Res., 103, 25 513–25 517, 1998.
20
Janson, R., De Serves, C., and Romero, R.: Emission of isoprene and carbonyl compounds from a boreal forest and wetland in Sweden, Agricultural and Forest Meteorology, 98–99, 671–681, 1999.
Janson, R. and De Serves, C.: Acetone and monoterpene emissions from the boreal forest in northern Europe, Atmos. Environ., 35, 4629–4637, 2001.
25
Khalil, M. A. K., Rasmussen, R. A., Shearer, M. J., Chen, Z.-L., Yao, H., and Yang, J.: Emissions of methane, nitrous oxide and other trace gases from rice fields in China, J. Geophys. Res., 103, 25 241–25 250, 1998.
Laturnus, F., Haselmann, K. F., Borch, T., and Gron, C.: Terrestial natural sources of trichloromethane (chloroform, CHCl3) – an overview, Biogeochemistry, 60, 121–139, 2002.
30
Laturnus, F., Fahimi, I., Gryndler, M., Hartmann, A., Heal, M. R., Matucha, M., Sch ¨oler, H. F., Schroll, R., and Svensson, T.: Natural formation and degration of chloroacetic acids and volatile organochlorides in forest soil, Environ. Sci. & Pollut. Res. (OnlineFirst), 1–12, 2005.
BGD
2, 1795–1814, 2005Boreal wetland and forest floor VOC
emissions
H. Hell ´en et al.
Title Page Abstract Introduction Conclusions References Tables Figures J I J I Back Close
Full Screen / Esc
Print Version Interactive Discussion
EGU M ¨akel ¨a, J. M., Dal Maso, M., Pirjola, L., Keronen, P., Laakso, L., Kulmala, M., and Laaksonen,
A.: Characteristics of the atmospheric particle formation events observed at a boreal forest site in southern Finland, Boreal Environ. Res., 5, 299–313, 2000.
Rhew, R. C., Miller, B. R., and Weiss, R. F.: Natural methyl bromide and methyl chloride emis-sions from coastal salt marshes, Nature, 403, 292–295, 2000.
5
Rinnan, R., Rinnan, ˚A., Holopainen, T., Holopainen, J. K., and Pasanen, P.: Emission of non-methane volatile organic compounds (VOCs) from boreal peatland microcosms-effects of ozone exposure, Atmos. Environ., 39, 921–930, 2004.
Rinne, J., Hakola, H., Laurila, T., and Rannik, ¨U.: Canopy scale monoterpene emissions of Pinus sylvestris dominated forests, Atmos. Environ., 34, 1099–1107, 2000.
10
Tarvainen, V., Hakola, H., Hell ´en, H., B ¨ack, J., Hari, P., Kulmala, M.: Temperature and light dependence of the VOC emissions of Scots pine, Atmos. Chem. Phys., 5, 989–998, 2005,
SRef-ID: 1680-7324/acp/2005-5-989.
Varner, R. K., Crill, P. M., and Talbot, R. W.: Wetlands: a potentially significant source of atmo-spheric methyl bromide and methyl chloride, Geophys. Res. Lett., 26, 2433–2436, 1999.
15
Warneke, C., Karl, T., Judmaier, H., Hansel, A., Jordan, A., Lindinger, W., and Crutzen, P. J.: Acetone, methanol and other partially oxidized volatile organic emissions from dead plant matter by abiological processes: Significance for atmospheric HOx chemistry, Glob. Bio-geochem. Cycl., 13, 9–17, 1999.
BGD
2, 1795–1814, 2005Boreal wetland and forest floor VOC
emissions
H. Hell ´en et al.
Title Page Abstract Introduction Conclusions References Tables Figures J I J I Back Close
Full Screen / Esc
Print Version Interactive Discussion
EGU
Table 1. Measured emission rates on Siikaneva fen and forest floor in Hyyti ¨al ¨a in spring,
summer and autumn of 2004.
Wetland Snow Forest floor Forest floor (µg m−2h−1) Siikaneva-04 Hyyti ¨al ¨a-04 Hyyti ¨al ¨a-04 Hyyti ¨al ¨a-05
Ethene 0–1.7 n.d. 0–1.8 – Propane 0–0.42 0–0.06 0–1.0 – Propene 0–0.37 0–0.06 0–0.5 – 1-butene 0–0.18 n.d. n.d. – 2-methylpropene 0–0.25 0–0.04 0–0.09 – cis-2-butene n.d. n.d. 0–0.05 – Pentane 0–0.43 n.d. 0–0.4 – Butane 0–0.13 n.d. n.d. – Hexane 0–0.11 n.d. 0.04 – Isoprene 1.3–53 n.d. 0–1.9 – Heptane n.d. n.d. 0–0.17 – Chloroform n.d. 0.01–0.03 0–1.1 0–1.2 a-Pinene n.d. 0–0.09 0.07–161 0–123 Camphene n.d. 0–0.1 0–27.2 0–6.7 Sabinene n.d. n.d. 0–2.2 0–0.6 b-Pinene n.d. 0–0.02 0–16.8 0–2.4 3-Carene n.d. 0–0.03 0–152 0–51.8 Limonene n.d. n.d. 0–13.4 0–5.8 1,8-Cineol n.d. n.d. 0–2.3 n.d. β−Caryophyllene n.d. n.d. 0–0.80 0–0.1
BGD
2, 1795–1814, 2005Boreal wetland and forest floor VOC
emissions
H. Hell ´en et al.
Title Page Abstract Introduction Conclusions References Tables Figures J I J I Back Close
Full Screen / Esc
Print Version Interactive Discussion EGU
y = 3.42x - 3.10
R
2= 1.00
0
5
10
15
20
25
30
35
40
45
0
5
10
15
Time (min)
C
on
ce
nt
ra
tio
n
in
th
e
ch
am
be
r (
g
m
-3)
Fig. 1. Concentration change of isoprene in the chamber during a closure of the chamber on
BGD
2, 1795–1814, 2005Boreal wetland and forest floor VOC
emissions
H. Hell ´en et al.
Title Page Abstract Introduction Conclusions References Tables Figures J I J I Back Close
Full Screen / Esc
Print Version Interactive Discussion EGU y = 223.82x R2 = 0.69 0 20 40 60 80 100 120 0 0.05 0.1 0.15 0.2 0.25 0.3
Light and temperature activity factor (CL*CT)
Is op re ne fl ux ( g m -2 h -1 )
BGD
2, 1795–1814, 2005Boreal wetland and forest floor VOC
emissions
H. Hell ´en et al.
Title Page Abstract Introduction Conclusions References Tables Figures J I J I Back Close
Full Screen / Esc
Print Version Interactive Discussion EGU 0 50 100 150 200 250 300 16.6. 7.7. 11.8. 25.8. 2.9. 16.9. 11.10. A ve ra ge s of th e st an da rd e m is si on ra te s (u g m -2 h -1 )
Fig. 3. Standard (30◦C and 1000 µmol m−2h−1) emission potentials of the isoprene on Si-ikaneva fen in 2004. (Error bars=2× standard error of mean).
BGD
2, 1795–1814, 2005Boreal wetland and forest floor VOC
emissions
H. Hell ´en et al.
Title Page Abstract Introduction Conclusions References Tables Figures J I J I Back Close
Full Screen / Esc
Print Version Interactive Discussion EGU 2004 0 50 100 150 200 250 300 350 400 450 500 19.4. 4.5. 19.5. 8.7. 2.9. 16.9. 11.10. 21.10. Fl ux ( g m -2 h -1 ) Forest floor Scots pine n.a. 2005 0 50 100 150 200 250 12.4. 13.4. 18.4. 3.5. 11.5. 16.5. 17.5. 14.6. Fl ux (u g m -2 h -1 ) Forest floor Scots pine
n.a. n.a. n.a.<DLn.a. n.a.
Fig. 4. Sum of the measured emission rates of the terpenes from the forest floor and Scots pine
(for biomass density 300 g m−2) in Hyyti ¨al ¨a in 2004 and 2005. Data for Scots pine emissions on 16 September in 2004 was missing and in 2005 data was available only for 13 and 18 April
BGD
2, 1795–1814, 2005Boreal wetland and forest floor VOC
emissions
H. Hell ´en et al.
Title Page Abstract Introduction Conclusions References Tables Figures J I J I Back Close
Full Screen / Esc
Print Version Interactive Discussion EGU
0
200
400
600
800
1000
1200
1400
1600
12
.4.
05
13
.4.
05
18
.4.
05
3.5
.05
11
.5.
05
16
.5.
05
17
.5.
05
14
.6.
05
C
hl
or
of
or
m
fl
ux
(n
g
m
-2h
-1)
Collar 1
Collar 2
Fig. 5. Average and standard deviation of the measured emission rates of chloroform on di
ffer-ent days from two different collars from the forest floor in Hyyti¨al¨a in 2005. On 12 and 13 April collar 2 was still covered with snow and no emissions were detected.