HAL Id: hal-00298051
https://hal.archives-ouvertes.fr/hal-00298051
Submitted on 19 Sep 2006
HAL is a multi-disciplinary open access
archive for the deposit and dissemination of
sci-entific research documents, whether they are
pub-lished or not. The documents may come from
teaching and research institutions in France or
abroad, or from public or private research centers.
L’archive ouverte pluridisciplinaire HAL, est
destinée au dépôt et à la diffusion de documents
scientifiques de niveau recherche, publiés ou non,
émanant des établissements d’enseignement et de
recherche français ou étrangers, des laboratoires
publics ou privés.
H. Goosse, Olivier Arzel, J. Luterbacher, M. E. Mann, H. Renssen, N.
Riedwyl, A. Timmermann, E. Xoplaki, H. Wanner
To cite this version:
H. Goosse, Olivier Arzel, J. Luterbacher, M. E. Mann, H. Renssen, et al.. The origin of the European
”Medieval Warm Period”. Climate of the Past, European Geosciences Union (EGU), 2006, 2 (2),
pp.99-113. �hal-00298051�
Clim. Past, 2, 99–113, 2006 www.clim-past.net/2/99/2006/
© Author(s) 2006. This work is licensed under a Creative Commons License.
Climate
of the Past
The origin of the European “Medieval Warm Period”
∗
H. Goosse1, O. Arzel1, J. Luterbacher2, M. E. Mann3, H. Renssen4, N. Riedwyl2, A. Timmermann5, E. Xoplaki2, and
H. Wanner2
1Institut d’Astronomie et de G´eophysique G. Lemaˆıtre, Universit´e catholique de Louvain, 2 Chemin du Cyclotron, 1348
Louvain-la-Neuve, Belgium
2Institute of Geography, Climatology and Meteorology and NCCR Climate, University of Bern, Hallerstrasse 12, 3012 Bern,
Switzerland
3Department of Meteorology and Earth and Environmental Systems Institute (EESI), Pennsylvania State University,
University Park, PA16 802-5013, USA
4Faculty of Earth and Life Sciences, Vrije Universiteit Amsterdam, De Boelelaan 1085, 1081 HV Amsterdam, The
Netherlands
5IPRC, SOEST, University of Hawaii, 2525 Correa Road, Honolulu, HI 96 822, USA
∗Invited contribution by H. Goosse, one of the EGU Outstanding Young Scientist Award winners 2005
Received: 24 April 2006 – Published in Clim. Past Discuss.: 21 June 2006
Revised: 12 September 2006 – Accepted: 18 September 2006 – Published: 19 September 2006
Abstract. Proxy records and results of a three dimensional
climate model show that European summer temperatures roughly a millennium ago were comparable to those of the last 25 years of the 20th century, supporting the existence of a summer “Medieval Warm Period” in Europe. Those two rel-atively mild periods were separated by a rather cold era, often referred to as the “Little Ice Age”. Our modelling results sug-gest that the warm summer conditions during the early sec-ond millennium compared to the climate background state of the 13th–18th century are due to a large extent to the long term cooling induced by changes in land-use in Europe. During the last 200 years, the effect of increasing green-house gas concentrations, which was partly levelled off by that of sulphate aerosols, has dominated the climate history over Europe in summer. This induces a clear warming dur-ing the last 200 years, allowdur-ing summer temperature durdur-ing the last 25 years to reach back the values simulated for the early second millennium. Volcanic and solar forcing plays a weaker role in this comparison between the last 25 years of the 20th century and the early second millennium. Our hypothesis appears consistent with proxy records but mod-elling results have to be weighted against the existing uncer-tainties in the external forcing factors, in particular related to land-use changes, and against the uncertainty of the regional climate sensitivity. Evidence for winter is more equivocal than for summer. The forced response in the model displays
Correspondence to: H. Goosse
(hgs@astr.ucl.ac.be)
a clear temperature maximum at the end of the 20th century. However, the uncertainties are too large to state that this pe-riod is the warmest of the past millennium in Europe during winter.
1 Introduction
The analysis of climate variations during the past millen-nium can help to establish whether or not late 20th century warmth is unusual in a long-term context. Such an analy-sis can, in turn, help inform any determination of the rel-ative roles of human activities and natural processes to the recent observed warming (e.g., Stott et al., 2000; Hegerl et al., 2003). At the Northern Hemisphere scale, the available annual mean temperature reconstructions reveal that the last decade of the 20th century has been likely the warmest period of the past thousand years (Jones and Mann, 2004; Moberg et al., 2005; Osborn and Briffa, 2006). The increase of at-mospheric greenhouse gas concentrations over the past two centuries appears to have played an essential role in this re-cent warming (Tett et al. 1999; Stott et al., 2000; Hegerl et al., 2003).
Roughly one thousand years ago, some regions such as Europe, may also have exhibited relatively mild conditions, although the geographical extent of the warm conditions dur-ing this period was smaller than durdur-ing the 20th century (Lamb, 1965; Hughes and Diaz, 1994; Pfister et al., 1998;
Bradley et al., 2003; Osborn and Briffa, 2006). This has led to the introduction of the term “Medieval Warm Period” or “Medieval Warm Epoch”, which originated from the exam-ination of primarily western European documentary proxy evidence (Lamb, 1965). The underlying cause for this appar-ent warm period in Europe has remained unclear. Further-more, as it preceded the modern rise in anthropogenic green-house gas concentrations, the existence of such a past period of warmth provides a classical counterargument against an-thropogenic impacts on modern climate change. In this con-text, the goal of the present study is to describe a plausible explanation of the causes of those particular conditions that likely occurred in Europe at the beginning of the second mil-lennium.
In a larger framework, it is also important to analyze past temperature variations at the regional scale (e.g., European region) because many human activities, human health, phe-nological aspects and climate extremes are not influenced by hemispheric-scale, annual mean temperature but by the regional variations during the various seasons (Berger and McMichael, 1999; Luterbacher et al., 2004; Thomas et al., 2004; Xoplaki et al., 2005; Casty et al., 2005). Analyses at regional scales are often hampered by the paucity of available data, and by a high degree of spatial and temporal variability which tends to obscure any underlying climate change sig-nal. However, recent continental-scale seasonal multi-proxy-based climate reconstructions spanning the past centuries have been performed (Luterbacher et al., 2004; Xoplaki et al., 2005; Guiot et al., 2005; Pauling et al., 2006). Moreover, simulations of European-scale temperature change can now be obtained using climate models driven by estimated past radiative forcing changes. Those simulations still have clear limitations because of the relatively coarse resolution used and of the uncertainties on past changes in external forcing as well as in the internal climate sensitivity. Nevertheless, the analysis of those simulations provides a very useful pos-sibility to examine the causes of past seasonal temperature changes in Europe, including the enigmatic European “Me-dieval Warm Period” of roughly one thousand years ago.
While climate reconstructions are required for an estima-tion of the level of past climate variability, they can not be used directly to assess the physical causes of the recorded temperature variations. For this purpose, climate model sim-ulations that are forced by estimates of past natural and an-thropogenic radiative perturbations may be used. Therefore, we apply here the ECBILT-CLIO-VECODE global climate model of intermediate complexity to identify the causes of European climate change over the past millennium. A brief description of the model and forcing is provided in Sect. 2. In addition to the classical model-data comparison, we also use the technique recently proposed by Goosse et al. (2006) to obtain an estimate of the state of the climate system that is compatible with the real observed changes as well as with model physics and forcing in Sect. 3. Section 4 is devoted to a description of the climate of the past millennium over
Europe while Sect. 5 investigates the causes of the simulated changes. In Sect. 6, the regional distribution of the signal is analysed, before the conclusions.
2 Model and forcing description
The version of the model ECBILT-CLIO-VECODE used here is identical to the one used in some recent studies (Goosse et al., 2005a, b, 2006; Renssen et al., 2005), but a brief description is given here for the reader’s convenience. The atmospheric component is ECBILT2 (Opsteegh et al., 1998), a quasi-geostrophic model with a resolution of 5.6 degree in latitude, 5.6 degree in longitude and 3 level in the vertical. To close the momentum budget near the equator, a parameterization of the ageostophic terms is included. The oceanic component is CLIO3 (Goosse and Fichefet, 1999) that is made up of an ocean general circulation model cou-pled to a comprehensive thermodynamic-dynamic sea ice model. ECBILT-CLIO is coupled to VECODE, a dynamic global vegetation model that simulates dynamics of two main terrestrial plant functional types, trees and grasses, as well as desert (Brovkin et al., 2002). More information about the model and a complete list of references is available at http://www.knmi.nl/onderzk/CKO/ecbilt-papers.html.
We have performed a total of 125 simulations with the model driven by both natural and anthropogenic forcings (Fig. 1 and Table 1). An existing ensemble of 115 simu-lations (Goosse et al., 2005b, 2006), covering at least the period 1001 AD-2000AD, is first presented (35 simulations starting in 1 AD, 30 starting in 851 AD and 50 starting in 1001 AD). The forcing due to long-term changes in orbital parameters follows Berger (1978) and the observed evolu-tion of greenhouse gases is imposed over the whole simu-lated period. Furthermore, the influence of sulphate aerosols due to anthropogenic activity is taken into account during the period 1850–2000 AD through a modification of surface albedo (Charlson et al., 1991). In ECBILT-CLIO-VECODE, we only take into account the direct effect of aerosols. This forcing is thus probably underestimated, but given the uncer-tainty in the indirect aerosol forcing it is difficult to quantify the magnitude of this underestimation. In addition, the forc-ing due to changes in land-use is applied here through modi-fications in the surface albedo, which is the primary effect of land cover change (Matthews et al., 2004). Furthermore, the evolution of solar irradiance and the effect of volcanism are prescribed using different combinations of the available re-constructions, in order to include the uncertainties associated with those forcings (Table 1). The ensemble members dif-fer only in their initial conditions which were extracted from previous experiments covering the past millennia. The dif-ferent initial conditions represent climate states separated by 150 years. Due to the fact that each of the ensemble mem-bers generates an independent realization of internal climate variability, computing the ensemble mean filters out internal
H. Goosse et al.: The origin of the European “Medieval Warm Period” 101
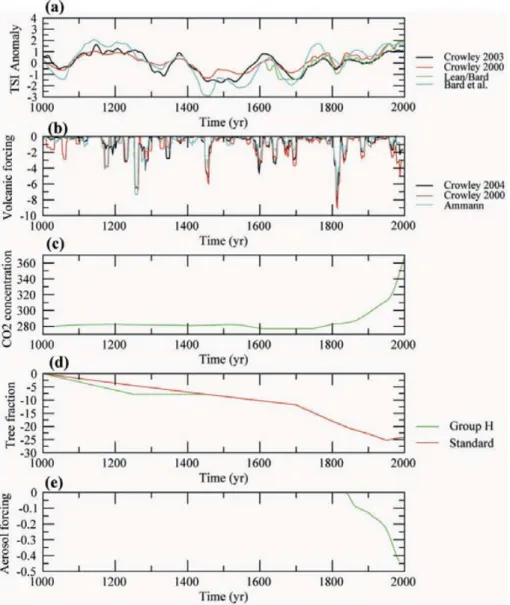
Fig. 1. (a) Time variations of solar irradiance (W/m2) at the top of the atmosphere following the reconstructions of Lean et al. (1995) (green),
Bard et al. (2000), (turquoise), Crowley (2003) (black) and Crowley (2000) (red). (b) Time variations of volcanic forcing (W/m2) scaled as an effective change in solar irradiance for comparison with (a), following the reconstructions of Crowley (2000) (red), Crowley(2003) (black) and Ammann (as described in Jones and Mann (2004), turquoise). (c) Time variations CO2 concentration (in ppmv) imposed in our simulation. The time variations of the other greenhouse gases used in the model are not shown here. (d) Decrease in the fraction of the surface occupied by forest (in %) averaged over Europe imposed in the simulations as a result of land-use change. The red line corresponds to the scenario used in all the experiments except those of group H (green line). (e) Annual mean forcing at the top of the atmosphere (W/m2) caused by the increase in aerosol load. A 10-year running mean has been applied to the time series in order to highlight low frequency variations.
variability and leaves the joint response to the external forc-ing. (See Goosse et al., 2005b, for more details as well as for a discussion of the impact of the choice of the reconstruction of the solar and volcanic forcing on global surface tempera-ture).
The past evolution of land use is not precisely known and, to our knowledge, comprehensive reconstructions of crop area are only available back to 1700 AD for Europe (Ra-mankutty and Foley, 1999; Goldewijk, 2001). In the 115
simulations described above, we follow for the earlier pe-riod the scenario used in a recent intercomparison exercise (Brovkin et al., 2006) that is based on Ramankutty and Fo-ley (1999) and assumes a linear increase of crop area from zero in 1000 AD to the value reconstructed for 1700 AD. This is of course a strong simplification. In particular, it is well known that, in a large number of regions of France, Belgium, Netherlands, Germany, which are among the ropean countries where the largest changes occurred in
Eu-Table 1. Description of the experiments (updated from Goosse et al., 2005b).
Number of experiments Symbol of the group Starting date Forcing Solar Volcanic
25 K 1000 AD Lean et al. (1995)/Bard et al. (2000)1
Crowley (2000)
25 C 1000 AD Crowley (2000) Crowley (2000) 35 D 1 AD Crowley at al. (2003) Crowley at al. (2003) 15 B 850 AD Lean et al. (1995)/Bard et
al. (2000)1
Crowley at al. (2003)
15 M 850 AD Bard et al. (2000)1 Amman (cited in Jones and Mann, 2004)
10 H2 1 AD Crowley at al. (2003) Crowley at al. (2003)
1We are using the reconstruction of Bard et al. (2000) scaled to match the Maunder Minimum irradiance reduction derived by Lean et
al. (1995).
2This new set of experiments uses the same solar and volcanic forcing as the one of group D but a different scenario for land-use changes
that implies a faster deforestation rate during the period 1000–1250 AD.
rope in pre-industrial times, deforestation was particularly intense between 1000 and 1250 AD and weaker during the two following centuries (Goudie, 1993; Simmons, 1996; Steurs, 2004; Guyotjeannin, 2005). In order to estimate the impact of those uncertainties in the timing of land-cover changes, we have tested here another simple scenario in a new ensemble of 10 experiments. The crop fraction increases first linearly during the period 1000–1250 AD, reaching in 1250 AD the value imposed in 1450 AD in the standard sce-nario (i.e., representing enhanced deforestation during the period 1000–1250 AD). It remains constant during the pe-riod 1250–1450 AD and then follows the standard scenario. In those experiments (hereafter referenced as group H, Ta-ble 1), the same solar and volcanic forcing are used as in ex-periments of group D. The comparison of the two ensembles provides thus a direct estimate of the impact of the uncer-tainties in past land-cover changes. As expected, in the new set of experiments, the ensemble mean temperature tends to be lower during the period 1000–1450 AD. The maximum of the difference occurs in summer, around 1300 AD and reaches 0.1◦C (Fig. 2).
Furthermore, in the framework of this study, additional en-sembles of experiments covering the period 1001–2000 AD are performed with ECBILT-CLIO-VECODE driven by only one forcing at a time in order to analyze the role of the var-ious forcing components. For each forcing, an ensemble of 10 experiments has been launched, corresponding thus to 60 new experiments. Here, the land use change forcing includes the so-called biogeophysical aspects, i.e. the one related to the changes in the physical characteristics of the surface. The biochemical part of the forcing, i.e. the changes in green-house gas concentration due to changes in land use, are taken into account in the run with greenhouse gas forcing since, as we do not have a carbon cycle model, it is not possible to
disentangle the contribution of deforestation from the other ones.
ECBILT-CLIO-VECODE has a relatively weak climate sensitivity, with a 1.8◦C increase in global mean tempera-ture in response to a doubling of atmospheric CO2
concen-tration. The global-mean response of the model to the forc-ing applied is thus generally in the lower range of the re-sponse that would be obtained by atmosphere-ocean general circulation models (AOGCMs) if they were forced by a sim-ilar forcing (Goosse et al., 2005b). This is to a large extent due to the very weak changes simulated in the tropical area while at mid-latitude the response ECBILT-CLIO-VECODE is close to the mean of AOGCMs (Selten, 2002; Petoukhov et al., 2005). Furthermore,the comparison of the results of ECBILT-CLIO-VECODE over the past millennium with var-ious proxy records has shown that the model is able to repro-duce the main characteristics of the reconstructed changes in the extra-tropics. Interestingly, the simulated variance over the last 500 years in Europe is very close to the one of the re-construction of (Luterbacher et al., 2004) for summer, winter as well as for annual mean (Goosse et al., 2005a).
3 Selection of the best pseudo simulation and estimation of related uncertainty
For the analyses of temperature changes over Europe and for model data comparison we use here two continental-scale reconstructions (Luterbacher et al., 2004; Guiot et al., 2005) as well as summer temperature reconstructions for the Low Countries (i.e. Belgium and Netherlands) (Van Enge-len et al., 2001; Shabalova and Van EngeEnge-len, 2003), the Czech Lands (Br´azdil, 1996), Western Russia (Klimenko et al., 2001), Fennoscandia (Briffa et al., 1992), Swiss alpine regions (B¨untgen et al., 2005) and Burgundy (Chuine et al.,
H. Goosse et al.: The origin of the European “Medieval Warm Period” 103
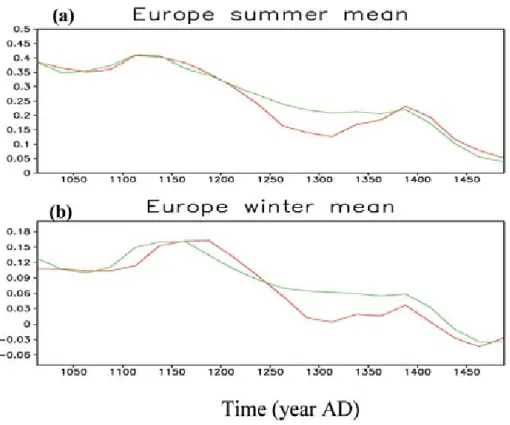
Fig. 2. Anomaly (in Kelvin) of the ensemble mean of (a) summer (JJA) and (b) winter (DJF) European temperatures averaged over the
simulations of group H (in red) and group D (in green). Those two groups of simulation only differ in the scenario used for land-use changes. The times series plotted are averages over 25 seasons.
2004) and winter temperature in the Low Countries (Van En-gelen et al., 2001; Shabalova and Van EnEn-gelen, 2003), the Czech Lands (Br`azdil, 1996), and Western Russia (Klimenko et al., 2001).
The difference between those reconstructions and an indi-vidual member of the ensemble of simulations could be due to a non-climatic signal recorded in the proxy as well as to uncertainties in the forcing or in the model formulation and to different realizations of the internal variability of the sys-tem in the model and in the real world. The latter source of discrepancy can be evaluated by plotting the range covered by all the simulations included in the ensemble (Goosse et al., 2005ab). If the reconstruction is out of this range during some periods, it means that no member of the ensemble is able to reproduce the reconstructed temperature anomaly. As a consequence, we must consider that the model and the re-construction disagree on the temperature anomalies for those periods. If the empirical reconstruction is in this range, this does not necessarily imply that the model results are valid since the agreement could occur for incorrect reasons, but it implies that at least some simulations are compatible with the reconstruction.
Moreover, it is possible to go a step forward as described by Goosse et al. (2006), who propose to select among the ensemble of simulations the one that is the closest to the
available reconstructions for a particular period (typically be-tween 1 and 50 years). This is achieved by choosing the sim-ulation that minimizes a cost function evaluated by comput-ing the weighted sum of the squares of the difference be-tween the value provided by the reconstruction and the sim-ulated value in the model grid box(es) that contains the lo-cation of the proxy-record. The cost function measures thus the misfit between model results and proxy records. If the cost function is sufficiently low, the selected simulation is compatible with the reconstruction, with model physics and with the forcing used for the particular period. For plotting purposes, it is then possible to group the various states se-lected for all the periods of interest in order to obtain the best “pseudo simulation”. Although the physical interpreta-tion of some low frequency changes could be difficult with this technique, it has been shown that it can be efficiently used to provide temperature changes averaged over regions where a sufficiently large number of proxy-record is avail-able (Goosse et al., 2006). It thus complementary to large-scale reconstructions obtained using statistical methods.
The applicability of this method has been assessed in Goosse et al. (2006) for test cases. Here, we apply it to European temperatures, using all the available information. In particular, this technique is used here to show first that it is possible to find one member of the ensemble that is
Fig. 3. Anomaly (in Kelvin) of (a) summer and (b) winter European temperatures in the 13 best “pseudo simulations” obtained by
constrain-ing the model results with all the 12 proxy records or usconstrain-ing all the subsets containconstrain-ing 11 proxy records. The times series plotted are averages over 25 seasons.
consistent with the proxy records for any period, second to reconstruct the temperature evolution averaged over Europe during the past millennium and third to provide an estimate of the contribution of internal variability in the observed changes.
In the present framework, the cost function will be evalu-ated using the reconstructions listed above. All the individ-ual reconstructions have the same weight in the evaluation of the cost function while reconstructions at the European scale have a weight 5 times stronger to take into account that they are derived from a compilation of a larger data set. As dis-cussed in Goosse et al. (2006), the results are not sensitive to the selection of those weights.
The selected proxy records provide a sufficiently dense network to give useful information at the European scale. This could be illustrated by performing a test in which only local and regional proxy records are used to constrain model results but not the large-scale reconstructions. In this case, the best pseudo-simulation, using 25-year averages, has a correlation with the reconstruction of Luterbacher et al. (2004) of 0.43 and 0.66 over the period 1500–2000 for summer and winter mean, respectively. Those values are similar or higher than the correlation of the individual prox-ies with local temperature during the last 150 years. They are also much higher than the correlation between Luterbacher et al. (2004) and individual members of the ensemble that have values of 0.15 and 0.41 for summer and winter mean,
respec-tively. This indicates that the technique is useful to get a bet-ter agreement between model results and the observed evolu-tion at European scale. Of course, when all the proxy records and reconstructions are used to evaluate the cost function, the correlation between the best pseudo-simulation and the re-construction of Luterbacher et al. (2004) is even higher, with values of 0.88, and 0.92 over the period 1500–2000 for sum-mer and winter mean, respectively, using 25-year averages. We would like to emphasise that the reconstruction of Luter-bacher et al. (2004) is not completely independent of the re-gional/local proxy used here as data from the Low Countries and partly from the Czech lands (only the non-continuous data from the 16th century and the winter of 1739/1740 have been used) were included in the large set of records used in Luterbacher et al. (2004). Nevertheless, additional sensitivity experiments have shown that if those records are not included in the analyses perform here, our conclusions concerning the validity of the method are not modified.
In order to estimate the uncertainties associated with the evaluation of the best simulation, we have repeated the pro-cedure used to obtain the best pseudo-simulation removing one proxy at a time in the computation of the cost func-tion (Fig. 3). This provides a total set of 13 alternative best pseudo-simulations. The standard deviation of these 13 time series reaches 0.11◦C in summer and 0.16◦C in winter at the beginning of the second millennium when the uncertainties in the proxies are large (i.e. 82% and 64% of the standard
H. Goosse et al.: The origin of the European “Medieval Warm Period” 105 deviation of the whole ensemble), while the value of this
standard deviation is at least a factor three smaller at the end of the simulations because of the better quality of the data. These values will be used when discussing the uncertainties associated to the best pseudo-simulation. The finite size of our ensemble of simulations could also lead to uncertainties in the selection of the best model state (Goosse et al., 2006). Nevertheless, the magnitude of this term is smaller than the one related to the choice of proxies illustrated above and will thus not be included in our discussions.
4 Climate of the past millennium averaged over Europe
European surface air temperatures have risen sharply dur-ing the second half of the 20th century, with a larger re-sponse in winter than in summer (Fig. 4) (Jones et al., 2003; Luterbacher et al., 2004). This induces a weakening of the seasonal range (defined as the difference between summer and winter temperatures) both in the model and in a land-area (25◦W to 40◦E and 35◦N to 70◦N) temperature re-construction (Luterbacher et al., 2004) covering the last 500 years. For the mean of the ensemble of 125 simulations, this decrease reaches 0.5◦C in Europe between 1800 and 2000 (Fig. 4c).
The ensemble mean summer and winter temperatures also display a long-term cooling trend from the beginning of the second millennium into the 19th century. Between 1000 and 1800 AD, the simulated cooling amounts to 0.3◦C in win-ter and 0.4◦C in summer. A recent reconstruction for Euro-pean summer (April–September mean) climate (Guiot et al., 2005), representing the area of 10◦W–20◦E, 35◦N–55◦N
for the period from 1100 AD to present day, is in the range of changes simulated within the ensemble of simulations. How-ever, in contrast to model results, this reconstruction reveals a relatively stable summer climate without any indications for anomalous medieval summer warmth (Fig. 4a). On the other hand, available independent European regional proxy data (Fig. 5) exhibit a clearer trend towards warmer summer and winter temperatures during the period 1000–1300 than during the period 1500–1850. As a consequence, the mean over all those long proxy records documents warm climate conditions in Europe around 1000 AD that were similar to those of the last decades of the 20th century.
When using all the continental scale and local/regional scale reconstructions to select the model states, the best pseudo-simulation is, as expected, very close to Luterbacher et al. (2004) for the last 500 years (Fig. 4) and agrees well at local/regional scale with the proxy records for the whole second millennium (Fig. 6). These proxy records and the best pseudo-simulation indicate thus relatively mild condi-tions in Europe during the beginning of the second millen-nium. However, for the period 1000–1300, the best pseudo-simulation provides an average over Europe that is larger than the one provided by Guiot et al. (2005). It should
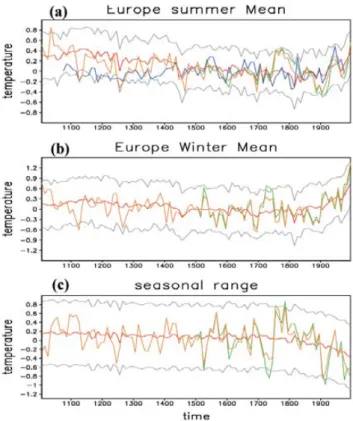
how-Fig. 4. Proxy-based reconstructions of European temperature anomaly (in Kelvin) during the period 1001–2000 AD compared with model results in (a) summer, (b) winter, and (c) the seasonal temperature range (summer minus winter). The time series plotted are averages over 10 seasons or years. The red line corresponds to the mean over the 125 simulations while the grey lines are the ensemble mean plus and minus two standard deviations of the en-semble at decadal scale. The reconstructions are in green (Luter-bacher et al., 2004) and blue (Guiot et al., 2005). The best pseudo simulation is represented by the orange line. The reference period is 1500–1980, i.e. the longest period common to all the reconstruc-tions.
ever be noted that the uncertainty of the reconstructions is particularly large during the early stages of the reconstruc-tions. In particular, the amount of documentary proxy in-formation (e.g. Pfister et al., 1998; Br´azdil et al., 2005) decreases back in time with larger associated uncertainties. Hence, an interpretation of these early records has to con-sider the relative uncertainty in terms of phase and amplitude.
5 Role of the forcings and internal variability
Additional experiments performed with ECBILT-CLIO-VECODE driven by only one forcing at a time are used to compare the simulated temperatures during three 25-year pe-riods: the late 20th century (the years 1976–2000), the be-ginning of the 19th century (the years 1801–1925), which is one of the coldest periods for the ensemble mean in Europe, and the beginning of the 11th century (the years 1026–1050),
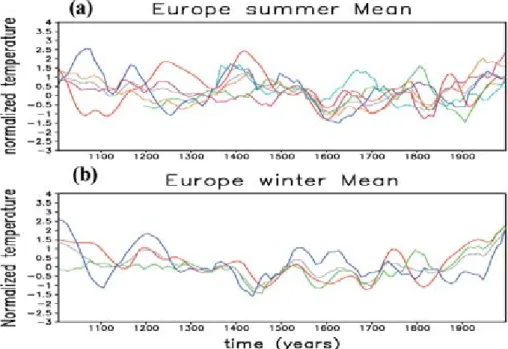
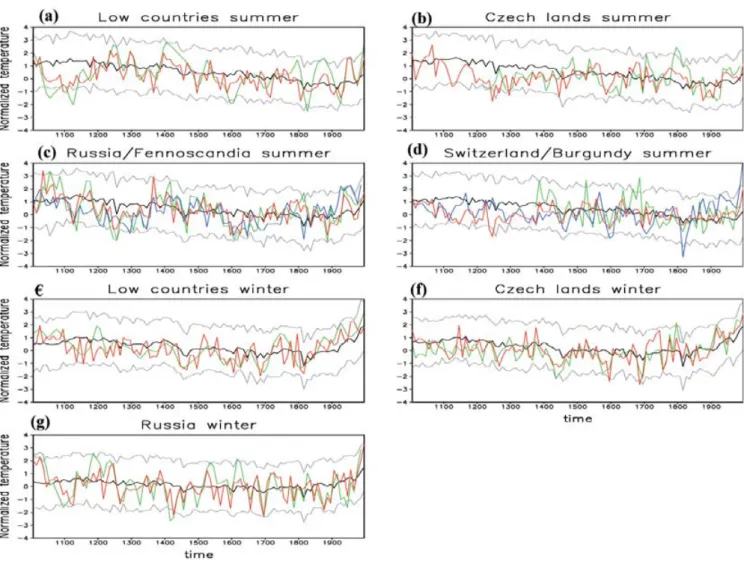
Fig. 5. Local and regional long proxy records of European seasonal temperatures (a) in summer and (b) in winter. The reference period is
1500–1980. Each proxy has been divided by its standard deviation. The time series plotted are averages over 10 seasons and, in addition, a five-point running mean is applied. In (a), the red, green, dark blue, light blue, pink and orange curves are related to temperature variations in the Low Countries (Belgium and Netherlands), Czech Lands, Western Russia, Burgundy, Swiss alpine area and Fennoscandia, respectively. In (b) the red, green and dark blue curves are related to temperature variation in the Low Countries (Belgium and Netherlands), Czech Lands and Western Russia respectively. The grey lines represent a mean over the records that go back to 1000 AD.
which is a relatively warm period (Fig. 7). This comparison reveals that, in ECBILT-CLIO-VECODE, the recent warm-ing is mainly due to the increase of atmospheric greenhouse gas concentrations, while sulphate aerosol forcing reduces the warming significantly, in good agreement with previ-ous modelling studies (Mitchell and Johns, 1997; Tett et al., 1999; Stott et al., 2000; Andreae et al., 2005). This cooling effect of the aerosols is larger in summer, as it mainly influ-ences the net solar flux at the surface (Mitchell and Johns, 1997). The late 20th century reduction of the annual cycle amplitude is thus mostly due to the reduced summer warming effect of the aerosols and the increased winter warming trig-gered by greenhouse gases and amplified by positive climate feedbacks, such as the snow-albedo feedback (e.g., Manabe et al., 1992).
When comparing the periods 1026–1050 and 1976–2000 (Fig. 7b) a third anthropogenic radiative forcing – land use change – plays a dominant role in our simulations. In-deed, because of the large-scale changes in land use that oc-curred in Europe, the simulated European temperature has decreased during the past millennium by 0.5◦C in summer and 0.4◦C in winter between the periods 1026–1050 and 1976–2000. As a consequence, the total effect of all anthro-pogenic forcings is slightly negative in summer (though not significant at the 90% level) while it reached 0.3◦C in winter in our simulations.
Solar and volcanic forcings have likely played a role in both global and regional changes observed during parts of the millennium (Robock, 2000; Shindell et al., 2001; Luter-bacher et al., 2004; Xoplaki et al., 2005; Wagner and Zorita, 2005; Raible et al., 2006). However, using the forcing se-lected here, they could not have caused the simulated tem-perature differences between 1976–2000 and 1026–1050, in particular because both periods display a relatively high so-lar irradiance. On the other hand, the period 1801–1825 is characterised by strong volcanic activity and a negative so-lar irradiance anomaly compared to 1976–2000 (Fig. 1). As a consequence, those two forcings have contributed to the lower temperature during the period 1801–1825 compared to 1976–2000. However, the magnitude of the response to those forcings is still much smaller than the one to the green-house forcing over the same period. Temperature anomalies caused by the solar and volcanic forcings also contribute, in addition to the effect of land use change, to the lower tem-perature in the model during the period 1801–1825 than dur-ing the period 1026–1050. Finally, on these timescales, the role of orbital forcing is weak for Europe in our simulations, although its effect could be significant at large scales for spe-cific months (Bauer and Claussen, 2006).
Except for the response associated with greenhouse gas forcing, the model’s internal variability (measured by the standard deviation of the ensemble around the ensemble
H. Goosse et al.: The origin of the European “Medieval Warm Period” 107
Fig. 6. Comparison of model results and proxy records in Europe during the period 1001–2000 AD. The times series plotted are averages
over 10 seasons. The reference period is 1500–1980 AD. Model results and proxy have been divided by their standard deviations. The black line corresponds to the mean over the 125 simulations while the grey lines are the ensemble mean plus and minus two standard deviations of the ensemble at decadal scale. Proxy records are in green and blue. Shown is the compilation of temperature in summer (a) for the Low Countries (Belgium and Netherlands), (b) the Czech Lands, (c) Western Russia in green and Fennoscandia in blue, (d) Swiss alpine regions in blue and Burgundy in green and in winter in (e), the Low Countries (Belgium and Netherlands), (f) the Czech Lands, and (g) Western Russia. The model states that are the closest to all the available proxies are represented by the red lines (i.e., the best pseudo simulation). Regions that are very close to each other like Western Russia/Fennoscandia and Swiss alpine Region/Burgundy are shown on the same panel.
mean) is of the same order of magnitude or larger than the response to individual forcing (Fig. 7). As a consequence, internal variability could be responsible to a large extent to the anomaly observed during some periods (e.g. Goosse et al,. 2005a; Hunt, 2006). Nevertheless, it is not the case in our simulations when comparing the summer temperatures of the years 1976–2000 and 1026–1050. These two periods must thus be considered as having similar simulated anoma-lies mainly because they exhibit nearly the same net radiative forcing.
In winter, the difference in the forced response between the periods 1976–2000 and 1026–1050 is larger than in sum-mer as it amounts to 1.0 standard deviation of the internal
en-semble variability. When using the available proxy records to derive the best pseudo-simulation, the estimated range is reduced by 36%. The difference between those two pe-riods reaches then 1.3 times the standard deviation of the best pseudo-simulation. This indicates that, in winter, due to the large warming during the 20th century, the simulated forced response of the system reached a clear maximum at the end of the second millennium. Nevertheless, based on our results, the uncertainty is still too large to reject at the 90% confidence level the null-hypothesis that European win-ter temperatures during the late 20th century were similar from those of the early second millennium. In other words, it is possible to obtain warmer simulated temperatures for the
Fig. 7. Identification of the various contributions to the difference between simulated temperatures (in Kelvin) for the period 1976–2000
and (a) the period 1801–1825 and (b) the period 1025–1050. The range associated with the contribution of internal variability is given by two standard deviations of the ensemble of simulations around the ensemble mean. The best estimate of the internal variability is evaluated as the difference between the best pseudo-simulation and the ensemble mean, using the uncertainty on this best pseudo-simulation. The contributions of the individual forcings are obtained by performing an ensemble of 10 experiments with only one of the 6 forcing studied. The error bar for those forcings is evaluated by computing two standard deviations of the difference between two 25-year periods in a long experiment without any change in external forcing, using an ensemble of 10 simulations. The ensemble mean, using the whole set of forcings, is presented at the right (Full). The response to orbital forcing is not displayed on this figure as we found no significant difference between the periods considered here in our simulations using only this forcing.
period 1026–1050 than in 1976–2000 while being in reason-able agreement with the proxy data used to constrain model results. We thus cannot reasonably state that, in Europe dur-ing winter, the period 1976–2000 is warmer than 1026–1050. On the other hand, compared to the early second millen-nium, the difference in forced signal between the early 19th century and the late 20th century is more pronounced, be-cause several forcings (i.e., greenhouse gas, volcanic and so-lar forcings) tend to induce a perturbation of the same sign and the land-use changes were smaller between the 19th and
20th centuries. For the 25-year mean, the difference in the ensemble mean is much larger than the internal variability of the model, reaching 2.1 and 2.5 standard deviations of the en-semble for summer and winter, respectively. This is in good agreement with recent studies that were able to detect the warming effect of increasing greenhouse gas concentrations during the twentieth century in Europe (Zwiers and Zhang, 2003; Stott, 2003).
H. Goosse et al.: The origin of the European “Medieval Warm Period” 109
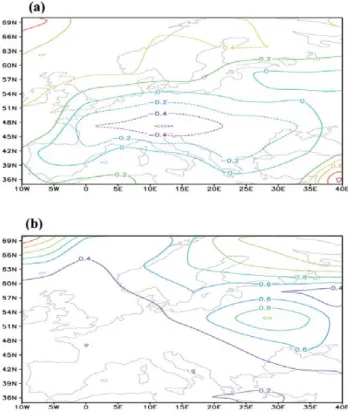
Fig. 8. Geographical distribution of the changes in seasonal range
(summer minus winter) between different periods. Shown is (a) the difference between the period 1950–2000 and 1500–1900 in the reconstruction of Luterbacher et al. (2004) and (b) in VECODE for the same periods and (c) in ECBILT-CLIO-VECODE for the difference between the period 1801–1825 com-pared to 1025–1050.
6 Regional distribution of the temperature response
The geographical distribution of the response to an external forcing is largely influenced by internal dynamics (e.g., Man-abe et al., 1992). On the one hand, because of the feedback related to snow and ice, the response to a forcing tends to be larger at high latitudes in winter than at low latitudes. On the other hand, processes mainly related to the freshwater cycle, in particular to changes in soil moisture, tend to amplify the summer response in Southern Europe. Consequently, the re-duction in the seasonal contrast during the last centuries is
Fig. 9. Difference between ensemble mean temperatures in 1976–
2000 compared to 1025–1050 in (a) summer and (b) winter.
large at high latitudes while in Southern Europe the decrease in the amplitude of the annual cycle is smaller (Fig. 8). The model displays a pattern similar to the one found by Luter-bacher et al. (2004) but the amplitude is larger for the latter. However, we must take into account that we are comparing an ensemble mean for the model and a particular realisation of the climate evolution in the reconstruction. We have used in this model-data comparison relatively long periods, in or-der to limit the amplitude of internal variability compared to the forced one, but this still precludes a detailed quantita-tive comparison. Nevertheless, the changes in the observed seasonal contrast shown in Fig. 8a are larger than two stan-dard deviations of the seasonal contrast for 50-year averages in all the land areas between 5◦–40◦E and 40◦–60◦N. The observed reduction is thus also a robust feature of the recon-struction.
In addition to the role of internal dynamics, the various forcings also have an impact on the geographical distribution of the response. In particular, the forcing due to land-use changes is strong in mid-latitudes, particularly in France and Germany. This results in a larger cooling in those regions during the pre-industrial period. As the response to this forc-ing tends to be stronger in summer, this is also implies a re-duction of the seasonal contrast during this period in those regions (Fig. 8c). The aerosol forcing has also a clear spatial pattern with a larger cooling at mid-latitudes, downstream of the main industrial areas in Europe (Mitchell and Johns, 1997).
As a consequence, an analysis of the difference in the en-semble mean response in ECBILT-CLIO-VECODE for dif-ferent regions between the late 20th century and the begin-ning of the millennium (Fig. 9) shows a general warming in winter with a maximum is Eastern Europe. In contrast, for summer, a weak warming is found only at high latitudes while the late 20th century is colder than the early second millennium in mid latitudes.
7 Conclusions
The model used here has a coarse resolution and includes some simplifications in order to be able to make a large num-ber of long simulations. The local features should thus not be considered as robust features and even at continental scale our results should be considered with caution. Ideally, re-gional models should be used to confirm our conclusions but this is not yet technically possible. The magnitude of the re-sponse is also influenced by the model sensitivity and by the uncertainties in the forcing applied. This is especially valid for the scenario of land uses change that must be set up us-ing very crude approximations. Nevertheless, as discussed above, the model results at European scale, both for summer and winter, appear consistent with empirical reconstructions as well as with our present knowledge of forcing time series and of the response to those forcings. We could thus provide a reasonable hypothesis about the evolution of the warm and cold season temperatures at European scale during the past millennium as well as the possible causes of those changes. This hypothesis could then be tested when new information will be available.
In agreement with previous studies, our results show a clear increase in European temperature during the last 150 years. This is mainly caused by the warming effect of the in-crease in greenhouse gas concentrations, which is only partly compensated by the cooling effect associated with the in-crease in sulphate aerosol load. Nevertheless, in contrast to hemispheric-scale annual temperatures, there is no com-pelling evidence from either empirical proxy evidence or model simulation results that the European summer temper-ature during the last 25 years of the 20th century were the highest of the past millennium. This is largely due to the lo-cal negative radiative forcing caused by land-cover changes. The impact of this forcing at hemispheric scale has been un-derlined in recent studies. However, because of the large de-forestation in Europe, land-use changes imply a larger nega-tive temperature anomaly over Europe than on a global scale (e.g., Bertrand et al., 2003; Bauer et al., 2003; Matthews et al., 2004; Feddema et al., 2005; Brovkin et al., 2006). The term “Medieval Warm Period”, of limited meaning at hemi-spheric scale (Jones and Mann, 2004; Bradley et al., 2003; Goosse et al., 2005a; Osborn and Briffa, 2006), nonetheless thus appears reasonable as applied specifically to summer European temperatures, the region the term was originally
applied to. In winter, our results are less definitive, and firm conclusions are not possible. Indeed, because of the large warming during the 20th century, the simulated forced re-sponse of the system reached a clear maximum at the end of the second millennium. Nevertheless, the uncertainties are still too large to argue with a reasonable confidence that the highest winter temperatures of the past millennium were ob-served during this period.
The contribution of orbital forcing has been relatively small for the last 1000 years, leading to temperature changes averaged over Europe smaller than 0.15◦C for all seasons. For the last 6000 years, however, a reduction of northern hemispheric summer insolation leads to a summer cooling for Europe of more than 1.5◦C as documented by a
tran-sient Holocene simulation performed with ECBILT-CLIO-VECODE (Renssen et al., 2005). The winter temperatures are more stable in the model. Therefore, on long time-scales as well, the summer temperatures and seasonal contrast of European temperatures has been decreasing. This simulated summer temperature decrease is in good agreement with pre-vious modelling studies (e.g., Masson et al., 1999) and with available proxy records over the European continent which generally exhibit a decrease of summer temperature over the last 6000 years, except for the areas close to the Mediter-ranean regions (e.g., Davies et al., 2003; Kim et al., 2004).
However, in the decades to come, the evolution of the Eu-ropean temperatures could be quite different since the forc-ings during the twenty-first century will be different from the ones experienced in the past. First, at the century time scale, the orbital forcing is very weak and can be neglected. Sec-ondly, in Europe, a small reduction of crop area and an in-crease in forest cover is expected, in contrast to the changes that occurred during the second millennium (e.g., Sitch et al., 2005). Finally, the concentration of greenhouse gases in the atmosphere will almost certainly continue to increase while the aerosol load will likely level off and even decrease (Andreae et al., 2005). As a consequence, the summer and winter European temperatures for the late 21st century are anticipated to greatly exceed the warmth of the past century (R¨ais¨anen et al., 2005; D´equ´e et al., 2006), and thus any pe-riod of the past millennium.
Acknowledgements. The authors would like to thank the scientists
that made available all their datasets. H. Goosse is Research Associate with the Fonds National de la Recherche Scientifique (Belgium) and is supported by the Belgian Federal Science Policy Office. H. Renssen is sponsored by the Netherlands Organization for Scientific Research (N.W.O). A. Timmermann is supported by the Japan Agency for Marine-Earth Science and Technology (JAMSTEC) through its sponsorship of the International Pacific Research Center. J. Luterbacher, E. Xoplaki and N. Riedwyl are supported by the Swiss National Science Foundation (NCCR Climate). E. Xoplaki and J. Luterbacher were also financially supported he EU project SOAP. M. E. Mann was supported by the U.S. NSF- and NOAA-sponsored Earth System History program.
H. Goosse et al.: The origin of the European “Medieval Warm Period” 111
Edited by: V. Masson-Delmotte
References
Andreae, M. O., Jones, C. D., and Cox, P. M.: Strong present-day aerosol cooling implies a hot future, Nature, 435, 1187–1190, 2005.
Bard, E., Raisbeck, G., You, F., and Jouzel, J.: Solar irradiance during the last 1200 years based on cosmogenic nuclides, Tellus, 52B, 985–992, 2000.
Bauer E., Claussen, M., Brovkin, V., and Huenerbein, A.: Assess-ing climate forcAssess-ings of the Earth system for the past millennium, Geophys. Res. Lett., 30, 1276, doi:10.1029/2002GL016639, 2003.
Bauer, E. and Claussen, M.: Analyzing seasonal temperature trends in forced climate simulations of the past millennium, Geophys. Res. Lett., 33, L02702, doi:10.1029/2005GL024593, 2006. Berger, A. L.: Long-term variations of daily insolation and
Quater-nary climatic changes, J. Atmos. Sci., 35, 2363–2367, 1978. Berger, A. and McMichael, A. J.: Climate change and health:
evi-dence and prospect, European Review, 7, 395–412, 1999. Bertrand, C., Loutre, M.-F., Crucifix, M., and Berger, A.: Climate
of the last millennium: a sensitivity study, Tellus, 54A, 221–244, 2002.
Bradley, R. S., Hughes, M. K., and Diaz, H. F.: Climate in Medieval time, Science, 302, 404–405, 2003.
Br´azdil, R.: Reconstructions of past climate from historical sources in the Czech Lands, in: Climatic Variations and Forcing Mech-anisms of the Last 2000 Years, edited by: Jones, P. D., Bradley, R. S., and Jouzel, J., NATO ASI Series, Springer, Berlin, Heidel-berg, New York, 1996.
Br`azdil, R., Pfister, C., Wanner, H., von Storch, H., and Luter-bacher, J.: Historical climatology in Europe – The State of the Art, Clim. Change, 70, 363–430, 2005.
Briffa, K. R., Jones, P. D., Bartholin, T. S., Eckstein, D., Schwe-ingruber, F. H., Karl´en, W., Zetterberg , P., and Eronen, M.: Fennoscandian summers from AD 500: temperature changes on short and long timescales, Clim. Dyn., 7, 111–119, 1992. Brovkin, V., Bendtsen, J., Claussen, M., Ganopolski, A., Kubatzki,
C., Petoukhov, V., and Andreev, A.: Carbon cycle, vegetation and climate dynamics in the Holocene: experiments with the CLIMBER-2 model, Global Biogeochem. Cycles, 16(4), 1139, doi:10.1029/2001GB001662, 2002.
Brovkin, V., Claussen, M., Driesschaert, E., Fichefet, T., Kick-lighter, T., Loutre, M.-F., Matthews, H. D., Ramankutty, N., Schaeffer, M., and Sokolov, A.: Biogeophysical effects of his-torical land cover changes simulated by six Earth system models of intermediate complexity, Clim. Dyn., 26, 587–600, 2006. B¨untgen, U., Esper, J., Frank, D. C., Nicolussi, K., and
Schmidhal-ter, M.: A 1052-year tree-ring proxy for Alpine summer temper-atures, Clim. Dyn., 25, 141–153, 2005.
Casty, C., Wanner, H., Luterbacher, J., Esper, J., and Bohm, R.: Temperature and precipitation variability in the European Alps since 1500, Int. J. Climatol., 25, 1855–1880, 2005.
Charlson, R. J., Langner, J., Rodhe, H., Leovy, C. B., and War-ren, S. G.: Perturbation of the Northern Hemisphere radiative balance by backscattering from anthropogenic sulfate aerosols, Tellus, 43AB, 152–163, 1991.
Chuine, I., You, P., Viovy, N., Seguin, B., Daux, V., and Le Roy Ladurie, E.: Grape ripening as a past climate indicator, Nature, 432, 289–290, 2004.
Crowley, T. J.: Causes of climate change over the past 1000 years, Science, 289, 270–277, 2000.
Crowley, T. J., Baum, S. K., Kim, K. Y., Hegerl, G. C., and Hyde, W. T.: Modeling ocean heat content changes during the last millennium, Geophys. Res. Lett., 30, 1932, doi:10.1029/2003GL017801, 2003.
Davis, B. A. S., Brewer, S., Stevenson, A. C., Guiot, J., and Data Contributors.: The temperature of Europe during the Holocene reconstructed from pollen data, Quat. Sci. Rev., 22, 1701–1716, 2003.
D´equ´e, M., Jones, R. G., Wild, M., et al.: Global high resolution versus Limited Area Model climate change projections over Eu-rope: quantifying confidence level from Prudence results, Clim. Dyn., doi:10.1007/s00382-005-0052-1, 2006.
Esper, J., Cook, E. R., and Schweingruber, F. H.: Low-frequency signals in long tree-ring chronologies for reconstructing past temperature variability, Science, 295, 2250–2253, 2002. Feddema, J., Olseson, K. Bonan, G., Mearns, L., Washington, W.,
Meehl, G., and Nychka, D. A.: Comparison of a GCM response to historical anthropogenic land cover change and model sen-sitivity to uncertainty in present-day land cover representation, Clim. Dyn., 25, 581–609, 2005.
Goldewijk, K. K.: Estimating global land use change over the past 300 years: The HYDE database, Global Biogeochem. Cycles, 15, 417–433, 2001.
Goosse, H. and Fichefet, T.: Importance of ice-ocean interactions for the global ocean circulation: a model study, J. Geophys. Res., 104, 23 337–23 355, 1999.
Goosse, H., Renssen, H., Timmermann, A., and Bradley, R. S.: In-ternal and forced climate variability during the last millennium: a model-data comparison using ensemble simulations, Quat. Sci. Rev., 24, 1345–1360, 2005a.
Goosse, H., Crowley, T., Zorita, E., Ammann, C., Renssen, H., and Driesschaert, E.: Modelling the climate of the last millen-nium: What causes the differences between simulations?, Geo-phys. Res. Lett., 32, L06710, doi:10.1029/2005GL22368, 2005b. Goosse, H., Renssen, H., Timmermann, A., Bradley, R. S., and Mann, M. E.: Using paleoclimate proxy-data to select optimal realisations in an ensemble of simulations of the climate of the past millennium, Clim. Dyn., 27, 165–184, 2006.
Goudie, A.: The human impact on the natural environment, Black-well Publishers, Oxford, UK, forth edition, 454 p., 1993. Guiot, J., Nicault, A., Rathgeber, C., Edouard, J. L., Guibal,
F., Pichard, G., and Till, C.: Last-millennium summer-temperature variations in Western Europe based on proxy-data, The Holocene, 15(4), 489–500, 2005.
Guyotjeannin, O.: Atlas de l’histoire de France, IXe–XVesi`ecle, la France m´edi´evale, Editions Autrement, 2005.
Hegerl, G. C., Crowley, T. J., Baum, S. K. Kim, K.-Y., and Hyde, W. T.: Detection of volcanic, solar and greenhouse gas signals in paleo-reconstructions of Northern Hemispheric temperature, Geophys. Res. Lett., 30, 1242, doi:10.1029/2002GL016635, 2003.
Hughes, M. K. and Diaz, H. F.: Was there a “Medieval Warm Pe-riod”, and if so, where and when?, Clim. Change, 26, 109–142, 1994.
Hunt, B. G.: The Medieval Warm Period, the Little Ice Age and simulated climatic variability, Clim. Dyn., doi:10.1007/s00382-002-0299-8, 2006.
Jones, P. D. and Mann, M. E.: Climate over past millennia, Rev. Geophys., 42(2), RG2002, doi:10.1029/2003RG000143, 2004. Jones, P. D, Briffa, K. R., and Osborn, T. J.: Changes in the
North-ern Hemisphere annual cycle: implications for paleoclimatology, J. Geophys. Res., 108(D18), 4588, doi:10.1029/2003JD003695, 2003.
Kim, J. H., Rimbu, N., Lorenz, S. J., Lohmann, G., Nam, S. I., Schouten, S., R¨uhlemann, C., and Schneider, R. R.: North Pacific and North Atlantic sea-surface temperature variability during the Holocene, Quat. Sci. Rev., 23, 2141–2154, 2004.
Klimenko, V. V., Klimanov, V. A., Sirin, A. A., and Sleptsov, A. M.: Climate changes in Western European Russia in the late Holocene, Doklady Earth Sciences, 377(2), 190–194, 2001. Lamb, H. H.: The early Medieval warm epoch and its sequel,
Palaeogeography, Palaeoclimatology, Palaeoecology, 1, 13–37, 1965.
Lean, J., Beer, J., and Bradley, R.: Reconstruction of solar irradi-ance since 1610: implications for climate change, Geophys. Res. Lett., 22, 1591–1594, 1995.
Luterbacher, J., Dietrich, D., Xoplaki, E., Grosjean, M., and Wan-ner, H.: European seasonal and annual temperature variability, trends, and extremes since 1500, Science, 303, 1499–1503, 2004. Manabe, S., Spelman, M. J., and Stouffer, R. J.: Transient responses of a coupled atmosphere-ocean model to gradual changes of at-mospheric CO2, II. Seasonal response, J. Climate, 4, 105–126, 1992.
Mann, M. E., Bradley, R. S., and Hughes, M. K.: Northern Hemi-sphere temperatures during the past millennium: inferences, un-certainties, and limitations, Geophys. Res. Lett., 26, 759–762, 1999.
Mann, M. E. and Jones, P. D.: Global surface temperatures over the past two millennia, Geophys. Res. Lett., 30, 1820, doi:10.1029/2003GL017814, 2003.
Masson, V., Cheddadi, R., Braconnot, P., Joussaume, S., Texier, D., and PMIP participants: Mid-Holocene climate in Europe: what can we infer from PMIP model-data comparisons?, Clim. Dyn., 15, 163–182, 1999.
Matthews, H. D., Weaver, A. J., Meissner, K. J., Gillet, N. P., and Eby, M.: Natural and anthropogenic climate change: incorpo-rating historical land cover change, vegetation dynamics and the global carbon cycle., Clim. Dyn., 22, 461–479, 2004.
Mitchell, J. F. B. and Johns, T. C.: On modification of global warm-ing by sulphate aerosols, J. Climate, 10, 245–267, 1997. Moberg, A., Sonechkin, D. M., Holmgren, K., Datsenko, N. M., and
Karl´en, W.: Highly variable northern hemisphere temperatures reconstructed from low- and high-resolution proxy data, Nature, 433, 613–617, 2005.
Opsteegh, J. D., Haarsma, R. J., Selten, F. M., and Kattenberg, A.: ECBILT: A dynamic alternative to mixed boundary conditions in ocean models, Tellus, 50A, 348–367, 1998.
Osborn, T. J. and Briffa, K. R.: The spatial extent of 20th-century warmth in the context of the past 1200 years, Science, 311, 841– 844, 2006.
Osborn, T. J. and Briffa, K. R.: The spatial extent of 20th-century warmth in the context of the past 1200 years, Science, 311, 841– 844, 2006.
Pauling, A., Luterbacher, J., Casty, C., and Wanner, H.: 500 years of gridded high-resolution precipitation reconstructions over Eu-rope and the connection to large-scale circulation, Clim. Dyn., 26, 387–405, 2006
Petoukhov, V., Claussen, M., Berger, A., Crucifix, M., Eby, M., Eliseev, A., Fichefet, T., Ganopolski, A., Goosse, H., Kamenkovich, I., Mokhov, I., Montoya, M., Mysak, L. A., Sokolov, A., Stone, P., Wang, Z., and Weaver, A. J.: EMIC Inter-comparison Project (EMIP-CO2): Comparative analysis of EMIC simulations of climate, and of equilibrium and transient responses to atmospheric CO2 doubling, Clim. Dyn., 25, 363– 385, 2005.
Pfister, C., Luterbacher, J., Schwarz-Zanetti, G., and Wegmann, M.: Winter air temperature variations in western Europe during the Early and High Middle Ages (AD 750–1300), The Holocene, 8, 535–552, 1998.
Raible, C. C., Casty, C., Luterbacher, J., Pauling, A., Esper, J., Frank, D. C., B¨untgen, U., Roesch, A. C., Tschuck, P., Wild, M., Vidale, P.-L., Sch¨ar, C., and Wanner, H.: Climate Variabil-ity – Observations, Reconstructions, and Model Simulations for the Atlantic-European and Alpine region from 1500–2100 AD, Climatic Change, in press, 2006.
R¨ais¨anen, J., Hansson, U., Ullerstig, A., et al.: European climate in the late twenty-first century: regional simulations with two driving global models and two forcing scenarios, Clim. Dyn., 22, 13–31, 2005.
Ramankutty, N. and Foley, J. A.: Estimating historical changes in global land cover: croplands from 1700 to 1992, Global Bio-geochem. Cycles, 13(4), 997–1027, 1999.
Renssen, H., Goosse, H., Fichefet, T., Brovkin, V., Driesschaert, E., and Wolk, F.: Simulating the Holocene climate evolution at northern high latitudes using a coupled atmosphere-sea ice-ocean-vegetation model, Clim. Dyn., 24, 23–43, 2005.
Robock, A.: Volcanic eruptions and climate, Rev. Geophys., 38, 191–219, 2000.
Shabalova, M. V. and Van Engelen, F. V.: Evaluation of a recon-struction of winter and summer temperatures in the low coun-tries, AD 764–1998, Climatic Change, 58, 219–242, 2003. Selten, F.M.: On the response of ECBilt-CLIO to increasing GHG
concentrations, available at http://www.knmi.nl/onderzk/CKO/ ecbilt.html, 2002.
Shindell, D. T., Schmidt, G. A., Mann, M. E., Rind, D., and Waple, A.: Solar forcing of regional climate change during the Maunder Minimum, Science, 294, 2149–2152, 2001.
Simmons, I. G.: Changing the face of the Earth: Culture, Enviro-ment, History, Blackwell Publishers, Oxford, UK, Second Edi-tion, 464 p., 1996.
Sitch, S., Brovkin, V., von Bloh, W. van Vuuren, D., Eickhout, B., and Ganopolski, A.: Impacts of future land cover changes on atmospheric CO2 and Climate, Global Biogeochem. Cycles, 19, GB2013, doi:10.1029/2004GB002311, 2005.
Steurs, W.: Evolution dans les campagnes, in: Histoire du Brabant du Duch´e `a nos jours, edited by: van Uyten, R., Bruneel, C., Koldeweij, A. M., van de Sande, A. W. F. M., and van Oud-heusden, J. A. F. M., Waadeurs Uitgevers- Fondation de la ville brabanc¸onne, 73–77, 2004.
Stott, P. A., Tett, S. F. B., Jones, G. S., Allen, M. R., Mitchell, J. F. B., and Jenkins, G. J.: External control of 20th century temper-ature by natural and anthropogenic forcing, Science, 290, 2133–
H. Goosse et al.: The origin of the European “Medieval Warm Period” 113
2137, 2000.
Stott, P. A.: Attribution of regional-scale temperature changes to anthropogenic and natural causes, Geophys. Res. Lett., 30(14), 1728, doi:10.1029/2003GL017324, 2003.
Tett, S. F. B., Stott, P. A., Allen, M. R., Ingram, W. J., and Mitchell, J. F. B.: Causes of twentieth-century temperature change near the Earth’s surface, Nature, 399, 569–572, 1999.
Thomas, C. D., Cameron, A., Green, R. E., Bakkenes, M., Beau-mont, L. J., Collingham, Y. C., Erasmus, B. F. N., de Siqueira, M. F., Grainger, A., Hannah, L., Hughes, L., Huntley, B., van Jaarsveld, A. S., Midgley, G. F., Miles, L., Ortega-Huerta, M. A., Peterson, A. T., Phillips, O. L., and Williams, S. E.: Extinction risk from climate change, Nature, 427, 145–148, 2004.
van Engelen, A. F. V, Buisman, J., and Ijbnsen, F. A.: millennium of weather, winds and water in the low countries, in: History and climate: memories of the future?, edited by: Jones, P. D., Ogilvie, E. J., Davies, T. D, and Briffa, K. R., Kluwer Acad., Dordrecht, The Netherlands, 101–124, 2001.
Wagner, S. and Zorita, E: The influence of volcanic, solar and CO2forcing on the temperatures in the Dalton Minimum (1790–
1830): a model study, Clim. Dyn., 25, 205–218, 2005.
Xoplaki, E., Luterbacher, J., Paeth, H., Dietrich, D., Steiner, N., Grosjean, M., and Wanner, H.: European spring and autumn temperature variability and change of extremes over the last half millennium, Geophys. Res. Lett., 32, L15713, doi:10.1029/2005GL023424, 2005.
Zwiers, F. W. and Zhang, X.: Towards regional-scale climate change detection, J. Clim., 16, 793–797, 2003.