HAL Id: hal-00316206
https://hal.archives-ouvertes.fr/hal-00316206
Submitted on 1 Jan 1996
HAL is a multi-disciplinary open access
archive for the deposit and dissemination of sci-entific research documents, whether they are pub-lished or not. The documents may come from teaching and research institutions in France or abroad, or from public or private research centers.
L’archive ouverte pluridisciplinaire HAL, est destinée au dépôt et à la diffusion de documents scientifiques de niveau recherche, publiés ou non, émanant des établissements d’enseignement et de recherche français ou étrangers, des laboratoires publics ou privés.
Diffuse solar radiation and associated meteorological
parameters in India
A. B. Bhattacharya, S. K. Kar, R. Bhattacharya
To cite this version:
A. B. Bhattacharya, S. K. Kar, R. Bhattacharya. Diffuse solar radiation and associated meteorological parameters in India. Annales Geophysicae, European Geosciences Union, 1996, 14 (10), pp.1051-1059. �hal-00316206�
Ann. Geophysicae 14, 1051—1059 (1996) ( EGS — Springer-Verlag 1996
Diffuse solar radiation and associated meteorological
parameters in India
A. B. Bhattacharya1, S. K. Kar1, R. Bhattacharya2
1 Department of Physics, Kalyani University, Kalyani, West Bengal, 741 235, India
2 Centre of Advanced Study in Radio Physics and Electronics, Calcutta University, Calcutta, 700 009, India Received: 15 November 1995/Revised: 15 May 1996/Accepted: 27 May 1996
Abstract. Solar diffuse radiation data including global radiation, shortwave and longwave balances, net radi-ation and sunshine hours have been extensively analyzed to study the variation of diffuse radiation with turbidity and cloud discharges appearing in the form of atmospher-ics over the tropatmospher-ics. Results of surface radiation measure-ments at Calcutta, Poona, Delhi and Madras are presented together with some meteorological parameters. The monthly values of diffuse radiation and the monthly ratios of diffuse to global solar radiation have been examined, with a special emphasis in relation to the noise level of atmospherics at Calcutta in the very low frequency band. The results exhibit some definite seasonal changes which appear to be in close agreement with one another.
1 Introduction
For a proper understanding of the radiation climatology of a region, apart from information on direct and global solar radiation, a knowledge of the diffuse or sky radiation is required. Diffuse solar radiation represents the short-wave energy of solar origin scattered downwards by gas molecules, aerosols (or suspended particulate matter), water vapour and clouds in the atmosphere. The variabil-ity in the amount and type of cloud has a dominant role on the value of diffuse radiation. An assessment of the radiation received from the sky assumes great importance in problems concerning the utilization of solar energy, in light studies and in architectural research, particularly in the tropics where the diffuse radiation reaches very high levels. This work presents the results of measurements of diffuse solar radiation in India as recorded at four cities situated in the NW, SW, NE and SE of the country. The relationships between solar activity and meteorological phenomena made an interesting study during the last few
Correspondence to: A. B. Bhattacharya
decades, but the data obtained so far are not enough (Ideriah, 1992). Clouds are visible symbols of atmospheric activity and these are the seats of atmospheric electricity (Bhattacharya, 1994). No detailed analysis has yet been made between the solar diffuse radiation, turbidity and cloud discharges. We were thus prompted to study the variation of diffuse radiation with (1) turbidity and (2) cloud discharges appearing in the form of atmospher-ics over the tropatmospher-ics.
Solar radiation data for a period of 10 years from October 1982 to September 1992, including diffuse radi-ation, global radiradi-ation, shortwave and longwave balances, net radiation and sunshine hours, recorded by meteoro-logical observatories in India have been collected and properly processed. These solar data have been extensive-ly anaextensive-lyzed separateextensive-ly in conjunction with both turbidity and atmospherics data in the very low frequency (VLF) band.
2 Instrumentation
The equipment used for the continuous registration of diffuse solar radiation is the same as that for global solar radiation i.e. a Moll-Gorczynski pyranometer and a Cam-bridge recording millivoltmeter with the addition of a Schuepp shading ring to shade the thermopile element with its two hemispherical glass domes from the direct sun. The shading ring arrangement, the installation of the instrumental equipment, the correction to be applied for the sky inevitably obstructed by the ring, the standardiza-tion of instruments and the evaluastandardiza-tion records have been carefully done throughout the work. Regular daily obser-vations with Angstrom pyrgeometers have been taken at the four stations with some limitations. It can only be used at night when there is no precipitation and the winds are light. Precautions have to be taken to avoid the effects of temperature differences. The instrument has to be cali-brated regularly and despite various practical difficulties regular nightly measurements have been taken at all the
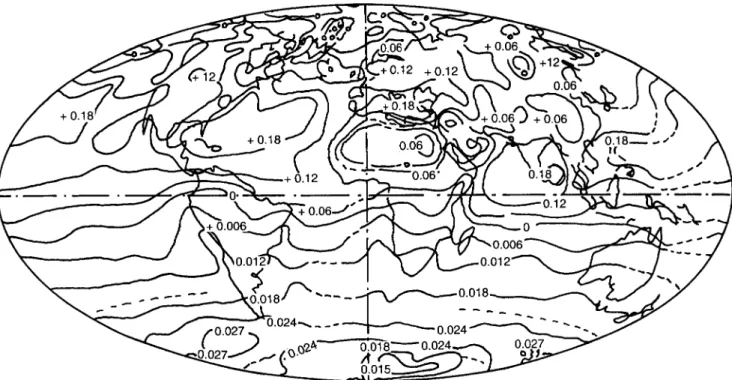
Fig. 1. Radiation balance of the Earth-atmosphere system for July over the entire path (after Raschke et al., 1967). The figure indicates
the net radiation flux (]4.186]104) at the top of the atmosphere in J · m~2 · min~1
stations. Three tuned radio frequency (TRF) receivers at 10, 20, and 30 kHz were used to record the atmospherics round-the-clock. The receivers used were designed to en-sure a large dynamic range with a view to handling a fairly wide range of field intensities.
3 Factors controlling net radiation
The radiation balance of the whole Earth-atmosphere system in July is shown in Fig. 1. There is an energy surplus at this time of absorbed solar radiation over emitted longwave radiation everywhere north of 10°S (Raschke et al., 1967). Maxima of energy occur over the relatively cloudless northern subtropical ocean and a defi-cit over North African and Arabian deserts. The defidefi-cit is due to high values of the albedo (30—40%) and high surface temperatures. Over the entire Southern Hemi-sphere the radiation balance is found to be negative.
The global average values of albedo, absorbed solar, outgoing longwave and net radiation are of the order as shown below:
Global albedo 29—30%
Absorbed radiation 1.423]104 J · m~2 · min~1 Outgoing radiation 1.444]104 J · m~2 · min~1 Net radiation for July !0.012]104 to 0.029
]104 J · m~2 · min~1. The global distribution of the albedo, the outgoing longwave radiation and the radiation balances agree fairly well with the ground-based and airborne measurements of the same parameters (Rossow and Zhang, 1995). Some preliminary results of the Earth Radiation Budget
Experiment were reported by Barkstrom et al. (1990), while calculation of surface and top of atmosphere radi-ative fluxes was made by Rossow and Zhang (1995). Sea-sonal variation of the surface radiation budget was reported by Darnell et al. (1992). On the other hand, global climatologies of solar radiation budgets at the surface and in the atmosphere were analyzed by Li and Leighton (1993), while re-evaluation of the global energy balance was examined by Ohmura and Gilgen (1993). However, more extensive aircraft and balloon-borne measurements are required, particularly over tropical countries like India.
Net radiation Q is the difference between the total incoming and outgoing radiation fluxes, both shortwave and longwave and is expressed as,
Q"RSB!RSC#RLB!RLC,
where RS and RL are the shortwave and longwave radi-ation fluxes. All fluxes towards the surface are considered to be positive and all fluxes away from the surface as negative.
RSB is the downward flux of solar radiation at the
surface or global solar radiation ¹. This is affected mainly by cloud amount and also partly by atmospheric aerosols and atmospheric absorption. The nature of the surface itself has no direct influence on ¹, although it has a profound influence on the reflected solar radiation RSC and hence on shortwave radiation balance (RSB!RSC).
The downward terrestrial radiation RLB depends on air temperature, on cloud amount and temperature and on the water content in the atmosphere, particularly when the layers are relatively low. The upward terrestrial radi-ation RLC depends on both temperature and emissivity of 1052 A. B. Bhattacharya et al.: Diffuse solar radiation and associated meterological parameters in India
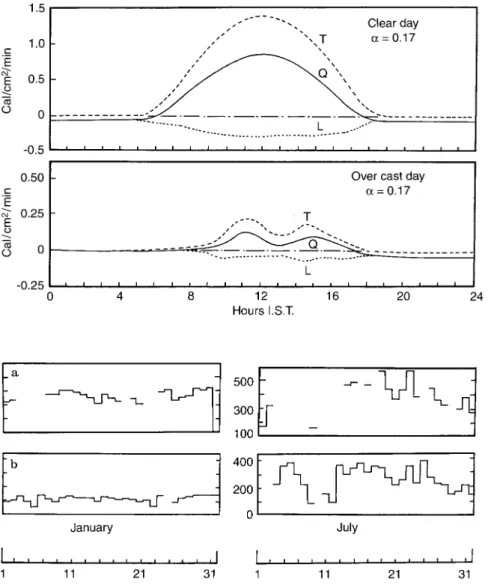
Fig. 2. Global radiation (¹), net radiation (Q) and net terrestrial radiation (¸) at Calcutta in Indian Standard Time (IST). The data plotted along the ½-axis is to be multiplied by 4.186]104 to represent the values in J · m~2 · min~1
Fig. 3. a Global radiation and b net radiation (]4.186]104) in January and July at Calcutta in J · m~2 · day~1
the Earth’s surface. Hence the net radiation, the difference between the amount of shortwave radiation absorbed by the Earth’s surface (RSB!RSC) and the amount of effective outgoing longwave radiation (RLB!RLC) is rather com-plex as concerns interacting variables, with no clear sepa-ration of ‘‘cause’’ and ‘‘effect’’. For a given regime of ¹, the net radiation and its variations during the day will depend on the nature of the surface.
In India, the surface albedo a varies with elevation, cloud amount, and the degree of moisture in the soil. Albedo is low when the soil is moist during the monsoon months and high when the soil is dry. Increase in cloudi-ness reduces the degree of dependence of albedo on the height of the Sun, since increase in the cloud amount decreases direct solar radiation and augments diffuse sky radiation (Chacko et al., 1968; Desikan et al., 1969; Mani and Chacko, 1973).
The diurnal variation of net radiation Q, on cloudless and overcast days, at Calcutta is shown in Fig. 2. The albedo for the station is estimated from the nature of the underlying surface as 0.17 values of global solar radiation ¹ and the estimated net terrestrial radiation ¸" (RLB!RLC) are also plotted. Q is calculated by using the relation ¹(1!a)#¸.
On clear days, the curves for all three fluxes, ¹, Q and ¸are smooth and regular and attain a maximum at about noon. Net radiation is negative from sunset to sunrise and shows a constant value throughout the night. On a cloudy day, both global solar and net radiation curves are again phase, but both values are very low, being about 0.627]104 and 0.334]104 J · m~2 · min~1 respectively. During the second half of the night the net radiation is almost zero. The effect of increasing surface temperatures during the day is noticeable in the net radiation profile, even though the sky is covered with cloud.
Figure 3 shows the daily totals of ¹ and Q for the months January and July for Calcutta. These 2 months have been chosen on purpose to examine the character-istic variation during winter and the rainy season. It is seen that, when ¹ is high, cloudless days are associated with high positive Q. An increase of cloud reduces both ¹and Q considerably.
3.1 Terrestrial radiation fluxes at the ground
The Angstrom pyrgeometers measure the longwave effec-tive outgoing radiation, ¸, as the difference between
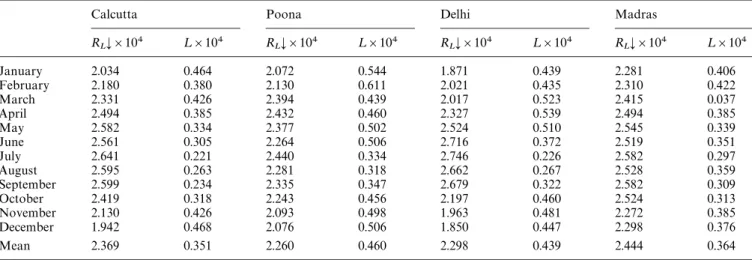
Table 2. Mean monthly values (in J · m~2 · min~1) of downward longwave radiation flux (RLB) and net outgoing longwave radiation (¸) on clear nights
Calcutta Poona Delhi Madras
RLB]104 ¸]104 RLB]104 ¸]104 RLB]104 ¸]104 RLB]104 ¸]104 January 2.034 0.464 2.072 0.544 1.871 0.439 2.281 0.406 February 2.180 0.380 2.130 0.611 2.021 0.435 2.310 0.422 March 2.331 0.426 2.394 0.439 2.017 0.523 2.415 0.037 April 2.494 0.385 2.432 0.460 2.327 0.539 2.494 0.385 May 2.582 0.334 2.377 0.502 2.524 0.510 2.545 0.339 June 2.561 0.305 2.264 0.506 2.716 0.372 2.519 0.351 July 2.641 0.221 2.440 0.334 2.746 0.226 2.582 0.297 August 2.595 0.263 2.281 0.318 2.662 0.267 2.528 0.359 September 2.599 0.234 2.335 0.347 2.679 0.322 2.582 0.309 October 2.419 0.318 2.243 0.456 2.197 0.460 2.524 0.313 November 2.130 0.426 2.093 0.498 1.963 0.481 2.272 0.385 December 1.942 0.468 2.076 0.506 1.850 0.447 2.298 0.376 Mean 2.369 0.351 2.260 0.460 2.298 0.439 2.444 0.364 Table 1. Location of the four stations
Stations Coordinates
Height (m) Latitude (°N) Longitude (°E) Calcutta 06 22° 32@ 88°20@ Poona 559 18°32@ 73°51@ Delhi 216 28°35@ 77°12@ Madras 16 13°00@ 80°11@
longwave radiation flux downward from the atmosphere
RLB and that upward from the instrument. Measurements
of the effective outgoing longwave radiation ¸ at the ground were made at 2030, 2330, 0230 and 0530 IST (Indian Standard Time) on all nights when there was no rain at the time of observation. The values of RLB and ¸are considered here for four Indian stations. Of the four stations, Calcutta and Madras are coastal stations where the diurnal variations of temperature are small and water vapour content high throughout the year. Madras is situ-ated in the southern half of the Indian peninsula, while Poona lies further north and closer to the western coast. Calcutta is typical of the northeast region with its hot humid summer followed by the monsoon and mild winter. New Delhi on the other hand, is typical of the semi-arid zones to the north and northwest with its extreme summer and winter conditions. Madras on the east coast has climatic conditions quite different from that of the rest of the country, the northeast monsoon occurring during October and November being a special feature of this area. The coordinates of the four stations with extreme climatic variations are noted in Table 1.
The mean monthly values for RLB and ¸ at 2030 IST for the four stations are shown in Table 2.
4 Diffuse solar radiation
The mean daily values of diffuse solar radiation D over a period of 10 years for the four stations, i.e. Calcutta,
Table 3. Mean daily values of diffuse solar radiation (]104) (in J · m~2 · day~1)
Calcutta Poona Delhi Madras January 506.50 397.67 414.41 699.06 February 560.92 401.85 493.94 606.97 March 761.85 565.11 653.01 669.76 April 862.31 703.24 833.01 724.17 May 1029.75 803.71 958.59 908.36 June 1084.17 1163.70 1213.94 1025.57 July 1071.61 1180.45 1059.05 1096.73 August 987.89 1205.56 950.22 1067.43 September 874.87 1025.57 749.29 883.24 October 586.04 590.22 481.39 791.15 November 485.57 464.64 372.55 715.80 December 456.27 414.41 389.29 715.80 Annual 774.41 740.92 715.80 824.64
Table 4. Values of mean daily diffuse solar radiation (in J · m~2 · day~1) during the premonsoon (March—May), monsoon (June—September) and postmonsoon (October—February) seasons with their annual percentages
March—May June—September October—February
D]104 (%) D]104 (%) D]104 (%) Calcutta 883.24 36.7 1004.64 41.7 519.06 21.6 Poona 690.69 30.2 1142.77 50.0 452.08 19.8 Delhi 812.08 36.4 992.08 44.5 426.97 19.1 Madras 766.03 30.8 1017.19 40.9 703.24 28.3
Poona, Delhi and Madras, are given in Table 3. Table 4 shows the values of mean daily diffuse radiation during the premonsoon (March—May), monsoon (June—Septem-ber) and postmonsoon (October—February) seasons and their annual percentages.
It can be seen that, in general, for all the stations, diffuse radiation is highest during the summer and mon-soon months and least during the clear winter months. The higher values in summer and monsoon are due to 1054 A. B. Bhattacharya et al.: Diffuse solar radiation and associated meterological parameters in India
Table 5. Ratios of mean daily values of diffuse to global solar radiation for all days and for clear days only. The dashes in the table indicate that a sufficient number of clear days was not available during those months for taking a mean
Calcutta Poona Delhi Madras
All days Clear days All days Clear days All days Clear days All days Clear days January 0.34 0.24 0.21 0.17 0.29 0.20 0.39 0.20 February 0.31 0.25 0.18 0.15 0.28 0.20 0.27 0.18 March 0.39 0.37 0.24 0.18 0.30 0.22 0.28 0.20 April 0.38 0.32 0.27 0.20 0.32 0.26 0.30 0.17 May 0.45 0.36 0.32 0.22 0.36 0.25 0.39 0.29 June 0.63 — 0.55 0.27 0.51 0.36 0.49 0.21 July 0.65 — 0.76 — 0.59 0.32 0.58 — August 0.64 — 0.74 — 0.56 0.25 0.54 — September 0.57 — 0.57 — 0.38 0.25 0.44 — October 0.35 0.17 0.31 0.16 0.25 0.22 0.45 0.17 November 0.32 0.19 0.25 0.15 0.24 0.19 0.45 0.17 December 0.33 0.25 0.25 0.15 0.29 0.20 0.47 0.19 Annual 0.45 0.28 0.37 0.18 0.37 0.23 0.42 0.20
increased turbidity and cloudiness during this period; cloudiness having the greatest influence on diffuse ation. However, Delhi receives the maximum diffuse radi-ation in June, the hot summer month, when the atmo-sphere is very turbid and there are frequent duststorms. The highest values of nearly 1255.8]104 J · m~2 · day~1 are recorded during June at Delhi and during August at Poona. At the other two stations, diffuse radiation is of the order of 1046.5]104—1172.1]104 J · m~2 · day~1 during the monsoon months.
The lowest diffuse radiation values recorded are about 376.7]104 J · m~2 · day~1 during the clear winter month, December at Delhi. At other stations the minimum is of the order of 418.6]104 J · m~2 · day~1, except at Madras where cloud-free skies are very rare and the minimum is as high as 627.9]104 J · m~2 · day~1. In fact, Madras re-ceives relatively uniform diffuse radiation throughout the year because it is more or less uniformly cloudy through-out the year. The annual values of diffuse radiation are therefore highest at Madras with 301.4]107 J · m~2 · year~1. It is seen from Table 4 that about 40—50% of the diffuse radiation is received during the cloudy monsoon months and 30—35% during the turbid summer months. At Madras about 30% of the diffuse radiation is received during the winter season due to cloud formation during the northeast monsoon.
Ratios of mean daily values of diffuse to global solar radiation (D/¹ ) for all days and the same ratios for clear days only are given in Table 5. Taking all days, clear as well as cloudy, into consideration, the values of D/¹ are seen to vary between 15 and 80%, the maximum values occurring in June—August and the minimum in Novem-ber—February. This indicates that about 80% of the short-wave radiation received is scattered sky radiation during monsoon months. The variation of this ratio is maximum at Poona, where it varies from 25% in December to 76% in August, and least in Madras, where the range is only from 27% in February to 58% in July. The lower vari-ation at Madras is caused by the general cloudiness throughout the year. Stations which are characterized by clear skies and lower turbidity in winter and higher
Fig. 4. The monthly variations of diffuse to global solar radiation (D/¹) and Angstrom turbidity coefficient (b) for the four Indian stations
turbidity and severe cloud in summer and monsoon. For example, Poona reveals a very sharp increase in D/¹ during the summer and monsoon seasons. Calcutta, with the industrial smoke and turbid and foggy atmosphere presents comparatively higher D/¹ values during the win-ter months.
4.1 Relation between turbidity and diffuse radiation
The mean daily values of the ratios of diffuse to global solar radiation (D/¹) for clear days and the mean daily values of the Angstrom turbidity coefficient (b) for the four stations are plotted in Fig. 4. The coefficient b is defined as the extinction due to scattering and absorption of aerosols. On a clear day one may expect D/¹ to depend mainly on atmospheric turbidity. It is seen from Fig. 4
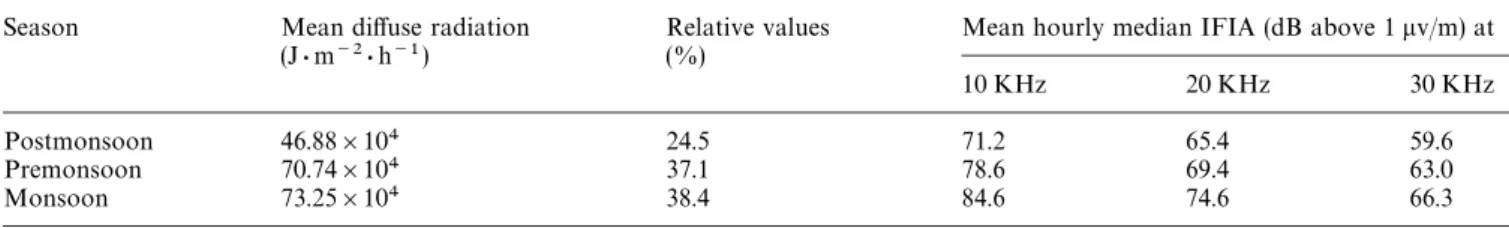
Table 7. Seasonal values of diffuse radiation and IFIA
Season Mean diffuse radiation Relative values Mean hourly median IFIA (dB above 1lv/m) at (J · m~2 · h~1) (%)
10 KHz 20 KHz 30 KHz
Postmonsoon 46.88]104 24.5 71.2 65.4 59.6
Premonsoon 70.74]104 37.1 78.6 69.4 63.0
Monsoon 73.25]104 38.4 84.6 74.6 66.3
Fig. 5. Mean hourly values of diffuse radiation and median IFIA plotted month by month
that the general trend in the curves of b and D/¹ are similar. The trends are, however, a little different for Madras during the period June—August. This might be due to the fact that at Madras pyrheliometer measure-ments are taken when the Sun’s disc and the sky immedi-ately around it are free from clouds while the rest of the sky is cloudy. As a result b values do not correspond exactly to the conditions under which the values of D/¹ are determined. There is a close correlation between tur-bidity and the ratio of diffuse to global solar radiation on cloudless days. Aerosols, contributing as much as 30% of diffuse radiation over the country, play a vital role in the zonal radiation climatology.
4.2 Relation between cloud discharges and diffuse radiation
The mean monthly values of diffuse radiation (D) in J · m~2 · h~1 over Calcutta are plotted in Fig. 5. The me-dian noise level of the integrated field intensity of atmo-spherics (IFIA) at the same station corresponding to each observed hour of solar radiation was first noted, and the mean value for each month has been calculated from this. These mean values are also shown in Fig. 5. Figure 5 veals that the variation of diffuse radiation closely re-sembles the variation of atmospherics at all the three frequencies, 10, 20, and 30 KHz. The intensities of diffuse radiation and of atmospherics are predominant during the hot summer and monsoon months, May—August, while a minimum value is noticed during the clear winter
Table 6. Correlation coefficients between diffuse radiation and IFIA Events considered Correlation coefficient
D and (IFIA)10 KH; 0.87
D and (IFIA)20 KH; 0.82
D and (IFIA)30 KH; 0.79
months, November—February. An analysis of the correla-tion coefficients between the plots of diffuse radiacorrela-tion and IFIA at each of the frequencies has been made. The results obtained are presented in Table 6.
Table 6 shows that there is a positive correlation coef-ficient of 0.8 in all the cases.
The seasonal values of diffuse solar radiation per hour for the three main seasons, postmonsoon, premonsoon, and monsoon, have been calculated. The results are shown in Table 7. It appears from Table 7 that the diffuse radiation during the premonsoon and monsoon seasons is much higher than during the postmonsoon season. For comparison, the mean hourly median noise level of IFIA at 10, 20 and 30 KHz for the three seasons are also shown in the same table. It is found from Table 7 that the values of IFIA during the postmonsoon is least, intermediate during the premonsoon and highest during the monsoon season at all the three frequencies. However, it should be noted that there is a difference in the amount of diffuse sky radiation for Calcutta compared with the values given in Table 4. These differences are due to the fact that the data we have considered here are only for locally clear days. This is required for a suitable comparison with the atmo-spheric data being considered in the analysis.
4.3 Distribution of sunshine hours, normalized D and IFIA
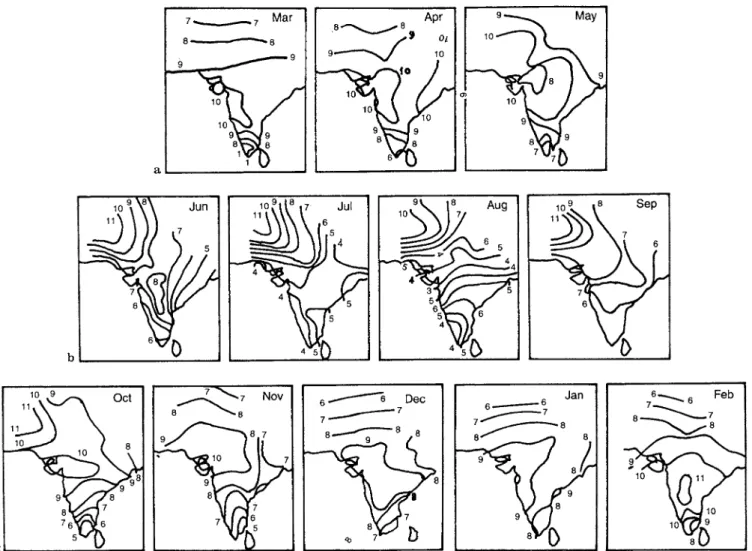
The distribution of the mean daily hours of bright sun-shine for each month over the Indian subcontinent is shown in Fig. 6 using data from 40 stations. The duration of sunshine shows a maximum over central and northwest India, with an average value between 8 and 10 h per day. During the cold season, it is highest over central India, while the northern regions receives less sunshine due to the passage of winter disturbances from the west and the decrease in the length of the day with latitude and in the south due to cloudiness associated with disturbances in the Bay of Bengal and Arabian sea. As the year advances, till the onset of the monsoon in June, the region of clear skies and maximum sunshine shifts to the north and west 1056 A. B. Bhattacharya et al.: Diffuse solar radiation and associated meterological parameters in India
Fig. 6. Distribution of sunshine hours during a premonsoon; b monsoon; and c postmonsoon seasons over India
Pakistan. In the arid and semi-arid zones of central and northwest India, the skies are clear for generally more than 8—10 h a day.
The mean actual hours of sunshine over Calcutta are plotted in Fig. 7. A normalized curve for the diffuse radiation obtained from the mean values is also plotted monthwise in the figure. For this purpose, the mean monthly value is first calculated for different months, then normalized values of diffuse sky radiation are obtained by dividing the individual values by the max-imum value obtained. A similar normalized curve for IFIA is further superimposed by considering the median noise level obtained from the means at 10, 20, and 30 KHz. Figure 7 reveals that the trends for the two normalized curves are similar, with a little more fluctuation for the
D values. It is also interesting to note that the curve for
sunshine hours is almost a mirror image of the other two curves, with a minimum during the cloudy monsoon sea-son and a maximum during the remaining clear months.
4.4 Significance test
Using the normalized values of diffuse solar radiation and IFIA the significance test (t) has been calculated by the
usual relation (Croxton and Cowden, 1964),
t"Xd pXd"pLd/(n)1@2Xd . Here, Xd"Rdn , and pˆd"M[Rd2/(n!1)]!(Rd)2/n(n!1)N1@2 ,
where d is the difference between the two mean values of a pair and n is the number of samples for whichRd has been calculated. In our analysis, the three main Indian seasons of the year, i.e. winter, premonsoon and monsoon, have been considered for 5, 3, and 4 months, respectively, giving values of n for three different sets of t. The seasonal values of the significance ratio (t) and also its correspond-ing level of significance (p) are presented in Table 8. The level of significance (p) has been obtained from the know-ledge of the significance ratio (t) and degrees of freedom ( f"n!1) .
It appears from Table 8 that the level of significance is somewhat small during the winter months, but there is a marked rise in its value during the premonsoon and
Fig. 7. Curves showing the sunshine hours, and normalized values of (1) diffuse radiation and (2) IFIA for Calcutta
Table 8. Significance ratio (t) and level of significance (p) Season Degree of Significance Level of
freedom ratio (t) significance (p) ( f"n!1)
Winter 4 6.5 0.002(p(0.003 Premonsoon 2 2.6 0.15 (p(0.20 Monsoon 3 2.4 0.15 (p(0.20
monsoon. The significance ratio during the latter two seasons is of the order of 2 only.
5 Discussion
The phenomena of scattered radiation in the atmosphere are very complex and varied. Numerous factors determin-ing the quantity of scattered radiation change continuous-ly in time and space and make computation difficult (Coppolino, 1992). The amount of diffuse radiation re-ceived for a particular geophysical location on the Earth’s surface depends mainly on the solar elevation, turbidity in the atmosphere and cloudiness. On the other hand, the noise level in the IFIA at a place is solely controlled by lightning discharges around the observing station (Will-iams et al., 1989). The seasonal variation of both the phenomena noted will be governed by the activity of their sources. In our results, close similarity between the vari-ation of diffuse radivari-ation with the varivari-ation of IFIA indi-cates that the common causes are more responsible for their variation. In the winter months when the local sky is almost free from clouds but dust particles are present diffuse radiation is least. Due to the poor activity of the sources, the noise level of IFIA also exhibits a minimum value during these months. With the advance of the year, there is a general increase of both diffuse radiation and IFIA due to an increase in cloudiness accompanied by nor’westers (local term) in the premonsoon months. With the establishment of the monsoon, both diffuse radiation and IFIA further increase. Both phenomena attain a
maximum value during the monsoon months as a result of the increased cloudiness over the region. With the with-drawal of the monsoon in October and onset of winter conditions, there is again a fall of D and IFIA.
The correlation coefficient between the values of diffuse solar radiation and the intensity of atmospherics is quite good. Besides the activity of clouds, some other para-meters, e.g. pollution, also contribute to the diffuse radi-ation, either simultaneously or in succession, while the record of IFIA is influenced by a large number of natural sources over a very wide range. The positive sign asso-ciated with a high correlation coefficient between D and IFIA indicates that in producing those values the com-mon causes are distinctly more effective than the contribu-tion due to independent causes.
The lack of significance in the winter season is under-standable, as the D values at such times are governed mainly by the characteristics of dust particles, gas molecu-les, etc. This is as a result of high local industrial pollution and partly by the activity of local clouds (Raja Rao, 1984). During the overcast cloudy months, on the other hand, there is a reduction in industrial pollution as a result of rainfall and wash-out in precipitation. The low level of significance during the winter season, thus, might be due to the combination of weak clouds and dust particles, while their high values during the premonsoon and mon-soon months are perhaps caused by the vigorous activity of clouds at such times (Bhattacharya et al., 1994).
Acknowledgements. Thanks are due to the directors of
meteorologi-cal observatories of India for supplying relevant meteorologimeteorologi-cal data and to the Eastern Centre for Research in Astrophysics (ECRA) for financial support. One of the authors (R.B.) is indebted to the CSIR, New Delhi for awarding an associateship.
Topical Editor L. Eymard thanks T. Konzelmann and G. Brog-niez for their help in evalauting this paper.
References
Barkstrom, B. R., E. F. Harrison, and R. B. Lee III, Earth radiation budget experiment, preliminary results, EOS, 71, 279, 299 and 304—305, 1990.
Bhattacharya, A. B., Multitechnique studies of nor’wester using electrical and meteorological parameters, Ann. Geophysicae, 12, 232—239, 1994.
Bhattacharya, A. B., B. K. Datta, and R. Bhattacharya, Some distinct effects of tropical monsoon clouds as derived from atmospherics, ¹heor. Appl. Climatol., 50, 83—92, 1994.
Chacko, O., C. T. Thomas, and A. Mani, Surface radiation balance measurements in India during the IQSY, Indian J. Meteorol.
Geophys., 19, 93—98, 1968.
Coppolino, S., Applicability of a simple model for computing diffuse solar radiation to locations of the European, Asian and North American areas, Renew Energy, 2, 469—472, 1992.
Croxton, F. E., and D. J. Cowden, Applied general statistics, Pren-tice-Hall of India, New Delhi, p. 654, 1964.
Darnell, W. L., W. F. Staylor, S. K. Gupta, N. A. Ritchey, and A. C. Wilber, Seasonal variation of surface radiation budget derived from International Satellite Cloud Climatology Project C1 data,
J. Geophys. Res., 97, 15,741—15,760, 1992.
Desikan, V., N. V. Iyer, and C. G. Rahalkar, Diffuse solar (sky) radiation measurements over India, Indian J. Meteorol.
Geo-phys., 20, 389—394, 1969.
Ideriah, F. J. K., On the characteristic distribution of hourly diffuse and global solar radiation at Ibadan, Renew Energy, 2, 461—468, 1992.
Li, Z., and H. G. Leighton, Global climatologies of solar radiation budgets at the surface and in the atmosphere from 5 years of ERBE data, J. Geophys. Res., 98, 4919—4930, 1993.
Mani, A., and D. Chacko, Solar radiation climate of India, Solar
Energy, 14, 139—156, 1973.
Ohmura, A., and H. Gilgen, Re-evaluation of the global energy balance, Geophys. Monogr., 75, IUGG, 15: 93—100, 1993. Raja Rao, K. S., Response of the atmosphere to solar activity
variations — a review, Proc. Indo-ºS ¼orkshop on Solar ¹errestrial Physics, NPL, New Delhi-110 012, pp. 509—522, 1984.
Raschke, E., F. Moller, and W. R. Bandeen, The radiation balance of the Earth-atmosphere system over both polar regions obtained from radiation measurements of the Nimbus II meteorological satellite, NASA Goddard Space Flight Centre, X-622-67-460, 1967. Rossow, W. B., and Y. C. Zhang, Calculation of surface and top of atmosphere radiative fluxes from physical quantities based on ISCCP data sets, 2. Validation and first results, J. Geophys. Res., 100, 1167—1197, 1995.
Williams, E. R., S. G. Geotis, and A. B. Bhattacharya, A radar study of the plasma and geometry of lightning, J. Atmos, Sci., 46, 1173—1185, 1989.