HAL Id: hal-00305616
https://hal.archives-ouvertes.fr/hal-00305616
Submitted on 17 Jan 2007
HAL is a multi-disciplinary open access archive for the deposit and dissemination of sci-entific research documents, whether they are pub-lished or not. The documents may come from teaching and research institutions in France or abroad, or from public or private research centers.
L’archive ouverte pluridisciplinaire HAL, est destinée au dépôt et à la diffusion de documents scientifiques de niveau recherche, publiés ou non, émanant des établissements d’enseignement et de recherche français ou étrangers, des laboratoires publics ou privés.
available particulate forms for eastern UK rivers
C. Neal
To cite this version:
C. Neal. Rare earth element concentrations in dissolved and acid available particulate forms for eastern UK rivers. Hydrology and Earth System Sciences Discussions, European Geosciences Union, 2007, 11 (1), pp.313-327. �hal-00305616�
© Author(s) 2007. This work is licensed under a Creative Commons License.
Rare earth element concentrations in dissolved and acid available
particulate forms for eastern UK rivers
Colin Neal
Centre for Ecology and Hydrology, Crowmarsh Gifford, Wallingford, OXON, UK Email: [email protected]
Abstract
Variations in concentration of yttrium (Y), lanthanum (La), cerium (Ce), neodymium (Nd), samarium (Sm) and gadolinium (Gd) among rivers of eastern England and the border with Scotland are described in relation to the dissolved (<0.45 mM) fraction and acid-available particulate (AAP) fractions. The rivers cover a range of rural, agricultural and urban/industrial environments. Yttrium and the lanthanides show significant levels of both dissolved and acid-available particulate forms (typically about 40% in the dissolved form). For the dissolved phase, Y and the lanthanides are linearly correlated with each other and with iron: most of this dissolved component may be in a micro-particulate/colloidal form. The Y and lanthanide relationships show marked scatter and there are anomalously high La concentrations at times for the rivers Great Ouse, Thames and Wear that are probably linked to pollutant sources. For the Ouse, and especially for one of its tributaries, the Swale, relatively high Sm concentrations are probably associated with mineralisation within the catchment and contamination of the associated flood plain. For the AAP components, there are strong linear relationships with Y and the lanthanides across all the rivers. There is also a strong link between these AAP associated REE and AAP iron, although the scatter is greater and the industrial rivers have a lower lanthanide to iron ratio, probably due to iron-rich contaminants.
Keywords: cerium, gadolinium, Great Ouse, Humber, lanthanum, LOIS, neodymium, rare earth, river, samarium, Thames, Tweed, Wear,
yttrium
Introduction
Rare earth elements (REE) are important in relation to general understanding of the hydrochemical functioning of the elements in the hydrosphere. They provide valuable tracers for examining silicate weathering rates, crustal erosion and element fluxes to the ocean (Brooking, 1989; Dupré et al., 1996; Elderfield et al., 1990; Gerard et al., 2003; Oliva et al., 1999; Rengarajan and Sarin, 2004). Furthermore, there are growing issues over pollutant REE inputs to the aquatic environment (Bau and Dulski., 1996; Neal, 2005; Nozaka et al., 2000; Wang et al., 2003; Weltje et al., 2002; Verplanck et al., 2005; Wilkinson et al., 1997). Until about 1920, the term REE referred to almost any naturally occurring but unfamiliar oxide (Greenwood and Ernshaw, 2005). However, since then the term has been used to describe either the lanthanide series or the group 3 elements of the left hand edge of the transition metals component of the periodic table. Scandium (Sc) and yttrium (Y) make up the first two rows, the lanthanide group the
third row and the actinides the forth row. To simplify matters in this paper, the group 3 elements are termed rare earth elements (REE).
Of the REE, the lanthanides have received the most attention within the earth sciences. This is understandable in terms of their fractionation in the earth, given their chemical characteristics of a predominant 3+ state and a
uniform variation in ionic size. However, the differences in hydrogeochemical and geochemical properties of Sc and Y from the other REE are worthy of study. For example, in solution, Sc with its small ionic size and high charge density, is prone to strong complexation with hydroxyl ions (Turner et al., 1981; Brookins, 1989; Greenwood and Ernshaw, 2005), while in the solid phase it shows some characteristics of the group 2 divalent base cation magnesium (Goldschmidt, 1958). For Y and the lanthanide group there are issues of REE speciation with respect to hydroxyl, fluoride, phosphate, carbonate and organic complexation (Brookings, 1989; Johannesson et al., 2004; Shand et al.,
2005). For the REE in general, their complexes vary in significance according to the pH of the waters (Brookings, 1989). Within the dissolved fraction (<0.45 mm filter size), the dominant form of transport for the lighter lanthanides, especially at circumneutral pH, is thought to be associated with colloidal material, while for the heavier lanthanides it may be complexes (Shand et al., 2005).
In this paper, the concentrations of selected REE in dissolved and acid available particulate (AAP) phases of major rivers in the eastern UK are presented as a general overview of riverine REE levels to complement and extend earlier studies for the UK (Elderfield et al., 1990, Neal, 2005) and global rivers (Gaillardet et al., 2003). The analysis is based largely on the results of a monitoring study within a UK community programme, the Land Ocean Interaction Study (LOIS: Leeks and Jarvie, 1998) and also on associated studies of English rivers (Neal et al., 2000a,b,c). Within these studies, a wide range of water quality determinands was measured and the use of inductively coupled plasma mass spectrometry (ICPMS) allowed the assessment of many trace elements including Y and the lighter lanthanides (La through to Sm). A compendium of averages and ranges in concentration and fluxes of the elements is provided by Neal and Robson (2000) and Neal and Davies (2003): data on Sc were also presented but the data may well be in error due to interference from silicon in the ICPMS methodology (Stetzenback et al., 1994).
This paper provides data on lighter REE levels for rural, agricultural and urban industrial settings to allow a comparison between natural and anthropogenic
components and complements an earlier study of an acidic and acid-sensitive upland environment (Neal, 2005). It deals with less acidic to moderately alkaline lowland UK river systems that cover major agricultural and industrially affected parts of the UK. These rivers provide the major flux to the estuarine and coastal environment of the economically important and ecologically vulnerable North Sea.
Study area and monitoring
programme
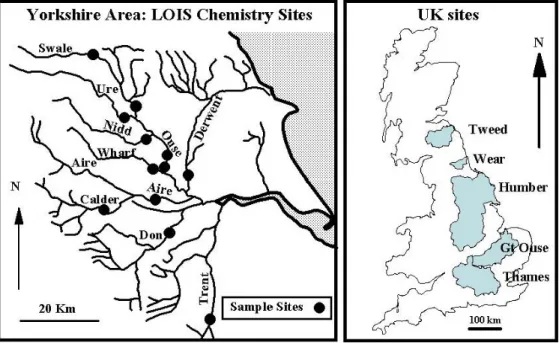
The study area comprises the basins of the Tweed, Humber, Wear, Great Ouse and Thames, the major eastern UK lowland rivers draining into the North Sea (Fig. 1) and encompasses the eastern half of the UK, from the borders of England and Scotland, through the midlands and to the south and south-east of England, an area of about a fifth of the UK. These basins and their sub-basins have catchments covering the major lowland catchment systems for the UK: rural, rural/urban, rural/mining, urban/industrial and agricultural settings. The general water quality across the region is provided by Neal (2001) and the salient features for the various basins are as follows:
The Tweed basin is largely rural and is located around the
eastern border between Scotland and England. The basin has moorland and rough pasture for hill sheep in the uplands and arable tilled regions in the lowlands. The geology of
the area is primarily sedimentary and metamorphosed sedimentary rocks (Ordovician to Carboniferous greywacke, shale and limestone) with granites and basalts in the south of the area (Cheviot Hills). Three sites have been monitored, two on the main stem of the river at Boleside (Tweed 1) and the other downstream at Norham (Tweed 2) near the non-tidal estuary. A tributary of the Tweed, the Teviot, has also been monitored.
The Wear drains Carboniferous age limestone, grit and
shales. The upper half of the basin is mainly moorland with extensive sulphide vein mineralisation and historic lead-zinc mining with numerous spoil heaps. The middle area of the Wear has mainly arable farmland with coal mining, sand/ aggregate and shale extraction close to the river. The water quality is classed as fair to good but there is some contamination from mine drainage and sewage inputs. The Wear has been sampled about half way along its length.
The Humber Rivers drain Carboniferous to Permian
sedimentary rocks (primarily sandstones, grits, and limestones) in the upland areas to the west and Jurassic and Cretaceous sandstone and limestone in the lowland areas. There are contrasting land use patterns for the rivers to the north and south of the Humber Basin. In the northern half of the Humber basin, the rivers drain moorland near their sources to agricultural land in the lowland. The main northern river in the Humber basin is the Ouse. This has been sampled on the main stem above the tidal limit at two sites, one just upstream (Clifton Bridge: Ouse 1) and the other just downstream of York (Acaster: Ouse 2). Tributaries of the Ouse upstream of York have also been sampled: two on the Swale at the upland-lowland transition at Catterick (Swale 1), one near its junction with the Ure tributary at Boroughbridge (Swale 2) and one each on the Ure and the Nidd. Two main tributaries to the Ouse enter the system within the tidal estuary; they are the Wharf and the Derwent and have also been monitored near the estuary. The water quality of the Ouse and its tributaries is generally fair to good but the upper parts (especially of one of its tributaries, the Swale) have been influenced by mining activity. The Derwent has been influenced by agriculture and urban sources of nutrients. For the southern half of the Humber basin, the rivers drain from moorland in the Pennines to the east through the industrial heartland of north-eastern and central England. They comprise the Aire, its tributary the Calder, the Don and the Trent. The main southern rivers have been monitored near the estuary (near its junction with the Aire in the case of the Calder). For the southern Humber Rivers, water quality is poorer than in the north in respect of point source pollutants (nutrients, micro-organics and metals).
The Great Ouse in the southern part of the English
Midlands and the fenland area drains lower and middle Jurassic limestones and clays, Cretaceous chalk and greensand. The river flows through one of the main agricultural areas of south-eastern England. The sampling point is about half way along the river length. The water quality of the area is moderate to good.
The Thames is the major river draining southern-central
and south-east England. There is one monitoring site about half way along its length between the towns of Oxford and Reading. The upper Thames basin is a large rural farming area with market and light-industrial towns upstream. The bedrock comprises sedimentary strata (Oolitic limestone through to Oxford clays). The water quality of the area is moderate to good.
For both the Great Ouse and the Thames, the main source of water in the rivers is from permeable aquifers. A summary of the water quality of the study areas together with details of the monitoring programme, including start and end dates, is in Neal and Robson (2000).
Chemical analysis
River water samples were collected weekly, for a period of one to five years, in filtered and unfiltered form. The samples were collected wherever possible mid-stream from bridges to ensure that main flows were sampled. All samples were stored in acid washed bottles. Filtration was through 0.45 mm filter circles. For trace element analysis, filtered and unfiltered samples were acidified with concentrated high purity nitric acid (1% v/v acid). For the filtered samples, acidification avoided sample deterioration during storage prior to analysis. For the unfiltered samples, the acid was used to leach the acid available fraction associated with suspended sediment (SS). The acidified unfiltered samples were left overnight to equilibrate. The waters were then filtered the next day and processed in the same way as the other samples.
The samples were analysed for a wide range of major, minor and trace elements using a variety of wet chemical, electrochemical and colourimetric approaches (Leeks et al., 1997). For the acid-leached unfiltered samples, the AAP fraction was calculated as the difference between the concentrations for the assayed acidified/filtered and the filtered/acidified samples (Neal et al., 1996). Here the term acid available particulate is used as it is consistent with earlier references to the data. It corresponds to the term acid available soluble that is also used in the literature.
inductively coupled plasma mass spectrometry (ICPMS) using an indium internal standard. The analytical protocols gave a detection limit with three sigma for the REE of 0.05 mg l1. For the calculations and the plots, the raw data were
used to avoid rounding errors. Values are reported as averages to the nearest 0.01 mg l1 because hundreds of
results had been averaged. Within the tables only average and maximum values are quoted to avoid issues of detection level for the lower concentrations. The REE elements determined were Y, La, Ce, Nd, Sm and Gd: Sc was also assayed but the data may be incorrect due to potential interference effects (Stetzenback et al., 1994): hence these data are not presented here.
Filtration to 0.45 mm comprises not just truly dissolved components, but also the micro-particulate/colloidal fraction that can be extremely important (Elderfield et al., 1990; Dupré et al., 1996; Lyvén et al., 2003; Neal et al., 1996; Sholkovitz, 2002; Shand et al., 2005). This particulate/ colloidal fraction is especially important for the lighter lanthanides (Shand et al., 2005) on which this paper is focused. Here, the term dissolved describes this 0.45 mm filterable fraction. For this study, in the dissolved phase, iron (Fe) was used as a marker for the microparticulate/ colloid component as the Fe concentrations were substantially greater than solubility controls would allow and there is strong indirect evidence (Neal et al., 1996, 1997).
The REE in the particulate phase might be expected to correspond to crustal averages given their usually low mobility within surface waters. Here, a yardstick for this
crustal background is based on data on Post Achaean Australian Average Shale which seems to be a standard in much of the rare earth research (PAAS: McLennan, 1989). The values used represent a guide reference as mobilisation processes can occur.
Results
Table 1 and 2 provide dissolved and AAP REE averages, respectively, for the individual rivers monitored and Table 3 summarises this information. For these and later tables, occasional outlier data are excluded. For the dissolved REE, there are 13 particularly high La values for the Great Ouse, Thames, and Wear (2, 7 and 4 data points respectively). Table 4 summarises the average dissolved, AAP and total (dissolved plus AAP) concentrations for data subdivided into four key typologies:
(1) The rural Tweed.
(2) The rural Humber that includes the Ouse basin with historic contaminated land and flood plains from mining of the north Pennine ore field, especially for the Swale basin.
(3) The agricultural rivers (Derwent, Great Ouse, Thames). (4) The urban/industrial rivers (Aire, Calder, Don and Trent). The Wear is excluded from the averaging as it is a distinct case but the data for the Wear are presented with the other rivers within other tables. The salient features are as follows.
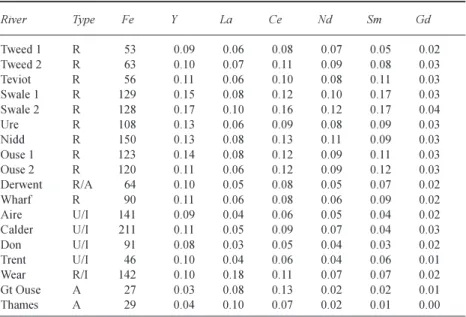
Table 1. The average dissolved REE concentrations in eastern UK rivers (mg l1).
A = Agricultural, I=Industrial. R=Rural and U=Urban. For the Great Ouse, Thames and Wear, occasional outlier points for lanthanum are excluded.
River Type Fe YLa Ce Nd Sm Gd
Tweed 1 R 53 0.09 0.06 0.08 0.07 0.05 0.02 Tweed 2 R 63 0.10 0.07 0.11 0.09 0.08 0.03 Teviot R 56 0.11 0.06 0.10 0.08 0.11 0.03 Swale 1 R 129 0.15 0.08 0.12 0.10 0.17 0.03 Swale 2 R 128 0.17 0.10 0.16 0.12 0.17 0.04 Ure R 108 0.13 0.06 0.09 0.08 0.09 0.03 Nidd R 150 0.13 0.08 0.13 0.11 0.09 0.03 Ouse 1 R 123 0.14 0.08 0.12 0.09 0.11 0.03 Ouse 2 R 120 0.11 0.06 0.12 0.09 0.12 0.03 Derwent R/A 64 0.10 0.05 0.08 0.05 0.07 0.02 Wharf R 90 0.11 0.06 0.08 0.06 0.09 0.02 Aire U/I 141 0.09 0.04 0.06 0.05 0.04 0.02 Calder U/I 211 0.11 0.05 0.09 0.07 0.04 0.03 Don U/I 91 0.08 0.03 0.05 0.04 0.03 0.02 Trent U/I 46 0.10 0.04 0.06 0.04 0.06 0.01 Wear R/I 142 0.10 0.18 0.11 0.07 0.07 0.02 Gt Ouse A 27 0.03 0.08 0.13 0.02 0.02 0.01 Thames A 29 0.04 0.10 0.07 0.02 0.01 0.00
Table 2. Average SS and acid available particulate concentrations of Fe and REE (mg l1) in
rivers of eastern UK. For the Aire and Great Ouse, an anomalous high value is excluded in each case. SS Fe YLa Ce Nd Sm Gd Tweed 1 11.5 79 0.08 0.10 0.19 0.13 0.03 0.03 Tweed 2 21.4 97 0.15 0.15 0.33 0.19 0.05 0.06 Teviot 12.9 75 0.14 0.09 0.23 0.16 0.04 0.05 Swale 1 16.1 136 0.13 0.08 0.18 0.13 0.05 0.04 Swale 2 26.6 226 0.32 0.20 0.46 0.33 0.12 0.11 Ure 13.9 141 0.14 0.08 0.19 0.13 0.04 0.05 Nidd 12.9 167 0.14 0.09 0.22 0.16 0.05 0.05 Ouse 1 21.9 236 0.25 0.16 0.37 0.26 0.10 0.09 Ouse 2 23.9 292 0.29 0.18 0.43 0.30 0.10 0.10 Derwent 13.1 307 0.21 0.15 0.34 0.21 0.06 0.07 Wharf 12.3 134 0.16 0.09 0.20 0.14 0.05 0.05 Aire 22.1 573 0.32 0.19 0.44 0.30 0.09 0.10 Calder 20.5 607 0.26 0.15 0.35 0.24 0.07 0.08 Don 27.4 701 0.37 0.18 0.47 0.29 0.09 0.12 Trent 18.9 207 0.27 0.18 0.41 0.27 0.07 0.08 Wear 6.3 159 0.19 0.15 0.22 0.14 0.09 0.05 Gt Ouse 9.5 85 0.08 0.06 0.16 0.09 0.02 0.02 Thames 13.0 99 0.11 0.09 0.26 0.14 0.03 0.04
Table 3. Summary statistics for average and ranges in REE concentrations (mg l1) in dissolved and acid available forms in eastern UK rivers. The
particulate data excludes two anomalously high data points, one each for the Aire and Great Ouse.
YLa Ce Nd Sm Gd
DISSOLVED
Average 0.11 0.10 0.10 0.07 0.08 0.02
Range in maximum 0.10 to 1.73 0.23 to 3.63 0.40 to4.89 0.09 to1.09 0.04 to0.98 0.04 to1.01 PARTICULATE
Average 0.21 0.14 0.32 0.21 0.07 0.07
Range in maximum 4.24 to 7.08 0.63 to 4.21 1.66 to 10.88 0.90 to 7.72 0.19 to 3.17 0.20 to 2.20 % DISSOLVED
% Dissolved 33 42 23 25 54 26
DISSOLVED Y AND THE LANTHANIDES
Dissolved Y and lanthanide concentrations average around 0.09 mg l-1 (averages 0.11, 0.10, 0.10, 0.07 and 0.08 mg l1,
for Y, La, Ce, Nd, and Sm, respectively), while the average concentration for Gd is about a fifth of this value (0.02 mg l1) and lower than the detection limit for a single
measurement.
In general, average values are less than a tenth of the corresponding maximum across the group. The dissolved concentrations are highest mainly for the rural rivers of the Tweed and Humber and lowest for the urban/industrial rivers. The variations in average dissolved concentrations are typically less than a factor of two and there is often some overlap in concentration for the different catchment typologies. The greatest difference is for the Great Ouse and the Thames where Y, Nd, Sm and Gd as well as Fe concentrations are particularly low. Lanthanum, in contrast, has particularly high concentrations for the Wear.
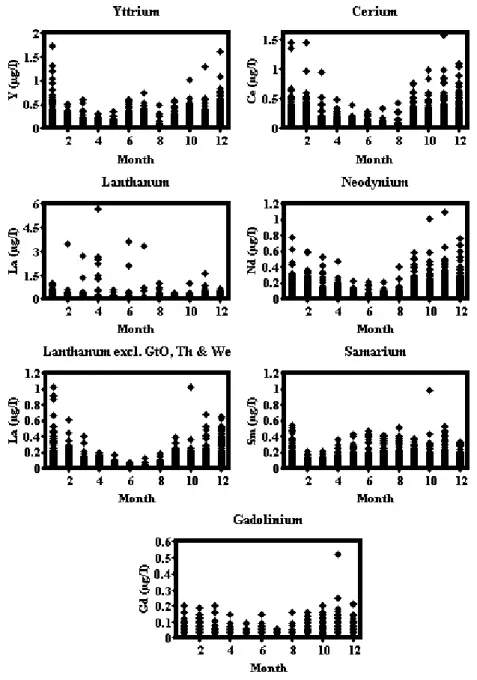
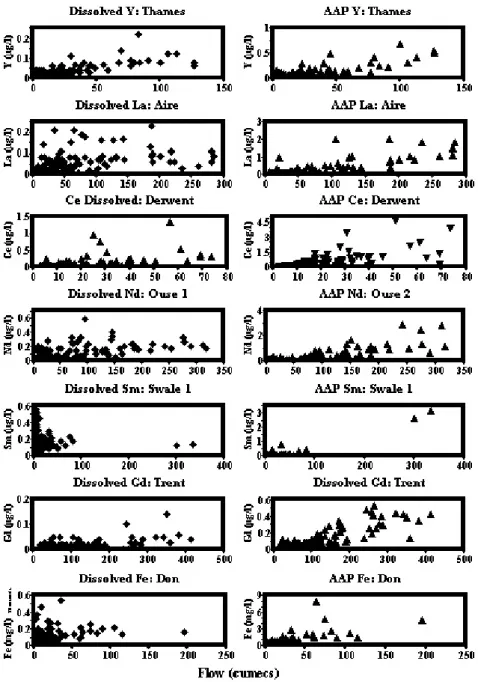
Higher dissolved Y and lanthanide concentrations occurred during the autumn and winter periods (Fig. 2). There is a significant linear relationship between Y and lanthanide concentrations and flow, apart from Sm that shows high values at low flows in the Swale and the Ouse (Fig. 3). In the Great Ouse and Thames some exceptionally high concentrations of lanthanum occur in the spring and summer months (Fig. 2); clearly, there are pollutant sources for these rivers and inclusion of La concentrations above 1.00 mg l1 nearly doubles the average values for these
exceptional rivers. There is no clear relationship between these outlier points and other chemical and physical characteristics measured. For Sm, there seems to be a mixture of a seasonal winter maximum concentration and an additional peak during the summer. However, when plots for averaged monthly dissolved Sm data are made for the individual locations (Fig. 4), site-to-site variations become apparent. The highest Sm concentrations occur for the Swale
and, to a lesser extent, the Ouse, which are influenced by contamination of the land and flood-plain by historic mining of the Pennine ore-field. The Swale and Ouse have the clearest winter and the summer peaks. This may indicate not only supplies of Sm from high-flow inputs but also diffusion of Sm from the flood plain and river bottom sediments during the summer low-flow periods. A similar feature occurs for the Tweed, the Ure and perhaps the Thames and Trent but in most cases the summer maxima are smaller than the winter maxima. For the Nidd and the urban/industrial rivers, only the winter maxima occurred. There is seasonality for the Great Ouse, where the seasonal Sm maxima occur during around April. There is no clear pattern for the Wear.
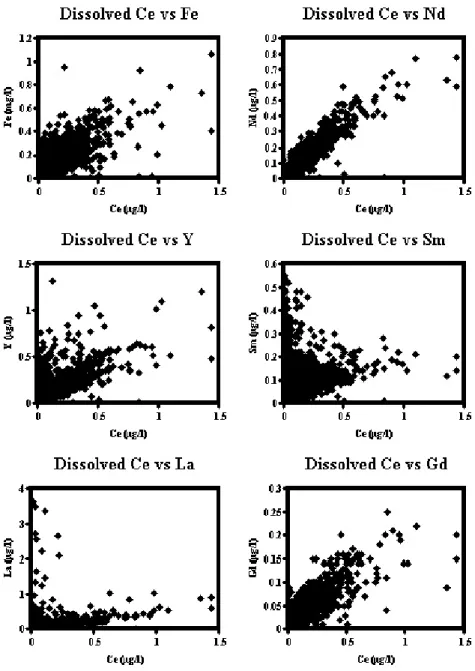
Figure 5 illustrates the general features of the dissolved Y and the lanthanide inter-relationships and Table 5 indicates the variations in the ratios of REE to Fe. A correlation analysis was undertaken for Y and the lanthanides with all the other water quality determinands; the results showed statistically significant linear relationships with Fe. For the Great Ouse, Thames and Wear, there is a high scatter for La and Ce relative to Y and the other lanthanides; this corresponds with pollutant sources for La and Ce in these rivers. There are high ratios of La and Ce to Fe in the Great Ouse and the Thames, but the high ratio reflects relatively low Fe concentrations. Neodymium, Sm and Gd are low in
concentration, but not in terms of their ratio with Fe. In the Ouse system with its catchment and flood plain contamination when flows are low, Samarium concentrations are relatively high at low concentrations of the other REE. This is also indicated by the relatively high Sm to Fe ratio for these rivers, especially at times of low flow. The highest Y/Fe ratios and a significant proportion of the high values on the plot relate to the Trent.
AAP RELATIONSHIPS
The highest AAP REE concentrations occur for the urban/ industrial rivers with average concentrations typically twice those of the rural rivers (Table 4). The greater the SS concentration, the greater is the AAP concentration and both are approximately linearly correlated with flow (Fig. 3). In general, the concentrations in the AAP fraction of the SS are in the order urban/industrial>rural Humber>agricultural
y
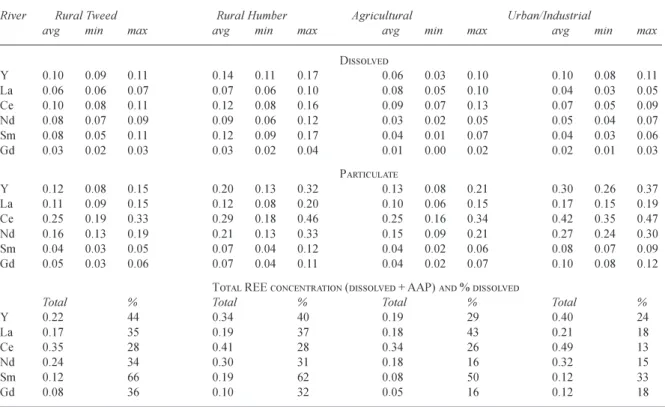
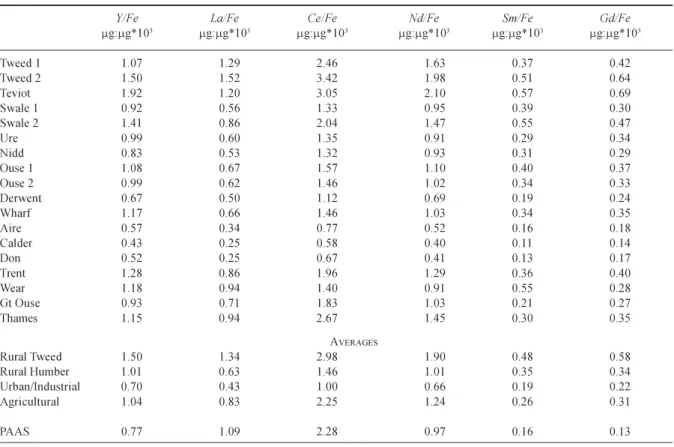
rural Tweed (Table 6). The largest difference occurs for Fe (a five-fold factor), followed by Y (60% difference), with smaller changes for La, Ce, Nd and Gd. The data are skewed towards lower concentrations. The AAP REE concentrations are strongly correlated between each other and with AAP Fe (Fig. 6). However, REE to Fe ratios differ by up to a factor of six (Table 7). On average, the ratios are similar to those of standard shale (within a factor of 2.67) but theyTable 4. Averages and ranges in average REE concentrations for the rural Tweed (3 sites), Rural Humber (7 sites), agricultural (3 sites) and urban/industrial (4 sites) rivers
River Rural Tweed Rural Humber Agricultural Urban/Industrial
avg min max avg min max avg min max avg min max
DISSOLVED Y 0.10 0.09 0.11 0.14 0.11 0.17 0.06 0.03 0.10 0.10 0.08 0.11 La 0.06 0.06 0.07 0.07 0.06 0.10 0.08 0.05 0.10 0.04 0.03 0.05 Ce 0.10 0.08 0.11 0.12 0.08 0.16 0.09 0.07 0.13 0.07 0.05 0.09 Nd 0.08 0.07 0.09 0.09 0.06 0.12 0.03 0.02 0.05 0.05 0.04 0.07 Sm 0.08 0.05 0.11 0.12 0.09 0.17 0.04 0.01 0.07 0.04 0.03 0.06 Gd 0.03 0.02 0.03 0.03 0.02 0.04 0.01 0.00 0.02 0.02 0.01 0.03 PARTICULATE Y 0.12 0.08 0.15 0.20 0.13 0.32 0.13 0.08 0.21 0.30 0.26 0.37 La 0.11 0.09 0.15 0.12 0.08 0.20 0.10 0.06 0.15 0.17 0.15 0.19 Ce 0.25 0.19 0.33 0.29 0.18 0.46 0.25 0.16 0.34 0.42 0.35 0.47 Nd 0.16 0.13 0.19 0.21 0.13 0.33 0.15 0.09 0.21 0.27 0.24 0.30 Sm 0.04 0.03 0.05 0.07 0.04 0.12 0.04 0.02 0.06 0.08 0.07 0.09 Gd 0.05 0.03 0.06 0.07 0.04 0.11 0.04 0.02 0.07 0.10 0.08 0.12
TOTAL REE CONCENTRATION (DISSOLVED + AAP) AND % DISSOLVED
Total % Total % Total % Total %
Y 0.22 44 0.34 40 0.19 29 0.40 24 La 0.17 35 0.19 37 0.18 43 0.21 18 Ce 0.35 28 0.41 28 0.34 26 0.49 13 Nd 0.24 34 0.30 31 0.18 16 0.32 15 Sm 0.12 66 0.19 62 0.08 50 0.12 33 Gd 0.08 36 0.10 32 0.05 16 0.12 18
Fig. 2. Seasonal variations in dissolved rare earths concentrations for eastern UK rivers.
tend to be lower for the urban and industrial Aire, Calder and Don. This feature probably reflects higher anthropogenic sources/mobilisation of Fe from contaminated landfill and other brown-field sites. In the case of the urban/industrial Trent, the REE/Fe ratio is higher and the AAP Fe content to the sediments is lower. For the Trent, there will be greater fractionation of the sediments as much of the industrial activity is in the upper half of the basin while the monitoring point is in the lower stretches of the river.
TOTAL-DISSOLVED-AAP REE RELATIONSHIPS
The total (dissolved plus AAP) REE concentrations vary
across the sites. For Y, Ce, Nd and Gd, the sequence is urban/ industrial>rural Humber>rural Tweed
y
agricultural and on average 46 to 77% of the total REE concentrations are in the particulate phase. A similar sequence is observed for Sm except that there is marked enhancement in concentration for the rural Humber where the highest total Sm concentration occurs. For La, there is little variation in total concentration across the sites.There are some similarities between the dissolved and AAP ratios of Y and the lanthanides to Fe for the different rivers (Table 5 and 7). For example, the two sets of ratios are relatively high for the Tweed, intermediate for the rural Humber Rivers and relatively low for the urban/industrial
Fig. 3. Examples of dissolved and AAP concentration variations with flow for eastern UK rivers.
Aire, Calder and Don, but not the Trent. In the case of Sm, there are also relatively high ratios in the AAP fraction. For comparative purposes, the relative difference, RR, between
the REE/Fe in the dissolved and REE/Fe in the AAP fractions (RR = RREE:Fe river/RREE:Fe AAP) (Table 9) is as follows:
l For Y, RR averages around 1.2 for the different types of
river (total range in average 0.61 to 2.21) and, thus, there is a broad similarity in the ratio to Fe for the dissolved and particulate phase.
l For La, Ce, Nd and Gd, across the rural Tweed, the
rural Humber and the urban/industrial Humber, RR for
La is close to unity, while for Ce, Nd and Gd the values
are typically lower at around 0.6.
l For La, Ce, Nd and Gd, the results for the Great Ouse
and Thames differ from the rural Tweed, the rural Humber and the urban/industrial Humber. In particular, the RR for La is four times higher and for Ce around 2.5
times higher for the agricultural rivers compared to the rest. The average values for RR for these two rivers are
3.89 and 1.74 respectively. Clearly there is a relative enrichment of La and Ce in the dissolved form. For Nd and Gd, RR is moderately lower for these rivers with
values averaging 0.54 in both cases.
l For Sm, RR varies between 2.3 and 3.0, significantly
Fig. 4. Seasonal variations in average dissolved samarium concentration for eastern UK rivers.
Discussion
The dissolved REE concentrations in the eastern UK rivers are similar to those for global rivers; the averages between the two datasets are typically within a factor of two (Table 2). The REE AAP concentrations for the present study are generally lower than the REE content of standard shales. (Table 6). However, this difference is to be expected since in the case of standard shale, total is measured rather than just the AAP fraction. Thus, the SS will have the AAP REE component diluted by fractions that will not dissolve in the acid extraction when the data are normalised to the SS concentration. Normalising the AAP REE concentrations to Fe provides ratios that are typically within a factor of two to four times that of standard shale: the average differences are factors of 1.34 for Y, 0.65 for La, 0.74 for Ce, 1.14 for Nd, 3.11 for Sm and 2.66 for Gd. There are two outlier points of Gd/Fe of 5.31 for the Teviot which atypically has highly metamorphosed and granitic rocks and
Sm/Fe for the Wear which is atypical because of mine drainage.
While there is scatter in the data, the variability in REE concentrations across the sites is linked to the relative inputs of background and pollutant sources. Despite the differences, there is no dominant pollutant signal across the sites other than occasionally for La and Ce on the Wear, Great Ouse and Thames. Indeed, even for the Great Ouse and Thames, with the high La and Ce ratios to Fe, the main reason for the difference seems to rest with relatively low Fe concentrations. Correspondingly, the low Y and lanthanide ratios to Fe for the urban and industrial Aire, Calder and Don seem to reflect a high anthropogenic Fe component that leads to a reduction in the ratio. Mobilisation of Sm seems to occur in relation to historic mining activities in the Swale and Ouse. These features may be related to redox and pH controls in the river in terms of REE and Fe mobilisation/precipitation.
Fig. 5. Dissolved REE interrelationships for eastern UK rivers.
AAP REE makes up a significant proportion of the average total concentration. In terms of load, the proportion will be even higher because high SS (and hence high AAP) will be associated with high energy conditions within the river when flow is high. This will have a bearing on the contribution to the overall flux of the relative pollutant and background sources of the REE. For the urban and industrial rivers, the Y and lanthanide AAP component is particularly important, both in terms of SS concentration and higher AAP concentration in the SS. For Y and the lanthanides, a dominant control seems to be the micro-particulate/colloidal component of the dissolved phase and the SS. The dissolved REE probably have a large microparticulate and colloidal fraction. This is indicated from previous studies (Shand et
al., 2005) and in the present study by (a) positive relationships of the dissolved REE with Fe and (b) positive relationships of the dissolved REE with flow.
48 to 60% of the REE load to the Humber, in both dissolved and AAP form comes from the industrial/urban rivers (Neal and Davies, 2003). This load corresponds approximately to the proportion of water flux for the urban/ industrial rivers and the proportion of the dissolved flux is typically of the order of 10 to 20%.
The study flags the value of broadening the chemical analysis within programmes such as the LOIS, for nominal costs. The data in this case add to the database and to an understanding of the hydrogeochemistry of the REE in UK rivers; it extends the studies towards the examination of a
cross-section of typologies, including polluted systems. The work complements regional hydrogeochemical studies of baseflow (BGS 1999) and covers a much fuller spectrum of flows. Hopefully, it will stimulate studies in the region to examine (a) REE microparticulate/colloidal behaviour, (b) REE speciation in truly dissolved form, (c) the interrelationship between a and b, and (d) hydrogeochemical links of REE to Fe and redox controls.
References
Bau, M. and Dulski, P., 1996. Anthropogenic origin of positive gadolinium anomalies in river waters. Earth Planet. Sci. Lett.,
143, 245255.
Brookings, D.G., 1989. Aqueous geochemistry of rare earth elements. Rev. Min., 21, Min Soc. Amer., 201226.
BGS, 1999. Regional geochemistry of Wales and part of
west-central England: stream chemistry. British Geological Survey,
Keyworth, Nottingham, UK. 110pp.
Dupre, B., Gaillardet, J., Rousseau, D. and Allegre, J., 1996. Major and trace elements of river-bourne material: the Congo Basin.
Geochim. Cosmochim. Acta, 60, 13011321.
Elderfield, H., Upstill-Goddard, R. and Sholkovitz, E.R., 1990. The rare earth elements in rivers, estuaries, and coastal seas and their significance to the composition of ocean waters.
Geochim. Cosmochim. Acta, 54, 971992.
Gaillardet, J., Viers, J. and Dupré, B., 2003. Trace elements in river waters. In: Treatise on Geochemistry: vol. 5 Surface and
groundwater, weathering and soils, J.I Drever (Ed.), 225272. Gerard, M., Seyler, P., Benedetti, M.F., Alves, V.P., Boaventura, G.R. and Sondag, F., 2003. Rare earth elements in the Amazon basin. Hydrol. Process., 17, 13791392.
Greenwood, N.N. and Ernshaw, A., 2005. Chemistry of the
elements. Elsevier, Amsterdam, The Netherlands. 1342pp.
Goldschmidt, V.M., 1958. Group IIIa, Scandium. In: Geochemistry
by the late V.M. Goldschmidt, A. Muir (Ed.), Oxford University
Press, Oxford, UK. 303305.
Johannesson, K.H., Tang, J.W., Daniels, J.M., Bounds, W.J. and Burdige, D.J., 2004. Rare earth element concentrations and speciation in organic-rich blackwaters of the Great Dismal Swamp, Virginia, USA. Chem. Geol., 209, 271294.
Leeks, G.J.L. and Jarvie, H.P., 1998. Introduction to the Land-Ocean Interaction Study (LOIS): rationale and international context. Sci. Total Envir., 210/211, 520.
Leeks, G.J.L., Neal, C., Jarvie, H.P., Casey, H. and Leach, D.V., 1997. The LOIS rivers monitoring network; strategy and implementation. Sci. Total Envir., 194/195, 101110.
Lyvén, B., Hassellöv, M., Turner, D.R., Haraldsson, C. and Andersson, K., 2003. Competition between iron- and carbon-based colloidal carriers for trace metals in a freshwater assessed using flow field-flow fractionation coupled to ICPMS. Geochim.
Cosmochim. Acta, 67, 37913802.
McLennan, S.M., 1989. Rare earth elements in sedimentary rocks: influence of provenance and sedimentary processes. Rev. Min.,
21, Min Soc. Amer., 169200.
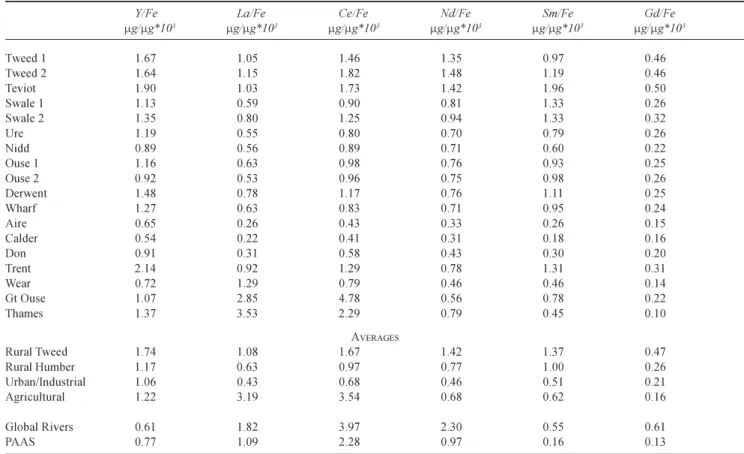
Table 5. Dissolved REE ratios to Fe for in eastern UK rivers. For the Great Ouse, Thames and Wear, occasional outlier points for lanthanum have been excluded. The values are compared with averages for global rivers (data from Gaillardet et al., 2003) and average shales (PAAS, McLennan, 1989).
Y/Fe La/Fe Ce/Fe Nd/Fe Sm/Fe Gd/Fe
mg/mg*103 mg/mg*103 mg/mg*103 mg/mg*103 mg/mg*103 mg/mg*103 Tweed 1 1.67 1.05 1.46 1.35 0.97 0.46 Tweed 2 1.64 1.15 1.82 1.48 1.19 0.46 Teviot 1.90 1.03 1.73 1.42 1.96 0.50 Swale 1 1.13 0.59 0.90 0.81 1.33 0.26 Swale 2 1.35 0.80 1.25 0.94 1.33 0.32 Ure 1.19 0.55 0.80 0.70 0.79 0.26 Nidd 0.89 0.56 0.89 0.71 0.60 0.22 Ouse 1 1.16 0.63 0.98 0.76 0.93 0.25 Ouse 2 0.92 0.53 0.96 0.75 0.98 0.26 Derwent 1.48 0.78 1.17 0.76 1.11 0.25 Wharf 1.27 0.63 0.83 0.71 0.95 0.24 Aire 0.65 0.26 0.43 0.33 0.26 0.15 Calder 0.54 0.22 0.41 0.31 0.18 0.16 Don 0.91 0.31 0.58 0.43 0.30 0.20 Trent 2.14 0.92 1.29 0.78 1.31 0.31 Wear 0.72 1.29 0.79 0.46 0.46 0.14 Gt Ouse 1.07 2.85 4.78 0.56 0.78 0.22 Thames 1.37 3.53 2.29 0.79 0.45 0.10 AVERAGES Rural Tweed 1.74 1.08 1.67 1.42 1.37 0.47 Rural Humber 1.17 0.63 0.97 0.77 1.00 0.26 Urban/Industrial 1.06 0.43 0.68 0.46 0.51 0.21 Agricultural 1.22 3.19 3.54 0.68 0.62 0.16 Global Rivers 0.61 1.82 3.97 2.30 0.55 0.61 PAAS 0.77 1.09 2.28 0.97 0.16 0.13
Table 6. AAP REE concentrations normalized to suspended sediments for eastern UK rivers. Average values are also provided for the rural Tweed and the
rural Humber rivers, the urban/industrial rivers and agricultural river systems.
Fe YLa Ce Nd Sm Gd g/g*103 g/g*106 g/g*106 g/g*106 g/g*106 g/g*106 g/g*106 Tweed 1 6.9 7.3 8.8 16.9 11.2 2.5 2.9 Tweed 2 4.5 6.8 6.9 15.4 8.9 2.3 2.9 Teviot 5.8 11.2 7.0 17.8 12.2 3.3 4.0 Swale 1 8.4 7.8 4.7 11.2 8.0 3.3 2.5 Swale 2 8.5 12.0 7.3 17.3 12.5 4.7 4.0 Ure 10.1 10.1 6.0 13.7 9.3 2.9 3.5 Nidd 12.9 10.8 6.8 17.1 12.0 3.9 3.8 Ouse 1 10.8 11.6 7.2 16.9 11.8 4.3 4.0 Ouse 2 12.2 12.1 7.5 17.8 12.4 4.1 4.1 Derwent 23.4 15.8 11.6 26.3 16.2 4.5 5.6 Wharf 10.9 12.6 7.2 15.9 11.2 3.6 3.8 Aire 25.9 14.6 8.8 20.0 13.4 4.2 4.7 Calder 29.5 12.7 7.3 17.2 11.8 3.2 4.0 Don 25.6 13.3 6.4 17.1 10.6 3.4 4.2 Trent 11.0 14.1 9.4 21.6 14.2 3.9 4.4 Wear 25.4 30.1 24.0 35.7 23.0 13.9 7.2 Gt Ouse 8.9 8.4 6.3 16.4 9.2 1.9 2.4 Thames 7.6 8.7 7.1 20.3 11.0 2.3 2.7 AVERAGES Rural Tweed 5.7 8.4 7.6 16.7 10.8 2.7 3.3 Rural Humber 12.2 11.6 7.3 17.0 11.7 3.9 3.9 Urban/Industrial 23.0 13.7 8.0 19.0 12.5 3.7 4.3 Agricultural 8.3 8.6 6.7 18.4 10.1 2.1 2.6 PAAS 35.0 27.0 38.2 79.6 33.9 5.55 4.66
Table 7. AAP REE to Fe ratios for eastern UK rivers. One outlier point each for the Aire and the Great Ouse is excluded from the averages.
Y/Fe La/Fe Ce/Fe Nd/Fe Sm/Fe Gd/Fe
mg:mg*103 mg:mg*103 mg:mg*103 mg:mg*103 mg:mg*103 mg:mg*103 Tweed 1 1.07 1.29 2.46 1.63 0.37 0.42 Tweed 2 1.50 1.52 3.42 1.98 0.51 0.64 Teviot 1.92 1.20 3.05 2.10 0.57 0.69 Swale 1 0.92 0.56 1.33 0.95 0.39 0.30 Swale 2 1.41 0.86 2.04 1.47 0.55 0.47 Ure 0.99 0.60 1.35 0.91 0.29 0.34 Nidd 0.83 0.53 1.32 0.93 0.31 0.29 Ouse 1 1.08 0.67 1.57 1.10 0.40 0.37 Ouse 2 0.99 0.62 1.46 1.02 0.34 0.33 Derwent 0.67 0.50 1.12 0.69 0.19 0.24 Wharf 1.17 0.66 1.46 1.03 0.34 0.35 Aire 0.57 0.34 0.77 0.52 0.16 0.18 Calder 0.43 0.25 0.58 0.40 0.11 0.14 Don 0.52 0.25 0.67 0.41 0.13 0.17 Trent 1.28 0.86 1.96 1.29 0.36 0.40 Wear 1.18 0.94 1.40 0.91 0.55 0.28 Gt Ouse 0.93 0.71 1.83 1.03 0.21 0.27 Thames 1.15 0.94 2.67 1.45 0.30 0.35 AVERAGES Rural Tweed 1.50 1.34 2.98 1.90 0.48 0.58 Rural Humber 1.01 0.63 1.46 1.01 0.35 0.34 Urban/Industrial 0.70 0.43 1.00 0.66 0.19 0.22 Agricultural 1.04 0.83 2.25 1.24 0.26 0.31 PAAS 0.77 1.09 2.28 0.97 0.16 0.13
Neal, C., 2001. The water quality of eastern UK rivers: the study of a highly heterogeneous environment. In: Land Ocean
Interaction: measuring and modelling fluxes from river basins to coastal seas, D.A. Huntley, G.J.L. Leeks and D.E. Walling
(Eds.). IWA Publishing (London), 69104.
Neal, C., 2005. Lanthanum, cerium, praseodymium and yttrium in waters in an upland acidic and acid sensitive environment, mid-Wales. Hydrol. Earth Syst. Sci., 9, 645656.
Neal, C. and Davies, H., 2003. Water quality fluxes for eastern UK rivers entering the North Sea: a summary of information from the Land Ocean Interaction Study (LOIS). Land Ocean Interaction: Processes, Functioning and Environmental Management: a UK Perspective. Sci. Total Envir., 314-316, 821 882.
Neal, C. and Robson, A.J., 2000. A summary of river water quality data collected within the Land Ocean Interaction Study: core data for Eastern UK rivers draining to the North Sea. Sci. Total
Envir., 251/252, 585665.
Neal, C., Smith, C.J., Jeffery, H.A., Jarvie, H.P. and Robson, A.J., 1996. Trace element concentrations in the major rivers entering the Humber estuary, N.E. England. J. Hydrol., 182, 3764. Neal, C., Robson, A.J., Jeffery H.A., Harrow, M.L., Neal, M.,
Smith, C.J. and Jarvie, H.P., 1997. Trace element inter-relationships for the Humber rivers: inferences for hydrological and chemical controls. Sci. Total Envir., 194/195, 321343. Neal, C., Jarvie, H.P., Whitton, B.W. and Gemmell, J., 2000a.
The water quality of the River Wear. Sci. Total Envir., 251/252, 153172.
Neal, C., Jarvie, H.P., Williams, R.J., Pinder, L.C.V., Collett, G.D. and Neal, M., Bhardwaj, L. 2000b. The water quality of the Great Ouse. Sci. Total Envir.., 251/252, 423440.
Neal, C., Williams, R.J., Neal, M., Bhardwaj, L.C., Wickham, H., Harrow, M. and Hill, L.K. 2000c. The water quality of the River Thames at a rural site downstream of Oxford. Sci. Total Envir.,
251/252, 441458.
Table 8. Particulate Fe and REE ratios to Ce for eastern UK rivers. One outlier point each for the Aire and the Great Ouse is excluded from the averages.
Fe/Ce Y/Ce La/Ce Nd/Ce Sm/Ce Gd/Ce
µg/µg µg/µg µg/µg µg/µg µg/µg µg/µg Tweed 1 410 0.44 0.52 0.66 0.15 0.17 Tweed 2 290 0.44 0.45 0.58 0.15 0.19 Teviot 330 0.63 0.39 0.69 0.19 0.23 Swale 1 750 0.69 0.42 0.72 0.29 0.23 Swale 2 490 0.69 0.42 0.72 0.27 0.23 Ure 740 0.74 0.44 0.68 0.22 0.25 Nidd 760 0.63 0.40 0.70 0.23 0.22 Ouse 1 640 0.69 0.43 0.70 0.26 0.24 Ouse 2 690 0.68 0.42 0.70 0.23 0.23 Derwent 890 0.60 0.44 0.62 0.17 0.22 Wharf 680 0.80 0.45 0.70 0.23 0.24 Aire 1300 0.73 0.44 0.67 0.21 0.24 Calder 1710 0.74 0.42 0.69 0.18 0.23 Don 1500 0.78 0.37 0.62 0.20 0.25 Trent 510 0.65 0.44 0.66 0.18 0.20 Wear 710 0.84 0.67 0.65 0.39 0.20 Gt Ouse 550 0.51 0.39 0.56 0.12 0.15 Thames 370 0.43 0.35 0.54 0.11 0.13 AVERAGES Rural Tweed 340 0.50 0.45 0.64 0.16 0.20 Rural Humber 710 0.69 0.43 0.69 0.24 0.23 Urban/Industrial 1260 0.73 0.42 0.66 0.19 0.23 Agricultural 460 0.47 0.37 0.55 0.12 0.14 PAAS 200 0.48 0.43 0.43 0.07 0.48
Table 9. Ratios of the ratios of REE/Fe in dissolved and particulate phases for eastern UK rivers. Outlier points for particulate
concentrations with the Aire and Great Ouse are excluded.
Y/Fe La/Fe Ce/Fe Nd/Fe Sm/Fe Gd/Fe
Tweed 1 1.56 0.81 0.59 0.83 2.62 1.10 Tweed 2 1.09 0.76 0.53 0.75 2.33 0.72 Teviot 0.99 0.86 0.57 0.68 3.44 0.72 Swale 1 1.23 1.05 0.68 0.85 3.41 0.87 Swale 2 0.96 0.93 0.61 0.64 2.42 0.68 Ure 1.20 0.92 0.59 0.77 2.72 0.76 Nidd 1.07 1.06 0.67 0.76 1.94 0.76 Ouse 1 1.07 0.94 0.62 0.69 2.33 0.68 Ouse 2 0.93 0.85 0.66 0.74 2.88 0.79 Derwent 2.21 1.56 1.04 1.10 5.84 1.04 Wharf 1.09 0.95 0.57 0.69 2.79 0.69 Aire 1.14 0.76 0.56 0.63 1.63 0.83 Calder 1.26 0.88 0.71 0.78 1.64 1.14 Don 1.75 1.24 0.87 1.05 2.31 1.18 Trent 1.67 1.07 0.66 0.60 3.64 0.78 Wear 0.61 1.37 0.56 0.51 0.84 0.50 Gt Ouse 1.15 4.01 2.61 0.54 3.71 0.81 Thames 1.19 3.76 0.86 0.54 1.50 0.29 AVERAGES Rural Tweed 1.21 0.81 0.56 0.75 2.80 0.85 Rural Humber 1.22 1.03 0.68 0.78 3.04 0.78 Urban/Industrial 1.46 0.99 0.70 0.77 2.31 0.98 Agricultural 1.17 3.89 1.74 0.54 2.61 0.55
Nozaki, Y., Lerche, D., Alibo, D.S. and Tsutsumi, M., 2000b. Dissolved indium and rare earth elements in three Japanese rivers and Tokyo Bay: Evidence for anthropogenic Gd and In.
Geochim. Cosmochim. Acta, 64, 39753982.
Oliva, P., Viers, J., Dupre, B., Fortune, J.P., Martin, F., Braun, J.J., Nahon, D. and Robain, H., 1999. The effect of organic matter on chemical weathering: study of a small tropical watershed: Nsimi-Zoetele site, Cameroon. Geochim.
Cosmochim. Acta, 63, 40134035.
Rengarajan, R. and Sarin, M.M., 2004. Distribution of rare earth elements in the Yamuna and the Chambal rivers, India. Geochem.
J., 38, 551569.
Shand, P., Johannesson, K.H., Chudaev, O., Chudaeva, V. and Edmunds, W.M., 2005. Rare earth element contents of high pCO2 groundwaters of Primorye, Russia: mineral stability and
complexation controls. In: Rare Earth Elements an Groundwater
Systems, K.H. Johannesson (Ed.), Springer. 161186.
Sholkovitz, E.R., 2002. Chemical evolution of rare earth elements: fractionation between colloidal and solution phases in filtered river water. Earth Planet. Sci. Lett., 114, 7784.
Stetzenback, K.J., Amano, M., Kreamer, D.K. and Hodge, V.F., 1994. Testing the limits of ICP-MS: determination of trace elements in groundwater at the parts-per-trillion level. Ground
Water, 32, 976987.
Turner, D.R., Whitfield, M. and Dickson, A.G., 1981. The equilibrium speciation of dissolved components in freshwater and sea water at 25oC and 1 atm pressure. Geochim. Cosmochim. Acta, 45, 855881.
Verplanck, P.L., Taylor, H.E., Nordstrom, D.K. and Barber, L.B., 2005. Aqueous stability of gadolinium in surface waters receiving sewage treatment plant effluent, Boulder Creek, Colorado. Environ. Sci. Technol., 39, 69236929.
Wang, L.J., Liang, T., Ding, L.Q., Zhang, C.S., Li, C.S., Yan, X. and Wang, X.L., 2002. Geochemical characteristics of rare earth elements in sewage discharge channels of Tianjin. J. Rare
Earths, 21, 686690.
Weltje, L., Heidenreich, H., Zhu, W., Wolterbeek, H. Th., Korhammer, S., de Goeif, J.J.M. and Markert, B., 2002. Lanthanide concentrations in freshwater plants and molluscs, related to those in surface water, pore water and sediment. A case study in The Netherlands. Sci. Total Envir., 286, 191 214.
Wilkinson, R.J., Reynolds, B., Neal, C., Hill, S., Neal, M. and Harrow, M.L., 1997. Major, minor and trace element composition of cloud water and rain water at Plynlimon, Mid-Wales. Hydrol. Earth Syst. Sci., 1, 557570.