HAL Id: hal-00298616
https://hal.archives-ouvertes.fr/hal-00298616
Submitted on 13 Jan 2005HAL is a multi-disciplinary open access
archive for the deposit and dissemination of sci-entific research documents, whether they are pub-lished or not. The documents may come from teaching and research institutions in France or abroad, or from public or private research centers.
L’archive ouverte pluridisciplinaire HAL, est destinée au dépôt et à la diffusion de documents scientifiques de niveau recherche, publiés ou non, émanant des établissements d’enseignement et de recherche français ou étrangers, des laboratoires publics ou privés.
Using stable isotope tracers to identify hydrological flow
paths, residence times and landscape controls in a
mesoscale catchment
P. Rodgers, C. Soulsby, S. Waldron, D. Tetzlaff
To cite this version:
P. Rodgers, C. Soulsby, S. Waldron, D. Tetzlaff. Using stable isotope tracers to identify hydrological flow paths, residence times and landscape controls in a mesoscale catchment. Hydrology and Earth System Sciences Discussions, European Geosciences Union, 2005, 2 (1), pp.1-35. �hal-00298616�
HESSD
2, 1–35, 2005 Stable isotope tracers and mesoscale catchment controls P. Rodgers et al. Title Page Abstract Introduction Conclusions References Tables Figures J I J I Back CloseFull Screen / Esc
Print Version Interactive Discussion
EGU
Hydrol. Earth Syst. Sci. Discuss., 2, 1–35, 2005 www.copernicus.org/EGU/hess/hessd/2/1/ SRef-ID: 1812-2116/hessd/2005-2-1 European Geosciences Union
Hydrology and Earth System Sciences Discussions
Using stable isotope tracers to identify
hydrological flow paths, residence times
and landscape controls in a mesoscale
catchment
P. Rodgers1, *, C. Soulsby1, S. Waldron2, and D. Tetzlaff1
1
Department of Geography and Environment, University of Aberdeen, Elphinstone Road, Aberdeen, AB24 3UF, United Kingdom
2
Scottish Universities Environmental Research Centre, Scottish Enterprise Technology Park, East Kilbride, Glasgow, G75 OQF, United Kingdom
*
now at: SEPA, Rivers House, Irongray Road, Dumfries, DG2 OJE, United Kingdom Received: 22 December 2004 – Accepted: 10 January 2005 – Published: 13 January 2005 Correspondence to: P. Rodgers ([email protected])
HESSD
2, 1–35, 2005 Stable isotope tracers and mesoscale catchment controls P. Rodgers et al. Title Page Abstract Introduction Conclusions References Tables Figures J I J I Back CloseFull Screen / Esc
Print Version Interactive Discussion
EGU
Abstract
δ18O tracer measurements of precipitation and stream waters were used to investigate hydrological flow paths and residence times at nested spatial scales in the mesoscale (233 km2) River Feugh catchment in the northeast of Scotland over the 2001–2002 hydrological year. Precipitation δ18O exhibited strong seasonal variation, which
al-5
though significantly damped by catchment mixing processes, was reflected in stream water outputs at six sampling sites. This allowed δ18O variations to be used to in-fer the relative influence of soil-derived storm flows with a seasonally variable isotopic signature, and groundwater of more constant isotopic composition. Periodic regres-sion analysis was then used to examine the sub-catchment differences in the mixing of
10
these two main hydrological sources processes more quantitatively, using an exponen-tial flow model to provide preliminary estimates of mean stream water residence times, which varied between 0.4–2.9 years. This showed that the effects of increasing scale on estimated mean stream water residence time was minimal beyond the smallest (ca. 1 km2) headwater catchment scale. Instead, the interaction of catchment soil cover and
15
topography acted as the dominant influence. Responsive hydrological pathways, asso-ciated with peat soils in the headwater sub-catchments, produced seasonally variable
δ18O signatures in runoff with short mean residence times (0.4–0.8 years). In con-trast, areas dominated by more freely draining soils and larger groundwater storage in shallow aquifers appear to provide effective mixing and damping of variable
precipita-20
tion inputs implying longer residence times (1.4–2.9 years). These insights from δ18O measurements extend the hydrological understanding of the Feugh catchment gained from previous geochemical tracer studies, and demonstrate the utility of isotope tracers in investigating the interaction of hydrological processes and catchment characteristics at the mesoscale.
HESSD
2, 1–35, 2005 Stable isotope tracers and mesoscale catchment controls P. Rodgers et al. Title Page Abstract Introduction Conclusions References Tables Figures J I J I Back CloseFull Screen / Esc
Print Version Interactive Discussion
EGU
1. Introduction
Over the past 2 decades, interpretation of changes in the stable oxygen (18O/16O) isotopic signatures of catchment waters have provided insights as tracers for identify-ing hydrological source areas/flow paths under different flow conditions and estimating mean catchment residence times (Sklash, 1990; Genereux and Hooper, 1998; Burns,
5
2002). To date, most studies have focused on storm event sampling in relatively small (<10 km2) catchments (Buttle, 1994). However, the use of isotope tracers to upscale flow path understanding in mesoscale (ca. 102–103km2) catchments has been scarce (e.g. Skalsh et al., 1976; Turner and Barnes, 1998; Frederickson and Criss, 1999; Uh-lenbrook et al., 2002). Moreover, those few investigations of scale influence on the
10
mean residence time of runoff have generally been restricted to relatively small catch-ments (Brown et al., 1999; McDonnell et al., 1999; McGlynn et al., 2003). This reflects the logistical difficulties of sampling in larger catchments, the potential loss of isotopic tracer resolution at larger spatial and temporal scales and the expense of isotope anal-ysis (Buttle, 1998).
15
From a specific UK perspective, there is a general paucity of experience in the use of stable isotopes for investigating catchment hydrology (Darling et al., 2003). This stems from the often complex climatic and catchment-specific factors controlling their compo-sition, such that for many routine monitoring purposes their measurement is deemed to be of little practical use. From a catchment hydrology perspective however, it is this
20
complexity that provides the potential for insights that are unavailable from other meth-ods. Stable isotope tracers therefore have the potential to play an increasingly impor-tant role as the hydrological research community faces increasing pressure to provide improved process understanding and quantitative knowledge at the larger scales where water resource decision-making occurs (Healy, 2001; Naiman et al., 2001; Soulsby et
25
al., 2003). These efforts are likely to be most productive in settings where hydrological processes can be examined at nested catchment scales, where process understand-ing most commonly gained from small, intensively monitored headwater catchments
HESSD
2, 1–35, 2005 Stable isotope tracers and mesoscale catchment controls P. Rodgers et al. Title Page Abstract Introduction Conclusions References Tables Figures J I J I Back CloseFull Screen / Esc
Print Version Interactive Discussion
EGU
can be more readily interpreted in relation to behaviour at the larger scale (Soulsby et al., in review1).
This paper reports the use of δ18O measurements as a natural tracer to provide in-formation on hydrological flow paths and residence times for nested sub-catchments in the mesoscale (233 km2) Feugh catchment in the northeast of Scotland. Previous
5
hydrological studies at this site have focused on the use geochemical tracers to pro-vide information on the role of hydrological flow paths over a range of temporal and spatial scales (Soulsby et al., 2003, 2004, in review1). The use of δ18O measurements was anticipated to build on this work by providing complimentary insight on catchment residence times and the mixing of hydrological sources that will further elucidate the
in-10
fluence of catchment scale on hydrological functioning. This parallels ongoing work to upscale hydrological understanding in the Feshie catchment in the Cairngorm Moun-tains of Scotland as part of the NERC-funded CHASM (Catchment Hydrology And Sustainable Management) initiative (Rodgers et al., 2004; Soulsby et al., 20041). The aims of the paper therefore are to: (i) characterise spatial and temporal variation in
15
δ18O of precipitation and stream waters in the Feugh catchment; (ii) establish the main hydrological controls on stream water δ18O using information from other geochemical tracers; (iii) produce preliminary estimates of the mean residence time of runoff in the catchment and its major sub-catchments and (iv) relate these to catchment landscape controls.
20
2. Study area
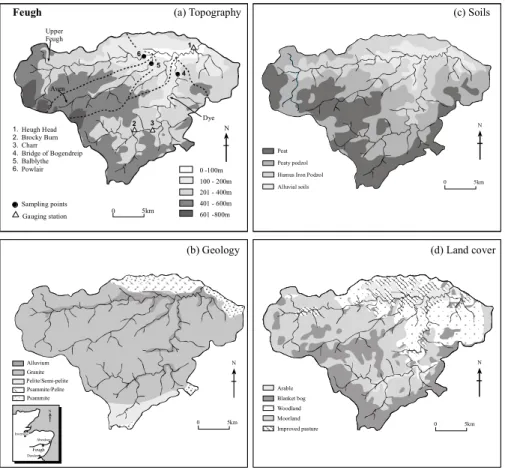
The Water of Feugh drains a 233 km2area in northeast Scotland (Fig. 1a). The catch-ment is predominantly upland in character, with an altitude range from 70–776 m. The climate is cool and wet, with an estimated mean annual precipitation of 1130 mm which
1Soulsby, C., Tetzlaff, D., Rodgers, P. Dunn, S., and Waldron, S.: Dominant runoff processes,
streamwater mean residence times and controlling landscape characteristics in a mesoscale catchment, J. Hydrol., in review, 2004
HESSD
2, 1–35, 2005 Stable isotope tracers and mesoscale catchment controls P. Rodgers et al. Title Page Abstract Introduction Conclusions References Tables Figures J I J I Back CloseFull Screen / Esc
Print Version Interactive Discussion
EGU
mainly falls as rain, though snow does occur during the winter months and significant snow pack accumulation can occur in cold years (Soulsby et al., 1997). The catchment is mainly (ca. 85%) underlain by granite, though the most northern parts of the catch-ment as well as the southern boundary in the Water of Dye sub-basin are underlain by metamorphic rocks (mainly pelites and psammites) (Fig. 1b).
5
The Feugh is formed by three tributaries (the Dye, Aven and Upper Feugh), which are confluent some 4 km upstream of Heugh Head (the gauging station at the catchment outfall) (Fig. 1a). The largest of these sub-catchments (at 90 km2), the Water of Dye, is the most southerly and drains a granite-dominated area, although there is a significant outcrop of schist in its headwaters (Fig. 1b). The sub-catchment is characterised by
10
extensive plateaux areas on the interfluves above 450 m that are dominated by peats (up to 5 m deep) and peaty podzols (ca 1m deep) (Fig. 1c). Only on the more incised catchment slopes do the most freely draining humus iron podzols (<1 m deep) occur and the main river valleys generally have freely draining alluvial deposits and soils.
The Water of Feugh sub-catchment is the most northerly with granite-dominated
15
headwaters grading to metamorphic rocks in the lower catchment near Powlair. In comparison with the Dye, the catchment has been over widened by glacial erosion and meltwater action, with more restricted plateaux areas, lower peat coverage and larger areas of more freely draining podzols (Fig. 1c). More extensive alluvial deposits of sands and gravels (>10 m deep) occupy the valley floor, especially in the Powlair area.
20
The smallest sub-catchment (30 km2) is occupied by the Water of Aven, which lies be-tween the Dye and Upper Feugh. The upper sub-catchment drains an extensive peat-covered plateau underlain by granite, but downstream the valley is very steeply incised, mainly due to erosion by meltwaters. In the lowest part of the sub-catchment, exten-sive alluvial deposits form a fan, where the Aven confluences with the upper Feugh, and
25
further extensive deposits fill the valley floor between this confluence and the gauging station of Heugh Head (Fig. 1b).
Given the topography and soil coverage in the catchment, land use is largely re-stricted to grouse (Lagopus lagopus) and Red deer (Cervus elaphus) shooting on
HESSD
2, 1–35, 2005 Stable isotope tracers and mesoscale catchment controls P. Rodgers et al. Title Page Abstract Introduction Conclusions References Tables Figures J I J I Back CloseFull Screen / Esc
Print Version Interactive Discussion
EGU
heather moorland in the upper reaches of all three sub-basins (Fig. 1d). The moor-lands are managed by regular burning to retain the mosaic of habitats required by grouse. The long history of burning may have contributed to peat erosion, as the peat is extensively “hagged” in many places, particularly in the Aven and upper Feugh catch-ments (Thompson et al., 2001). This dictates that a high density of ephemeral drainage
5
channels covers the peat, connecting it to the perennial stream channel network. In all three sub-basins, agriculture occupies the better floodplain soils, though this mainly comprises livestock grazing (Fig. 1d). The more extensive coverage of freely draining soils in the upper Feugh sub-basin and the lower catchment above and below the trib-utary confluences is the main area where arable farming occurs (Table 1). Some of
10
the valley hillslopes are forest-covered, most notably in the lower valleys of the Wa-ter of Dye and Upper Feugh. In the former case, the forestry is mainly commercial woodlands, whilst in the latter, semi-natural forests of Scots Pine (Pinus sylvestris) predominate (Fig. 1d; Table 1).
The mean annual runoff at Heugh Head, the catchment outfall, is 5.55 m3s−1, with a
15
range between a Q95 of 0.9 m3s−1and a Q10 of 11.4 m3s−1. Water balance estimates suggest annual evaporation rates of ca. 450 mm. In addition to this site, the Scottish Environment Protection Agency (SEPA) also monitor flows for the 42 km2Charr catch-ment in the Water of Dye (Fig. 1a). Further flow records in the Water of Dye were also collected from Brocky Burn, where a flume and pressure transducer were established
20
by the University of Aberdeen (Dawson, 1999). This gave accurate nested flow records for 233, 42 and 1.3 km2 for the Feugh, Charr and Brocky Burn, respectively (Soulsby et al., 2003).
3. Methods
Samples of stream water for the 2001–2002 hydrological year were collected at
ap-25
proximately weekly intervals at six sites in the catchment (Fig. 1a). The availability of flow data for the three nested catchments at Brocky Burn (1.3 km2), Charr (42 km2) and
HESSD
2, 1–35, 2005 Stable isotope tracers and mesoscale catchment controls P. Rodgers et al. Title Page Abstract Introduction Conclusions References Tables Figures J I J I Back CloseFull Screen / Esc
Print Version Interactive Discussion
EGU
Heugh Head (233 km2), provided a concentration of sampling sites down the Water of Dye sub-basin, which was further supplemented by Bogendreip (90 km2) (Fig. 1a). A further two sampling sites were located on the other two sub-basins of the Feugh, the Aven and the Upper Feugh, in order to characterise their overall contribution to the iso-topic signature of stream water leaving the catchment at Heugh Head (Fig. 1a).
Catch-5
ment precipitation was sampled at approximately the same weekly intervals as stream water samples from a rain collector located in the Water of Dye catchment at Charr. These were then averaged over longer fortnightly to three-week intervals depending on precise sample timing in order to produce a more consistent, structured seasonal pattern to the data. This is consistent with other studies (e.g. Darling and Talbot, 2003)
10
where high resolution sampling, particularly following minor precipitation events with extreme isotope signatures, disguised seasonal trends in isotopic composition which are more important when investigating annual time scales.
All samples were collected and stored according to standard procedures (cf. Clark and Fritz, 1997) and analysed at the Scottish Universities Environment Research
Cen-15
tre (SUERC) using a gas source isotope ratio mass spectrometer. Ratios of18O/16O are expressed in delta units, δ18O (‰, parts per mille) defined in relation to V-SMOW (Vienna standard mean ocean water). The analytical precision was ±0.1‰. Stream water samples were also analysed for Gran alkalinity by acidimetric titration to end points of pH 4.5, 4.0 and 3.0 as described by Soulsby et al. (2003).
20
Seasonal trends in δ18O in precipitation and stream water were modelled using pe-riodic regression analysis to fit seasonal sine wave curves to annual δ18O variations in precipitation and stream water (cf. DeWalle et al., 1997), defined as:
δ18O=X + A[cos(ct−θ)], (1)
where δ18O is the modelled δ18O, X is the mean annual measured δ18O, A is the
mea-25
sured δ18O annual amplitude, c is the radial frequency of annual fluctuations (0.017214 rad d−1), t is the time in days after the start of the sampling period (1 October 2001), and θ is the phase lag or time of the annual peak δ18O in radians.
HESSD
2, 1–35, 2005 Stable isotope tracers and mesoscale catchment controls P. Rodgers et al. Title Page Abstract Introduction Conclusions References Tables Figures J I J I Back CloseFull Screen / Esc
Print Version Interactive Discussion
EGU
To estimate mean residence times from these patterns, the commonly used expo-nential model was applied in which precipitation inputs are assumed to mix rapidly with resident water in the major soil water and groundwater catchment stores and an expo-nential distribution of residence times results (Maloszewski et al., 1983; Stewart and McDonnell, 1991). Thus, the decrease in amplitude of stream water outputs relative
5
to precipitation inputs can be used as the basis for estimating mean residence time (Unnikrishna et al., 1995). The sine wave models fitted to input and output water δ18O variations were used and and the mean residence time (T ) of water leaving the system is calculated as:
T = c−1[(Az2/Az1)−2− 1]0.5, (2)
10
where Az1 is the amplitude of precipitation, Az2 is the amplitude of the stream water outputs and c is the radial frequency of annual fluctuations as defined in model (Eq. 1). Given the relatively simple nature of this model and the size and complexity of the Feugh catchment, the results can only be taken as preliminary estimates of mean res-idence times. Nonetheless, studies elsewhere have suggested that the model is likely
15
to be useful for such a first approximation (Stewart and McDonnell, 1991; Uhlenbrook et al., 2002). Furthermore, the relatively coarse temporal and spatial sampling proce-dure precluded reasonable application of more complex residence time models (e.g. Kirchner et al., 2000).
4. Results
20
4.1. Seasonal variation in precipitation inputs
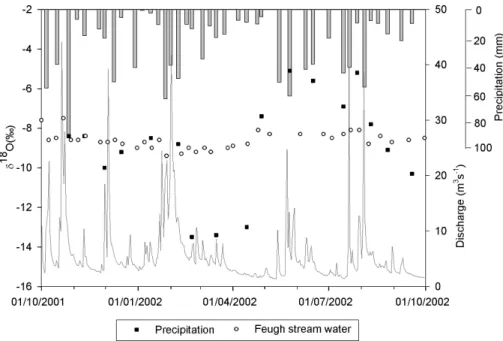
Precipitation inputs to the catchment show marked seasonal variation, with winter pre-cipitation (November to April: mean −10.60‰) more18O-depleted than summer rainfall (May to October: mean −7.31‰) (Table 2). This follows the anticipated, approximately sinusoidal, seasonal pattern of precipitation δ18O whereby winter months are
HESSD
2, 1–35, 2005 Stable isotope tracers and mesoscale catchment controls P. Rodgers et al. Title Page Abstract Introduction Conclusions References Tables Figures J I J I Back CloseFull Screen / Esc
Print Version Interactive Discussion
EGU
nated by colder northerly and easterly air masses that bring rain and snow which, due to low temperatures, is more18O-depleted (Fig. 2). By contrast, summer weather sys-tems are mainly south-westerly in origin, resulting in more18O-enriched precipitation. Despite precipitation inputs to the Feugh generally following this seasonal pattern, it can be seen that the most18O-depleted period of precipitation occurred at the end of
5
the winter months in February and March (Fig. 2). This was when the influence of colder weather systems was most sustained during the year compared with the gen-eral influence of the more variable weather systems earlier in the winter. Surprisingly though, precipitation inputs remained18O-depleted well into April when rising tempera-tures would normally be expected to lead to gradually more18O-enriched precipitation.
10
However, the hydrological year of 2001–2002 was cooler and wetter than normal. Thus, this transition appears to occur very abruptly (Fig. 2), although the relative lack of rain-fall/storm activity during April means that this shift is particularly emphasized by the data.
4.2. Stream water outputs
15
In comparison to precipitation inputs, stream water δ18O is generally very damped, reflecting the influence of catchment processes in effectively mixing seasonally vari-able inputs (see Heugh Head response in Fig. 2). However, stream water δ18O re-sponse for different sites exhibits notable differences, which in turn reflect important sub-catchment variation in hydrological behaviour (Table 2).
20
The most variable site in the catchment is the 1.3 km2, peat-dominated Brocky Burn sub-catchment (δ18O range 3.2‰: Table 2). Increasing scale downstream in the Water of Dye leads to a reduction in δ18O range observed for the 42 km2Charr sub-catchment (range 2.3‰), with the downstream site at Bogendreip (90 km2) displaying a further reduction in range (1.9‰). Beyond this, the overall δ18O range measured over the
25
year at the catchment outfall at Heugh Head (233 km2) shows no difference to that measured at Bogendreip (1.9‰: Table 2). This is despite the influence of stream water inputs from the other two sub-basins, the Water of Aven (30 km2) and the Water of
HESSD
2, 1–35, 2005 Stable isotope tracers and mesoscale catchment controls P. Rodgers et al. Title Page Abstract Introduction Conclusions References Tables Figures J I J I Back CloseFull Screen / Esc
Print Version Interactive Discussion
EGU
Feugh at Powlair (61 km2). These exhibit the lowest overall range and variability in
δ18O over the year (ranges of 1.8 and 1.7‰, respectively: Table 2).
In addition to the annual range for each site, there are also notable differences in mean δ18O. Brocky Burn has the most 18O-enriched mean stream water overall (−8.52‰). The second highest mean δ18O was observed at both Charr and Heugh
5
Head, which show the same annual mean (−8.61‰: Table 2). Bogendreip exhibits more of an intermediate mean δ18O (−8.82‰), whilst the Water of Aven and Powlair show the lowest, most18O-depleted means (−9.06 and −9.15‰: Table 2).
4.3. Hydrological controls on stream water δ18O
Figure 4 shows the stream water δ18O time series for the six sub-catchment sampling
10
sites in the Feugh during the 2001–2002 hydrological year. As with the precipitation in-puts, stream waters exhibit seasonal differences, being generally18O-depleted during the winter months when rainfall and snowmelt generate the highest flows. The effect of more18O-enriched precipitation is evident in summer stream water δ18O. However, it is also notable that the most18O-enriched samples occur during the first month of the
15
sampling period in association with the two largest flows sampled for the year (Fig. 2). Thus, in addition to the seasonal precipitation influence determining stream water δ18O patterns on a catchment-wide basis, specific hydrological events (and therefore vari-ability in sub-catchment hydrological behaviour) can also lead to differences in isotopic composition between sites. This can be most readily shown by comparing δ18O with
20
corresponding stream water alkalinity time series (Fig. 4).
Gran alkalinity has proven utility as a tracer, particularly in the UK uplands. It ef-fectively distinguishes between low alkalinity high flows derived mainly from acidic, organic soil horizons which generate rapid overland flow or shallow sub-surface storm flow; and higher alkalinity water from lower soil horizons and/or groundwater which
25
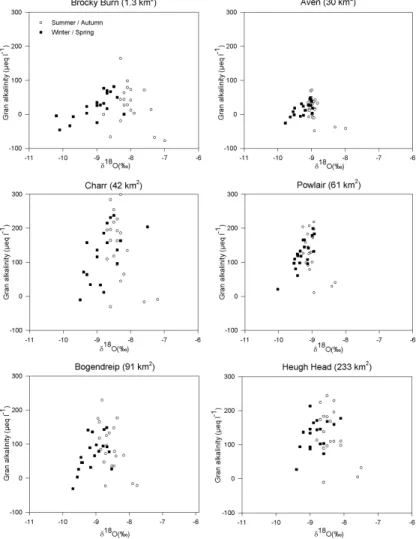
dominates base flows (Hill and Neal, 1997; Wade et al., 1999). As a result, Gran al-kalinity can be seen to vary predictably with flow in the Feugh and its sub-catchments
HESSD
2, 1–35, 2005 Stable isotope tracers and mesoscale catchment controls P. Rodgers et al. Title Page Abstract Introduction Conclusions References Tables Figures J I J I Back CloseFull Screen / Esc
Print Version Interactive Discussion
EGU
(Fig. 3, but see Soulsby et al., 2003 for a full analysis). The availability of stream water alkalinity measurements sampled at the same time as δ18O for each of the six sites therefore acts as a surrogate for flow (especially for ungauged sites), and provides in-sight into the role of different hydrological flow paths that will be affecting the observed
δ18O.
5
It is apparent that there is a considerable amount of event-related variation in δ18O from sample to sample for the majority of sites (Fig. 4). At the most variable site, Brocky Burn, the two highest δ18O samples during the first month of sampling are par-ticularly marked (−7.3 and −7.0‰ on 1 October 2001 and 22 October 2001: Fig. 4). These relate to two of the largest sampled flows of the year (as indicated by the lowest
10
stream water alkalinity values), with the corresponding δ18O displaying notable 18 O-enrichment over the intervening samples (Fig. 4). The same effect is observed at the other Feugh monitoring sites. Rather than these peaks relating closely to the timing of maximum precipitation δ18O as might be expected (Fig. 2), the occurrence of stream water δ18O maxima at the very start of the sampling year present some uncertainty
15
as antecedent precipitation and stream water δ18O are unknown. Furthermore, ini-tial sampled precipitation δ18O for October 2001 are not as enriched as stream water during this period (Fig. 2). It is likely that catchment runoff is dominated by the displace-ment of18O-enriched summer precipitation stored in the catchment prior to sampling, especially as these October events followed a six-week period with limited high flows.
20
Tracer experiments during hydrological events (e.g. Sklash and Farvolden, 1979) com-monly show such displacement of “old” pre-event by “new” precipitation.
After this initial period of intense variation, stream water δ18O was generally more predictable. As anticipated, the small, peat-dominated Brocky Burn shows the most marked response to more depleted winter precipitation events with 3 particularly18
O-25
depleted samples between January and March 2002 (Fig. 4). The first two of these occurred in January following on from notable snowfalls in the latter half of December. However, the most18O-depleted precipitation samples do not occur until the more pro-longed colder weather systems of February and March (Fig. 2), with the lowest stream
HESSD
2, 1–35, 2005 Stable isotope tracers and mesoscale catchment controls P. Rodgers et al. Title Page Abstract Introduction Conclusions References Tables Figures J I J I Back CloseFull Screen / Esc
Print Version Interactive Discussion
EGU
water δ18O sample at Brocky Burn subsequently occurring during this period (5 March 2002, −10.2‰: Fig. 4). Stream water δ18O then exhibits a recovery through the remain-der of March and then April. Although precipitation was still relatively18O-depleted over this period, it was not reflected in stream water δ18O due to the rainfall totals being low; and increasing evaporation leading to catchment drying, as seen from the gradual
in-5
crease of stream water alkalinity to near base flow levels at all sites through to around the end of May (Fig. 4). Stream water δ18O during the summer months at Brocky Burn exhibits a rapid response to more 18O-enriched summer precipitation. In particular, there are two periods of high flow in the summer at the start of June and end of July (where alkalinity is seen to decrease significantly), which result in relatively sustained
10
increases in stream water δ18O (compared with downstream sites) over more stable base flow conditions for the intervening samples (Fig. 4).
The general seasonal pattern of stream water δ18O response observed at Brocky Burn is replicated at the increasing downstream scales of Charr, Bogendreip and Heugh Head, albeit in a more damped manner (Fig. 4). The stream water δ18O time
15
series for the Water of Aven and the Water of Feugh at Powlair, however, as well as being generally more18O-depleted, are also notably less varied in terms of response to short-term hydrological variation. The damped δ18O output for the Water of Aven initially appears surprising, given its relatively high peat coverage (56% cf. Charr 66%: Tables 1 and 2). The extensive erosion of the blanket peat in the Aven probably leads to
20
more significant recharge of groundwater and therefore greater mixing of precipitation inputs (Boorman et al., 1995). However, it is also possible that this reflects the effect of the more freely draining mineral soils that cover the steeper slopes of the catchment as well as the significant alluvial deposits at the base of the catchment as it emerges from its incised valley. In contrast, Charr only really displays relatively confined valley
bot-25
tom alluvial deposits suggesting that there is more mixing of groundwater in the Aven to dampen variation in stream water δ18O. Previous studies using alkalinity-based end member mixing to perform hydrograph separations in the catchment have suggested this to be the case (Soulsby et al., 2003, 20041). A similar influence is observed for the
HESSD
2, 1–35, 2005 Stable isotope tracers and mesoscale catchment controls P. Rodgers et al. Title Page Abstract Introduction Conclusions References Tables Figures J I J I Back CloseFull Screen / Esc
Print Version Interactive Discussion
EGU
most damped δ18O time series for the Water of Feugh at Powlair (Fig. 4), given that this is the sub-catchment where the influence of freely draining humus iron podzols and valley bottom alluvial aquifer deposits is most significant (Fig. 1, Table 1).
These δ18O and alkalinity variations in stream water can be viewed conceptually as the combination of two components: a relatively stable base flow end member and a
5
seasonally variable storm flow end member. This conceptualisation is consistent with the two-component end member mixing previously used to assess the hydrology of the Feugh based on alkalinity data alone (Soulsby et al., 2003, 20041). Figure 5 shows this relationship more clearly, presenting seasonally differentiated δ18O-alkalinity mixing plots. As in Fig. 4, alkalinity measurements are used to provide a more direct
indica-10
tion of hydrological sources affecting measured stream water δ18O. Theoretically, the influence of seasonally variable precipitation inputs should result in an approximately triangular shaped plot of δ18O and alkalinity measurements comprising a low alkalinity, seasonally variable storm flow end member (with low δ18O during winter and higher
δ18O during summer), which mixes with higher alkalinity base flow waters with more
15
stable, intermediate δ18O. At most sites this conceptual structure is apparent, although there are significant inter-site differences.
As expected, the most responsive site at Brocky Burn shows the clearest seasonally differentiated δ18O pattern (Fig. 5). Sites where there is less distinction between sum-mer and winter mixing lines implies a greater mixing of source waters and this is most
20
evident for Powlair and the Aven given their more damped δ18O variability observed in Fig. 4. The expected downstream increase in the mixing of sources with scale is apparent from Brocky Burn to Charr to Bogendreip and Heugh Head (Fig. 5). Despite this, Heugh Head nonetheless displays considerable scatter due to the contrasting iso-topic signature of sub-catchment drainage that it integrates. These mixing plots also
25
illustrate how constrained sub-catchment base flows (highest alkalinities) are in terms of δ18O variation. The least variable Powlair and Aven sites unsurprisingly display the most constant δ18O at lower flows, whereas the lowest flow (highest alkalinity) samples for Brocky Burn exhibit quite notable seasonal differences δ18O as was also suggested
HESSD
2, 1–35, 2005 Stable isotope tracers and mesoscale catchment controls P. Rodgers et al. Title Page Abstract Introduction Conclusions References Tables Figures J I J I Back CloseFull Screen / Esc
Print Version Interactive Discussion
EGU
from the time series in Fig. 4. This can probably be attributed to limited groundwater storage in such a small headwater catchment, which contributes groundwater that is far more seasonally variable than larger sub-catchments where groundwater storage is more extensive and well mixed. Base flow δ18O at Charr appears to be reasonably well defined but variation increases downstream at Bogendreip, and then further at Heugh
5
Head, reflecting the greater mix of isotopic signatures that it receives from the three sub-basins.
4.4. Seasonal analysis of δ18O patterns: preliminary estimate of mean residence times
The seasonal δ18O trends observed in precipitation and stream water were interpreted
10
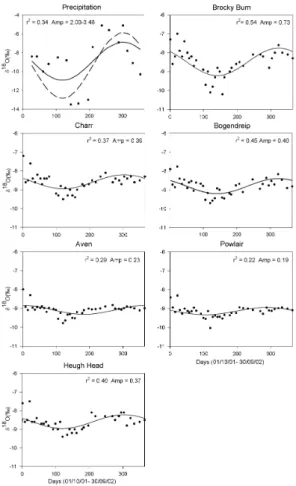
more quantitatively by use of periodic regression analysis to fit seasonal sine wave models to annual δ18O time series (Fig. 6). The modelled curves, in particular for pre-cipitation, oversimplify the patterns of variation evident in the raw data and this has a subsequent impact on the strength of correlations between observed and modelled
δ18O for most sites (i.e. r2=<0.50). However, all the results are statistically robust
15
(p=<0.02), and the level of agreement is generally comparable with results from simi-lar studies (e.g. DeWalle et al., 1997; McGuire et al., 2002; Soulsby et al., in review1). Furthermore, it should be noted that this type of analysis is often based on monthly data, where lower variability leads to better “fit” using a simplistic annual model struc-ture.
20
Figure 6 shows the fitted models for annual δ18O variation in precipitation and stream water. Precipitation inputs are only relatively crudely described using the seasonal sine wave model (r2=0.34) and the modelled amplitude of seasonal δ18O variation is significantly reduced as a result. This appears to be a factor of the particularly rapid transition from the most18O-depleted winter/spring precipitation to more18O-enriched
25
inputs early in the summer, as well as the generally scattered inputs over the first 4 months of the year (Fig. 6). It was therefore considered appropriate to use an additional optimised precipitation model weighted to the seasonal extremes in precipitation δ18O,
HESSD
2, 1–35, 2005 Stable isotope tracers and mesoscale catchment controls P. Rodgers et al. Title Page Abstract Introduction Conclusions References Tables Figures J I J I Back CloseFull Screen / Esc
Print Version Interactive Discussion
EGU
providing a larger model amplitude of 3.48‰ (dashed regression curve; Fig. 6). This could then be used to provide a better upper estimate of mean residence time.
In terms of stream water sampling sites, those with the least variable δ18O stream water (the Aven and Powlair) are those that are least well described by the seasonal sine wave model (r2=<0.3: Fig. 6). In contrast, modelled δ18O for the remaining four
5
sites at Brocky Burn, Charr, Bogendreip and Heugh Head show generally stronger predictions and larger annual δ18O amplitude values. In line with the general an-nual variability observed from Table 2, the significant downstream increase in mod-elled δ18O annual amplitude from the headwater scale of Brocky Burn (1.3 km2) to the sub-catchment scale of Charr (42 km2) has the most significant impact on modelled
10
amplitudes (0.73‰ to 0.39‰). This is presumably in response to the added influence of valley bottom alluvial deposits that facilitates mixing with older groundwater sources. However interestingly, at the base of the catchment at Heugh Head, despite the much larger catchment size and a more significant alluvial aquifer, only a minimal further de-crease in the amplitude of modelled stream water δ18O is produced (0.37‰: Fig. 6).
15
This is despite the further damped, low amplitude influence of flows from the other Water of Aven and Water of Feugh sub-basins.
The model described by Eq. (2) was used to translate the results into estimates of mean stream water residence time (Table 3). These provide a very general, but useful, indication of the degree of mixing of hydrological sources in each sub-catchment and
20
thus offer a valuable integrated assessment of the differences in runoff processes in the Feugh catchment. It is interesting to note that the substantially longer residence times for the Water of Aven and Water of Feugh at Powlair (1.40–2.40 and 1.69–2.91 years) coincide with generally more depleted mean δ18O stream water than for the other sites (Table 3). This probably reflects the greater influence of depleted winter
25
precipitation inputs, implying that the more extensive coverage of freely draining soils in these sub-catchments are responsible for greater recharge to groundwater stores and therefore longer travel times, particularly during the wettest times of the year. This is also implied by the greater groundwater contributions to annual runoff, estimated by
HESSD
2, 1–35, 2005 Stable isotope tracers and mesoscale catchment controls P. Rodgers et al. Title Page Abstract Introduction Conclusions References Tables Figures J I J I Back CloseFull Screen / Esc
Print Version Interactive Discussion
EGU
chemically based hydrograph separations (Soulsby et al., 2003), which show greater groundwater contributions in these sub-catchments (Table 3).
In the Water of Dye by comparison, the high peat coverage at Brocky Burn and Charr are likely to produce more marked storm runoff response and therefore shorter travel times during these wettest periods of the year, allowing comparatively less recharge
5
to groundwater and lower groundwater contributions to flow (Table 3). Recharge of catchment storage in these peat dominated headwaters of the Feugh may therefore be more likely to show a bias towards higher δ18O summer precipitation, when generally drier conditions lead to comparatively longer travel times for precipitation inputs than during the wetter times of the year. The shortest estimated residence time for Brocky
10
Burn (0.41–0.74 years) therefore highlights this overall effect. This is clearly influential at Charr as well, but the larger scale and increased valley bottom storage in alluvium provides greater potential for older water (longer hydrological pathways) to contribute to runoff through the year (mean residence time 0.81–1.41 years). Estimated residence times are again similar for Bogendreip and Charr owing to their general similarity in
15
annual δ18O variability (Table 3). However, the responsive upstream peat influence from Charr appear to mask the potential influence of older waters at the larger scale of Bogendreip, given the more18O-depleted mean stream water observed here.
This is also reflected in the estimated residence time for the base of the Feugh at Heugh Head (0.86–1.49 years), which continues to reflect the importance of rapid
20
storm runoff response from headwater peat at this much larger scale. It appears that the influence of the larger groundwater contributions in the lower catchment (54.6% of annual flows) coupled with more mixed, longer residence time waters from Powlair and the Aven does not result in a marked increase in estimated mean residence time. 4.5. Influence of catchment characteristics on hydrology
25
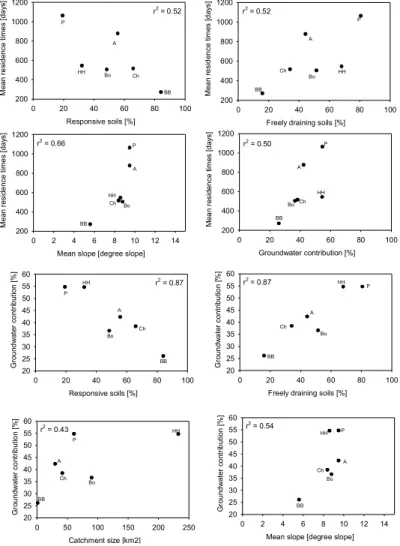
The relationships between estimated mean residence times and catchment landscape controls were examined in a more formal manner by simple linear regression (Table 4 and Fig. 7). Sub-catchment soil cover had a dominant effect, with percentage cover
HESSD
2, 1–35, 2005 Stable isotope tracers and mesoscale catchment controls P. Rodgers et al. Title Page Abstract Introduction Conclusions References Tables Figures J I J I Back CloseFull Screen / Esc
Print Version Interactive Discussion
EGU
of responsive peat soils exhibiting a strong negative correlation with mean residence time. Similarly, the percentage coverage of more freely draining podzolic and alluvial soils was positively correlated with mean residence time, a relationship also reflected by a strong positive correlation with mean catchment slope (which strongly influences soil distribution).
5
Mean catchment residence times were also strongly correlated with percentage groundwater contribution to annual runoff in each sub-catchment (which is tabulated in Table 3) from the earlier work by (Soulsby et al., 2003). Unsurprisingly the per-centage groundwater contribution is also strongly correlated with soil cover and hill-slope gradient. Simply stated, higher peat coverage on flatter catchment interfluves
10
results in rapid hydrological responses to precipitation, leading to reduced recharge, lower groundwater contributions to baseflows and shorter residence times. Higher coverage of freely draining podzols on steeper hillslopes or alluvium in valley bottom areas increases recharge, produces higher groundwater contributions to annual flow and longer residence times. It appears that landscape organisation and the
combina-15
tion of soil/topographic units in different sub-catchments, rather than scale alone has the strongest influence on the hydrological characteristics of flow path partitioning and mean residence times.
5. Discussion
These results contribute to an improved understanding and conceptualisation of
catch-20
ment hydrology for the Feugh, previously based on geochemical tracer analysis (Soulsby et al., 2003, 20041). Variation in stream water δ18O is generally consistent with relatively simple two-component mixing, where well-mixed, longer residence time groundwater sustains base flows and more recent, seasonally variable precipitation inputs in soil waters mainly account for storm flow response. Over the course of the
25
hydrological year, this mixing process resulted in a reasonably well defined, seasonally evolving isotopic signature that reflects important differences in sub-catchment
hydro-HESSD
2, 1–35, 2005 Stable isotope tracers and mesoscale catchment controls P. Rodgers et al. Title Page Abstract Introduction Conclusions References Tables Figures J I J I Back CloseFull Screen / Esc
Print Version Interactive Discussion
EGU
logical processes, and allows intra-catchment differences in stream water residence times to be estimated.
The results provide interesting insights for current understanding on the scaling and integration of hydrological processes in larger catchments. In particular, the results for the largest scale at Heugh Head indicated that the hydrological responsiveness of
5
headwater peat soils (in the Water of Dye) exert the dominant influence on the overall seasonal patterns and residence times observed at the larger catchment scale, despite significant downstream groundwater inputs and mixing with more constant δ18O signa-tures in more groundwater dominated sub-basin drainage. This displays parallels with recent findings from the similar sized Feshie catchment in the Cairngorm Mountains of
10
Scotland (Rodgers et al., 2005; Soulsby et al., 20041). However, residence times in the Feshie ranged from 3–6 months in more responsive catchments, to 12–15 months in more groundwater dominated catchments. Mean residence time at the catchment outfall (230 km2) were 4–7 months. These shorter residence times could reflect the higher precipitation levels in the Feshie and the more mountainous terrain.
15
The results from the Feugh also bear interesting comparison with the findings of other tracer studies; though different sampling strategies and analytical approaches mean that comparisons are semi-quantitative. The flashy, responsive nature of the Feugh to rainfall and snowmelt indicates the importance of much shorter residence time in the catchment soils in headwaters like Brocky burn. Earlier isotope work in the
20
Allt a’ Mharcaidh in the Feshie catchment indicated mean residence times of water in peaty soils could be as little as 2 months (Soulsby et al., 2000). Similarly, others, such as Robson et al. (1992) at Plynlimon in Wales and Nyberg et al. (1999) in Sweden, have used tracer data to imply very short residence times for responsive peaty soils in generating storm runoff. These studies showed that although tracer breakthrough
25
to streams could occur in a matter of minutes or hours, catchment soils still stored significant tracer quantities after a period of a few months.
The importance of groundwater contributions to flow in mountainous environments has increasingly been highlighted in Scotland (e.g. Soulsby et al., 20041) and
else-HESSD
2, 1–35, 2005 Stable isotope tracers and mesoscale catchment controls P. Rodgers et al. Title Page Abstract Introduction Conclusions References Tables Figures J I J I Back CloseFull Screen / Esc
Print Version Interactive Discussion
EGU
where. The results of this study indicate baseflow mean residence times of several years for parts of the Feugh catchment. Similarly, Uhlenbrook et al. (2002) showed that shallow and deep groundwater, respectively accounted for 69% and 20% of an-nual runoff in 40 km2Brugga catchment in the Black Forest of Germany. These shallow and deep groundwater sources were each estimated as having mean residence times
5
in the ranges of 2–3 and 5–10 years. Similar residence times have also been esti-mated in for baseflows, borehole waters or springs in upland environments as different as Plynlimon, Wales (Haria and Shand, 2004); Maimai in New Zealand (McGlynn et al., 2003); pre-Alpine catchments in Switzerland (Vitvar and Balderer, 1998); the Bavarian Alps, Germany (Maloszewski et al., 1983); and the Catskills, USA (Vitvar et al., 2002).
10
Whilst the mean residence times presented in this study do not give direct ground-water residence times, earlier work by Soulsby et al. (1999, 2000) in the Cairngorms made a preliminary estimate of mean residence times for shallow and deeper ground-water sources of 2 and >5 years, respectively. All these studies strongly suggest the presence of long tails in residence time distributions in such mountainous catchments
15
(Kirchner et al., 2000).
Ultimately, it should be stressed that the residence time estimates presented in this study are mean estimates. In reality, catchment runoff is composed of a much wider and more complex range of internal catchment residence time distributions that are currently unknown (Kirchner et al., 2000, 2001). Future work in the Feugh would
there-20
fore benefit from direct assessment of different groundwater and soil water stores that are likely to be highly variable (Frederickson and Criss, 1999; Gonfiantini et al., 1998). These could be assessed indirectly through more intensive sampling of stream base flows or possibly using other tracers such as tritium (cf. McGlynn et al., 2003) or CFCs (cf. Uhlenbrook et al., 2002). Moreover, further insights would be gained for improved
25
spatial and temporal resolution of precipitation and stream water samples, which is a key objective in future work.
The results nonetheless highlight the pragmatic utility of stream water oxygen isotope measurements as an analytical tool in the study of mesoscale catchments given that
HESSD
2, 1–35, 2005 Stable isotope tracers and mesoscale catchment controls P. Rodgers et al. Title Page Abstract Introduction Conclusions References Tables Figures J I J I Back CloseFull Screen / Esc
Print Version Interactive Discussion
EGU
they effectively integrate the influence of these complex catchment heterogeneities as well as indicating the relative importance of different sources in runoff production. This further suggests that the potential of such an approach to improve current understand-ing of scalunderstand-ing in catchment hydrological processes remains largely underdeveloped (Brown et al., 1999; Genereux and Hooper, 1998; McDonnell et al., 1999, Uhlenbrook
5
et al., 2002). It is important, therefore, that tracer studies such as these are continued in order to refine our understanding of flow paths and residence times, and to help structure and validate more accurate hydrological models.
Acknowledgements. The authors are grateful to the support of NERC through the NERC/JIF
CHASM initiative and for supporting PJR on his studentship (GT 4/00/02/). Permission for
10
site access and other support was given by Fasque Estate and the Birse Community Trust. SUERC is funded by a consortium of Scottish Universities and research council support. The contributions of DT were funded by the DFG.
References
Brown, V. A., McDonnell, J. J., Burns, D., and Kendall, C.: The role of event water, rapid shallow
15
flow paths and catchment size in summer storm flow, J. Hydrol., 217, 171–190, 1999. Burns, D. A.: Stormflow hydrograph separation based on isotopes: the thrill is gone – what’s
next?, Hydrol. Proc., 16, 1515–1517, 2002.
Buttle, J. M.: Isotope hydrograph separation and rapid delivery of pre-event water from drainage basins, Prog. Phys. Geogr., 18, 16–50, 1994.
20
Buttle, J. M.: Fundamentals of small catchment hydrology, in Isotope Tracers in Catchment Hydrology, edited by Kendall, C. and McDonnell, J. J., Elsevier, Amsterdam, 1–43, 1998. Clark, I. D. and Fritz, P.: Environmental Isotopes in Hydrogeology, CRC Press, 328pp, 1997. Darling, W. G. and Talbot, J. C.: The O and H stable isotopic composition of fresh waters in the
British Isles, 1. Rainfall, Hydrol. Earth Sys. Sc., 7, 163–181, 2003,
25
SRef-ID: 1607-7938/hess/2003-7-163.
Dawson, J. J.: The controls on the concentrations and fluxes of gaseous, dissolved and par-ticulate organic carbon in upland peat dominated catchments, PhD Thesis, University of Aberdeen, 1999.
HESSD
2, 1–35, 2005 Stable isotope tracers and mesoscale catchment controls P. Rodgers et al. Title Page Abstract Introduction Conclusions References Tables Figures J I J I Back CloseFull Screen / Esc
Print Version Interactive Discussion
EGU
DeWalle, D. R., Edwards, P. J., Swistock, B. R., Aravena, R., and Drimmie, R. J.: Seasonal hydrology of three Appalachian forest catchments, Hydrol. Proc., 11, 1895–1906, 1997. Frederickson, G. G. and Criss, R. E.: Isotope hydrology and residence times of the
unim-pounded Meramec River Basin, Missouri, Chemical Geology, 157, 303–317, 1999.
Genereux, D. P. and Hooper, R. P.: Oxygen and hydrogen isotopes in rainfall-runoff studies, in
5
Isotope Tracers in Catchment Hydrology, edited by Kendall, C. and McDonnell, J. J., Elsevier, Amsterdam, 319–346, 1998.
Gonfiantini, R., Frohlich, K., Araguas-Araguas, L., and Rozanski, K.: Isotopes in groundwater hydrology, in Isotope Tracers in Catchment Hydrology, edited by Kendall, C. and McDonnell, J. J., Elsevier, Amsterdam, 203–246, 1998.
10
Haria, A. H. and Shand, P.: Evidence for deep sub-surface flow routing in forested upland Wales: implications for contaminant transport and stream flow generation, Hydrol. Earth Sys. Sc., 334–344, 2004.
Healy, J.: Paradigms, policies and prognostications about the management of watershed ecosystems, in: River ecology and management, edited by Naiman, R. J. and Bilby, R.
15
E., Academic Press, London, 642–661, 2001.
Hill, T. and Neal, C.: pH, alkalinity and conductivity in runoff and groundwater, Hydrol. Earth Sys. Sc., 3, 381–394, 1997.
Kirchner, J. W., Feng, X., and Neal, C.: Fractal stream chemistry and its implications for con-taminant transport in catchments, Nature, 403, 524–527, 2000.
20
Kirchner, J., Feng, X., and Neal, C.: Catchment-scale advection and dispersion as a mecha-nism for fractal scaling in stream tracer concentrations, J. Hydrol., 254, 82–101, 2001. Maloszewski. P., Rauert, W., Stichler, W., and Herrman, A.: Application for flow models in an
alpine catchment area using tritium and deuterium data, J. Hydrol., 66, 319–330, 1983. Maloszewski, P. and Zuber, A.: Principles and practice of calibration and validation of
mathe-25
matical models for the interpretation of environmental tracer data in aquifers, Adv. Wat. Res., 16, 173–190, 1993.
McDonnell, J., Rowe, L., and Stewart, M.: A combined tracer-hydrometric approach to assess the effect of catchment scale on water flow path, source and age, in Integrated Methods in Catchment Hydrology – Tracer, Remote Sensing and New Hydrometric Techniques, edited
30
by Leibundgut, C., McDonnell, J., and Schultz, G., IAHS Publ. no. 258, 265–274, 1999. McGlynn, B., McDonnell, J., Stewart, M., and Seibert, J.: On the relationship between
HESSD
2, 1–35, 2005 Stable isotope tracers and mesoscale catchment controls P. Rodgers et al. Title Page Abstract Introduction Conclusions References Tables Figures J I J I Back CloseFull Screen / Esc
Print Version Interactive Discussion
EGU
McGuire, K. J., DeWalle, D. R., and Gburek, W. J.: Evaluation of mean residence time in subsur-face waters using oxygen-18 fluctuations during drought conditions in the mid-Appalachians, J. Hydrol., 261, 132–149, 2002.
Naiman R. J., Bisson, P. A., Lee, R. G., and Turner, M.G.: Watershed management, in River Ecology and Management, edited by Naiman, R. J. and Bilby, R. E., Academic Press,
Lon-5
don, 642–661, 2001.
Nyberg, L., Rodhe, A., and Bishop, K.: Water transit times and flow paths from two line in-jections of3H and36Cl in a microcatchment at G ˚ardsj ¨on, Sweden, Hydrol. Proc., 13, 1557– 1575, 1999.
Robson, A. J., Beven, K. J., and Neal, C.: Towards identifying sources of subsurface flow: a
10
comparison of components identified by a physically based runoff model and those deter-mined by chemical mixing techniques, Hydrol. Proc., 6, 199–214, 1992.
Rodgers, P., Soulsby, C., and Waldron, S.: Stable isotope tracers as diagnostic tools in up-scaling flow path understanding and residence time estimates in a mountainous mesoscale catchment, Hydrol. Proc., in press, 2005.
15
Rodgers, P., Soulsby, C., Petry, J., Malcolm, I., Gibbins, C., and Dunn, S.: Groundwater-surface water interactions in a braided river: a tracer based assessment, Hydrol. Proc., 18, 1315– 1332, 2004a.
Rodgers, P., Soulsby, C., Petry, J., and Dunn, S.: Integrating tracers and GIS to assess the influence of landscape heterogeneity on runoff processes in a complex mountainous
catch-20
ment, Proceedings of the BHS International Conference – Hydrology: Science and Practice for the 21stCentury, 458–467, 2004b.
Shand, P., Darbyshire, D. P. F., Goody, D. C., Darling, W. G., Neal, C., Haria, A. H., and Dixon, A. J.: The application of Sr isotopes to catchment studies: The Plynlimon upland catchment of Central Wales, Water-rock interaction, 1–2, 1577–1580, 2001.
25
Sklash, M. G.: Environmental isotope studies of storm and snowmelt runoff generation, in Process Studies in Hillslope Hydrology, edited by Anderson, M. G. and Burt, T. P., John Wiley, Chichester, 401–435, 1990.
Sklash, M. G. and Farvolden, R. N.: The role of groundwater in storm runoff, J. Hydrol., 43, 45–65, 1979.
30
Sklash, M. G., Farvolden, R. N., and Fritz, P.: A conceptual model of watershed response to rainfall developed through the use of oxygen-18 as a natural tracer, Can. J. Earth Sc., 13, 271–283, 1976.
HESSD
2, 1–35, 2005 Stable isotope tracers and mesoscale catchment controls P. Rodgers et al. Title Page Abstract Introduction Conclusions References Tables Figures J I J I Back CloseFull Screen / Esc
Print Version Interactive Discussion
EGU
Soulsby, C. and Dunn, S. M.: Towards integrating tracer studies with a conceptual rainfall-runoff model; insights from a sub-arctic catchment in the Cairngorm Mountains, Scotland, Hydrol. Proc., 17, 403–416, 2003.
Soulsby, C., Helliwell, R. C., Ferrier, R. C., Jenkins, A., and Harriman, R.: Seasonal snowpack influence on the hydrology of a sub-arctic catchment in Scotland, J. Hydrol., 192, 17–32,
5
1997.
Soulsby, C., Chen, M., Ferrier, R. C., Helliwell, R. C., Jenkins, A., and Harriman, R.: Hydro-geochemistry of shallow groundwater in an upland Scottish catchment, Hydrol. Proc., 12, 1111–1127, 1998.
Soulsby, C., Malcolm, R., Ferrier, R. C., and Jenkins, A.: Hydrogeochemistry of montane
10
springs and their influence on streams in the Cairngorm Mountains, Scotland, Hydrol. Earth Sys. Sc., 3, 409–419, 1999,
SRef-ID: 1607-7938/hess/1999-3-409.
Soulsby, C., Malcolm, R., Helliwell, R. C., Ferrier, R. C., and Jenkins, A.: Isotope hydrology of the Allt a’ Mharcaidh catchment, Cairngorm mountains, Scotland: implications for
hydrologi-15
cal pathways and water residence times, Hydrol. Proc., 14, 747–762, 2000.
Soulsby, C., Rodgers, P., Smart, R., Dawson, J., and Dunn, S.: A tracer based assessment of hydrological pathways at different spatial scales in a mesoscale Scottish catchment, Hydrol. Proc., 17, 759–777, 2003.
Soulsby, C., Rodgers, P., Petry, J., Hannah, D. M., Malcolm, I. A., and Dunn, S. M.: Using tracers
20
to upscale flow path understanding in mesoscale mountainous catchments: two examples from Scotland, J. Hydrol., 291, 174–196, 2004.
Stewart, M. K. and McDonnell, J. J.: Modelling base flow soil water residence times from deuterium concentrations, Wat. Resour. Res., 27, 2681–2693, 1991.
Thompson, D. B. A., Gordon, J. E., and Horsfield, D.: Montane landscapes in Scotland: are
25
these natural artefacts or complex relicts, Earth Science and the Natural Heritage, edited by Gordon, J. E. and Leys, K. F., Stationary Office, London, 105–119, 2001.
Turner, J. V., Barnes, C. J.: Modelling of isotope and hydrogeochemical responses in catchment hydrology, In Isotope Tracers in Catchment Hydrology, edited by Kendall, C. and McDonnell, J. J., Elsevier, Amsterdam, 723–760, 1998.
30
Uhlenbrook, S., Frey, M., Leibundgut, C., and Maloszewski, P.: Hydrograph separations in a mesoscale mountainous basin at event and seasonal timescales, Wat. Resour. Res., 38, 1096–1110, 2002.
HESSD
2, 1–35, 2005 Stable isotope tracers and mesoscale catchment controls P. Rodgers et al. Title Page Abstract Introduction Conclusions References Tables Figures J I J I Back CloseFull Screen / Esc
Print Version Interactive Discussion
EGU
Unnikrishna, P. V., McDonnell, J. J., and Stewart, M. L.: Soil water isotope residence time mod-elling, in Solute Modelling in Catchment Systems, edited by Trudgill, S. T., Wiley, Chichester, 237–260, 1995.
Vitvar, T. and Balderer W.: Estimation of mean residence times and runoff generation by sta-ble isotope measurements in a small prealpine catchments, Appl. Geochem., 12, 787–796,
5
1998.
Vitvar, T., Burns, D. A., Lawrence, G. B., McDonnell, J. J., and Wolock, D. M.: Estimation of baseflow residence times in watersheds from the runoff hydrograph recession: method and application in the Neversink watershed, Catskill Mountains, New York, 16, 1871–1877, 2002. Wade, A. J., Neal, C., Soulsby, C., Smart, R. P., Langan, S. J., and Cresser, M. S.:
Mod-10
elling streamwater quality under varying hydrological conditions at different spatial scales, J. Hydrol., 217, 266–283, 1999.
HESSD
2, 1–35, 2005 Stable isotope tracers and mesoscale catchment controls P. Rodgers et al. Title Page Abstract Introduction Conclusions References Tables Figures J I J I Back CloseFull Screen / Esc
Print Version Interactive Discussion
EGU
Table 1. Characteristics of the Feugh catchment.
Geology Soils Land Use
Area Mean altitude Granite Semi -pelite Psammite Alluvial Peat
Peaty Podzol Humus Iron
Podzol Alluvial Woodland Moorland / Peat Grassland
km2 m % % % % % % % % % % % 1. Brocky Burn 1.3 419 100 0 0 0 84.1 15.9 0 0 0 100 0 2. Charr 41.8 420 73.3 21.5 3.2 1 65.9 34.1 0 0 0 99.4 0.6 3. Bogendreip 90.1 357 80.2 12.3 2.8 4.2 48.5 38.0 13.2 0 22.1 72.4 4.2 4. Aven 30.1 427 99.2 0 0 0.8 55.7 30.3 13.2 0.8 5.6 92.7 1.6 5. Powlair 61.1 356 86.5 0 5.0 8.4 19.4 38.8 36.9 4.9 10.1 74.2 9.5 6. Heugh Head 233 329 78.5 4.8 8.5 7.9 32.1 34 26 7.9 18.1 68.2 10.7
HESSD
2, 1–35, 2005 Stable isotope tracers and mesoscale catchment controls P. Rodgers et al. Title Page Abstract Introduction Conclusions References Tables Figures J I J I Back CloseFull Screen / Esc
Print Version Interactive Discussion
EGU
Table 2. Arithmetic mean, range and standard deviation of δ18O (‰) in the Feugh catchment (1 October 2001–30 September 2002).
Mean Minimum Maximum Standard deviation Inputs: Winter/spring precipitation −10.60 −13.5 −8.4 2.29 Summer/autumn precipitation −7.31 −10.3 −5.1 1.80 Stream water: 1. Brocky burn −8.52 −10.2 −7.0 0.72 2. Charr −8.61 −9.5 −7.2 0.46 3. Bogendreip −8.82 −9.7 −7.8 0.43 4. Aven −9.06 −9.8 −8.0 0.31 5. Powlair −9.15 −10.0 −8.3 0.29 6. Heugh head −8.61 −9.4 −7.5 0.42
HESSD
2, 1–35, 2005 Stable isotope tracers and mesoscale catchment controls P. Rodgers et al. Title Page Abstract Introduction Conclusions References Tables Figures J I J I Back CloseFull Screen / Esc
Print Version Interactive Discussion
EGU
Table 3. Mean and amplitude of modelled δ18O, approximate mean residence times and esti-mated groundwater flow contributions for sub-catchment sites in the Feugh (2001–2002). Mean residence times range from a minimum estimate derived from the un-weighted precipitation model, to a higher estimate based on more typical seasonal extremes. Groundwater propor-tions based on annual two-component mixing analysis using Gran alkalinity (see Soulsby et al., 2004).
Modelled Amplitude Mean residence % Groundwater Mean (‰) (‰) time (years) contribution
to annual flow Inputs: Precipitation −8.86 2.03 Weighted precipitation −9.36 3.48 Stream water: 1. Brocky Burn −8.55 0.73 0.41–0.74 26.1 2. Charr −8.60 0.39 0.81–1.41 38.4 3. Bogendreip −8.82 0.40 0.79–1.38 36.6 4. Aven −9.06 0.23 1.40–2.40 42.3 5. Powlair −9.15 0.19 1.69–2.91 54.7 6. Heugh Head −8.62 0.37 0.86–1.49 54.6
HESSD
2, 1–35, 2005 Stable isotope tracers and mesoscale catchment controls P. Rodgers et al. Title Page Abstract Introduction Conclusions References Tables Figures J I J I Back CloseFull Screen / Esc
Print Version Interactive Discussion
EGU
Table 4. Coefficients of variation r2and trends (negative or positive) between controlling catch-ment variables and both mean water residence times and groundwater contribution.
Mean residence times Groundwater contribution
r2 trend r2 trend
Area 0.00 – 0.43 pos
Topography
Mean elevation 0.02 neg 0.42 neg
Min elevation 0.31 neg 0.50 neg
Max elevation 0.24 pos 0.39 pos
Mean slope 0.66 pos 0.54 pos
Max slope 0.44 pos 0.66 pos
Drainage density 0.36 pos 0.70 pos
Soils
Peat 0.52 neg 0.87 neg
Peaty podzol/humus iron podzol 0.35 pos 0.49 pos
Alluvial/humus iron podzol 0.47 pos 0.83 pos
Responsive soils∗
Freely draining soils∗∗ 0.52 pos 0.87 pos
Land use
Heather/peatland 0.11 neg 0.50 neg
Coniferous woodland 0.01 pos 0.20 pos
Grassland 0.21 pos 0.79 pos
Geology
Granite 0.01 pos 0.14 neg
Alluvial 0.22 pos 0.73 pos
Groundwater contribution/residence times 0.50 pos
∗
Peat
∗∗
HESSD
2, 1–35, 2005 Stable isotope tracers and mesoscale catchment controls P. Rodgers et al. Title Page Abstract Introduction Conclusions References Tables Figures J I J I Back CloseFull Screen / Esc
Print Version Interactive Discussion
EGU Figure 1. Catchment maps of the Feugh, showing (a) topography and monitoring network, (b)
geology, (c) soil coverage and (d) land cover
N Arable Blanket bog Woodland Moorland Improved pasture 0 5km N Peat Peaty podzol Humus Iron Podzol
Alluvial soils 0 5km N 0 -100m 100 - 200m 201 - 400m 401 - 600m 601 -800m Gauging station Sampling points 1. 2. 3. 4. 5. 6. Heugh Head Brocky Burn Charr Bridge of Bogendreip Balblythe Powlair Upper Feugh Dye Aven 1 2 3 4 5 6 0 5km
Feugh (a) Topography (c) Soils
(b) Geology (d) Land cover
N Inverness Dundee Aberdeen Feugh Alluvium Granite Psammite/Pelite Psammite Pelite/Semi-pelite N 0 5km
Fig. 1. Catchment maps of the Feugh, showing (a) topography and monitoring network, (b) geology,(c) soil coverage and (d) land cover.
HESSD
2, 1–35, 2005 Stable isotope tracers and mesoscale catchment controls P. Rodgers et al. Title Page Abstract Introduction Conclusions References Tables Figures J I J I Back CloseFull Screen / Esc
Print Version Interactive Discussion
EGU
28 Figure 2. Temporal variation in precipitation and stream water δ18
O, annual run-off and rainfall for the Feugh catchment (01/10/2001-30/09/2002)
Fig. 2. Temporal variation in precipitation and stream water δ18O, annual run-off and rainfall for the Feugh catchment (1 October 2001–30 September 2002).
HESSD
2, 1–35, 2005 Stable isotope tracers and mesoscale catchment controls P. Rodgers et al. Title Page Abstract Introduction Conclusions References Tables Figures J I J I Back CloseFull Screen / Esc
Print Version Interactive Discussion
EGU
29 Figure 3. Alkalinity variation with flow for sub-catchment sampling sites in the Feugh Fig. 3. Alkalinity variation with flow for sub-catchment sampling sites in the Feugh.
HESSD
2, 1–35, 2005 Stable isotope tracers and mesoscale catchment controls P. Rodgers et al. Title Page Abstract Introduction Conclusions References Tables Figures J I J I Back CloseFull Screen / Esc
Print Version Interactive Discussion
EGU
30 Figure 4. Temporal co-variation in stream water δ18
O and alkalinity for Feugh sub-catchments Fig. 4. Temporal co-variation in stream water δ18O and alkalinity for Feugh sub-catchments.
HESSD
2, 1–35, 2005 Stable isotope tracers and mesoscale catchment controls P. Rodgers et al. Title Page Abstract Introduction Conclusions References Tables Figures J I J I Back CloseFull Screen / Esc
Print Version Interactive Discussion
EGU
Figure 5. Mixing plots for stream water δ18O, showing seasonal and flow (alkalinity) related
variation
Fig. 5. Mixing plots for stream water δ18O, showing seasonal and flow (alkalinity) related variation.
HESSD
2, 1–35, 2005 Stable isotope tracers and mesoscale catchment controls P. Rodgers et al. Title Page Abstract Introduction Conclusions References Tables Figures J I J I Back CloseFull Screen / Esc
Print Version Interactive Discussion
EGU
32 Figure 6. Fitted annual regression models to δ18O for precipitation and stream water in the
Feugh. Precipitation model represented by the solid regression line is based on the raw data series while the dashed regression line is fitted to an optimised data set to represent the full seasonal variability in sampled precipitation
Fig. 6. Fitted annual regression models to δ18O for precipitation and stream water in the Feugh. Precipitation model represented by the solid regression line is based on the raw data series while the dashed regression line is fitted to an optimised data set to represent the full seasonal variability in sampled precipitation.
HESSD
2, 1–35, 2005 Stable isotope tracers and mesoscale catchment controls P. Rodgers et al. Title Page Abstract Introduction Conclusions References Tables Figures J I J I Back CloseFull Screen / Esc
Print Version Interactive Discussion EGU Responsive soils [%] 0 20 40 60 80 100 M ean r e si d enc e ti m e s [ da ys ] 200 400 600 800 1000 1200 r2 = 0.52 HH A P Bo Ch BB
Freely draining soils [%]
0 20 40 60 80 100 M ean r e si de nc e t im es [d ay s] 200 400 600 800 1000 1200 r2 = 0.52
Mean slope [degree slope]
0 2 4 6 8 10 12 14 M e an r es ide nc e ti m e s [ da ys ] 200 400 600 800 1000 1200 Responsive soils [%] 0 20 40 60 80 100 Gr ou nd w at er c o nt rib ut ion [ % ] 20 25 30 35 40 45 50 55 60 HH A P Bo Ch BB HH A P Bo Ch BB Groundwater contribution [%] 0 20 40 60 80 100 M ea n r esi de n ce ti m es [ d ay s] 200 400 600 800 1000 1200 r2 = 0.66 r2 = 0.50 HH A P BoCh BB r2 = 0.87 HH A P Bo Ch BB
Freely draining soils [%]
0 20 40 60 80 100 G roun dw a ter c on tri bu tio n [% ] 20 25 30 35 40 45 50 55 60 r2 = 0.87 Catchment size [km2] 0 50 100 150 200 250 Gr ou ndw at er c o nt rib ut io n [% ] 20 25 30 35 40 45 50 55 60 r2 = 0.43
Mean slope [degree slope]
0 2 4 6 8 10 12 14 Gr ou nd w at er c o nt rib ut ion [% ] 20 25 30 35 40 45 50 55 60 r2 = 0.54 HH A P Bo Ch BB HH A P Bo Ch BB HH A P Bo Ch BB
Figure 7. Selected relationships between catchment characteristics and mean residence time and percentage groundwater contributions to flow
Fig. 7. Selected relationships between catchment characteristics and mean residence time and percentage groundwater contributions to flow.