HAL Id: hal-00304866
https://hal.archives-ouvertes.fr/hal-00304866
Submitted on 16 Nov 2005
HAL is a multi-disciplinary open access
archive for the deposit and dissemination of
sci-entific research documents, whether they are
pub-lished or not. The documents may come from
teaching and research institutions in France or
abroad, or from public or private research centers.
L’archive ouverte pluridisciplinaire HAL, est
destinée au dépôt et à la diffusion de documents
scientifiques de niveau recherche, publiés ou non,
émanant des établissements d’enseignement et de
recherche français ou étrangers, des laboratoires
publics ou privés.
irrigation areas
S. Siebert, P. Döll, J. Hoogeveen, J.-M. Faures, K. Frenken, S. Feick
To cite this version:
S. Siebert, P. Döll, J. Hoogeveen, J.-M. Faures, K. Frenken, et al.. Development and validation of
the global map of irrigation areas. Hydrology and Earth System Sciences Discussions, European
Geosciences Union, 2005, 9 (5), pp.535-547. �hal-00304866�
SRef-ID: 1607-7938/hess/2005-9-535 European Geosciences Union
Earth System
Sciences
Development and validation of the global map of irrigation areas
S. Siebert1, P. D¨oll1, J. Hoogeveen2, J.-M. Faures2, K. Frenken2, and S. Feick1 1Institute of Physical Geography, University of Frankfurt, Frankfurt (Main), Germany 2Food and Agriculture Organization of the United Nations, Rome, Italy
Received: 16 June 2005 – Published in Hydrology and Earth System Sciences Discussions: 1 August 2005 Revised: 11 October 2005 – Accepted: 8 November 2005 – Published: 16 November 2005
Abstract. A new version of a digital global map of
irriga-tion areas was developed by combining irrigairriga-tion statistics for 10 825 sub-national statistical units and geo-spatial in-formation on the location and extent of irrigation schemes. The map shows the percentage of each 5 arc minute by 5 arc minute cell that was equipped for irrigation around the year 2000. It is thus an important data set for global studies re-lated to water and land use. This paper describes the data set and the mapping methodology and gives, for the first time, an estimate of the map quality at the scale of countries, world re-gions and the globe. Two indicators of map quality were de-veloped for this purpose, and the map was compared to irri-gated areas as derived from two remote sensing based global land cover inventories.
1 Introduction
Agriculture is by far the largest water-use sector, accounting for about 70 percent of all water withdrawn worldwide from rivers and aquifers for agricultural, domestic and industrial purposes (Shiklomanov, 2000). In many developing coun-tries more than 90 percent of the water withdrawals are for ir-rigation (FAO AQUASTAT-database, http://www.fao.org/ag/ agl/aglw/aquastat/main/index.stm, 2005). In arid regions, ir-rigation is the prerequisite for crop production. In semi-arid and humid areas, irrigation serves to increase yields, to at-tenuate the effects of droughts or, in the case of rice produc-tion, to minimize weed growth. Average yields are gener-ally higher under irrigated conditions as compared to rain-fed agriculture (Bruinsma, 2003). In the United States, for example, average crop yields of irrigated farms exceeded, in 2003, the corresponding yields of dryland farms by 15% for soybeans, 30% for maize, 99% for barley, and by 118%
Correspondence to: S. Siebert
for wheat (Veneman et al., 2004). Although globally only 18% of the cultivated area is irrigated (FAO, 2005a), 40% of the global food production comes from irrigated agriculture (UNCSD, 1997). Both the water scarcity caused by using large amounts of water in irrigated agriculture and the im-portance of irrigation for crop production and food security induced several studies to quantify the different elements of the global water balance in space and time (e.g. V¨or¨osmarty et al., 2000; Oki et al., 2001; Alcamo et al., 2003; FAO, 2005b). Others focused on the importance of irrigated food production in general (Wood et al., 2000; Faures et al., 2002), on the impact of irrigated agriculture on global (or regional) climate (De Rosnay et al., 2003; Boucher et al., 2004) or on the impact of climate change and climate variability on global irrigation water requirements (D¨oll, 2002).
All these studies depend on data on the distribution and extent of irrigated areas in the world. The first digi-tal global map (or rather data set) of irrigated areas was published in 1999 (D¨oll and Siebert, 2000). It showed the areal fraction of 0.5 arc degrees by 0.5 arc degree grid cells that was equipped for irrigation in the 1990s. Since then, the map has been updated several times and the map resolution has increased to 5 arc minutes by 5 arc min-utes. A new mapping methodology was developed (Siebert and D¨oll, 2001) and this methodology was applied to all countries by using information collected in the framework of FAO’s AQUASTAT program (http://www.fao.org/ag/agl/ aglw/aquastat/main/index.stm). A documentation of the source data used in these updates as well as the most recent version of the Global Map of Irrigation Areas is available at the web page of the mapping project (http://www.fao.org/ag/ agl/aglw/aquastat/irrigationmap/index.stm).
In this paper we present the most recent version 3.0 of the Global Map of Irrigation Areas, which shows the fraction of 5 arc minutes by 5 arc minutes cells that was equipped for irrigation around the year 2000. To our knowledge, this is the only global data set of irrigated areas that is not primarily
Converting Digitizing
Georeferencing
Reports of FAO, UN, World Bank, Ministries of
Agriculture, irrigation associations etc.
Printed maps Digital data sets
Irrigation density grid (resolution 0.01 x 0.01 degree) for each country
Global map of areas equipped for irrigation (resolution 5 min x 5 min)
Aggregating
Statistical data
Irrigated area per (sub)national statistical unit (country, federal state, province, governorate, basin etc.)
10 825 records in map version 3.0
Geographical information
Location of irrigated areas as
point data (with or without command area) polygon data (outlines of irrigation schemes) raster data (interpreted satellite imagery) Land cover raster maps
Satellite imagery
Boundaries of (sub)national units
Modeling
(applying priority levels of geographical information)
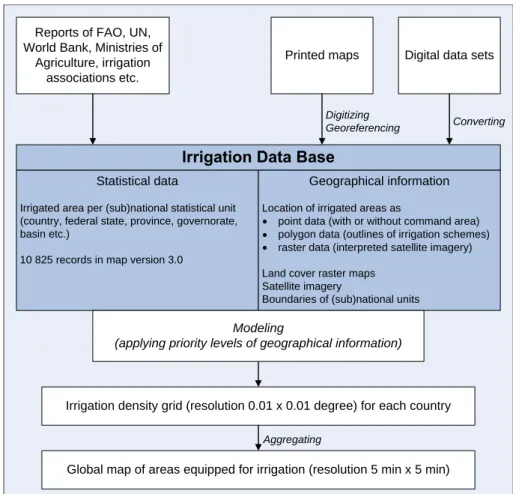
Fig. 1. Scheme of mapping methodology used to develop the Global Map of Irrigation Areas.
based on remote sensing information. We describe the map-ping methodology (Sect. 2) and then we present the mapmap-ping results (Sect. 3). The focus of this paper is on an assessment of the map quality which is based on two indicators of map quality and a comparison to irrigated areas as identified in global and continental land cover maps that are based on re-mote sensing (Sect. 4). Finally, we draw conclusions with respect to the recommended use of the data set (Sect. 5).
2 Data and methods
The global map of irrigation areas was developed by com-bining sub-national irrigation statistics with geospatial infor-mation on the position and extent of irrigation schemes to compute the fraction of 5 arc minute cells that was equipped for irrigation, which is called irrigation density (Fig. 1). In the following, we provide a concise description of the map-ping methodology. A detailed description is given in Siebert and D¨oll (2001).
Irrigation statistics for 10 825 sub-national units (e.g. dis-tricts, counties, provinces, governorates, river basins), from national census surveys and from reports available at FAO,
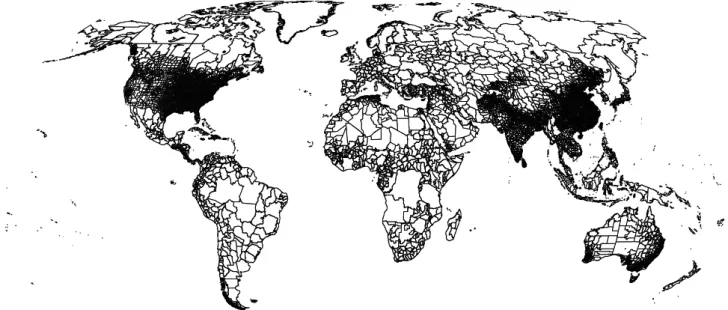
World Bank and other international organizations, were used to develop the most recent map version 3 (Fig. 2). For most of the countries, these statistics refer to the area equipped for irrigation. Due to several reasons (e.g. crop rotation, water shortages, damage of infrastructure) the area actually irri-gated maybe significantly lower than the area equipped for irrigation. However, some countries only report the area that was actually irrigated in the year of the census. Statistics for the year closest to 2000 were used if statistics for more than one year have been available. For countries, where the irri-gation statistics reported by the FAO AQUASTAT database were assumed to be more representative, the collected sub-national statistics were scaled so that the sum of the irri-gated area equals the area equipped for irrigation as given by AQUASTAT at the country level.
In order to distribute irrigated area within the sub-national units, geospatial information on position and extent of irri-gated areas was derived by digitizing hundreds of irrigation maps available in reports of FAO, World Bank, irrigation as-sociations or national ministries of agriculture. Additionally, information from several atlases or inventories based on re-mote sensing available in digital format was utilized. For most of the countries, more than one data source was used.
Fig. 2. Location and extent of the 10 825 sub-national units with information on area equipped for irrigation (or areas actually irrigated) that was used to develop the Global Map of Irrigation Areas Version 3 (Robinson projection).
As the relevance and reliability of the maps varies, it was necessary to decide which geospatial record should be used in a specific sub-national unit. This was realized by apply-ing a priority level to each record. Only if the extent of all digitized irrigated areas with the highest priority level was smaller than the total irrigated area reported for the specific sub-national unit, also records with the second highest prior-ity were considered. This distribution process was repeated down to the next lower priority level until the sum of irri-gated area in the map was equal to the irriirri-gated area in the sub-national statistics. Several different criteria have been used to assign priorities to geospatial information, for exam-ple:
– the scale and publishing date of the maps
– the type of map (simple sketch or drawing to scale) – how the background information for the maps was
col-lected (by ground based mapping, survey or via remote sensing)
– if only the position or also the extent of the irrigation
schemes was provided.
In many sub-national units, lack of geospatial information on irrigation made it necessary to use indirect informa-tion to infer areas within the sub-nainforma-tional unit where irri-gation is probable. Such information includes areas where the main irrigated crops are grown, or cultivated areas in very arid regions. For arid regions, remote sensing data were additionally used to verify the available maps. If no direct or indirect information about the spatial distri-bution of irrigation within a sub-national unit was avail-able, irrigated area was distributed according to a global
land cover data set (USGS, 2000) to all areas classi-fied as: “Dryland Cropland and Pasture”, “Irrigated Crop-land and Pasture”, “CropCrop-land/GrassCrop-land Mosaic”, “Crop-land/Woodland Mosaic”, “Grassland”, “Shrubland”, “Mixed Shrubland/Grassland”, “Savanna”, “Herbaceous Wetland” or “Wooded Wetland”.
3 Results
The total area equipped for irrigation in map version 3 of the Global Map of Irrigation Areas is 273.7 Mio ha (Table 1). About 69% of the total irrigated area is located in Asia, 17% in America, 9% in Europe, 4% in Africa and 1% in Oceania. The largest values of irrigated area on the country level are those for India (57.3 Mio ha), China (53.8 Mio ha) and the United States (27.9 Mio ha) (Table A1). More than 20% of the cultivated area are equipped for irrigation in the following world regions: South Asia (37.6%), Central Asia (34.9%), Near East (30.6%) and Northern Africa (20.5%). In West-ern Africa the cultivated areas are almost completely rainfed (Table 1).
The largest contiguous areas of high irrigation density are found in North India and Pakistan along the rivers Ganges and Indus, in the Hai He, Huang He and Yangtze basins in China, along the Nile river in Egypt and Sudan, in the Mississippi-Missouri river basin and in parts of California. Other areas of high irrigation density with regional impor-tance are located along the Snake and Columbia rivers in the northwestern United States, along the western coasts of Mex-ico and Peru, in central Chile, in the rice growing areas along the border between Brazil and Uruguay, along the Danube and Po rivers in Europe, in the Euphrates-Tigris basin in
-180 -150 -120 -90 -60 -30 0 30 60 90 120 150 180 180 150 120 90 60 30 0 -30 -60 -90 -120 -150 -180
Irrigation area as percentage of total area 0 < 0.1 0.1 - 1 1 - 5 5 - 10 10 - 20 20 - 35 35 - 50 50 - 75 75 - 100 90 60 30 0 -30 -60 90 60 30 0 -30 -60
Fig. 3. Global Map of Irrigation Areas Version 3: Percentage of 5-min grid cell area that was equipped for irrigation around the year 2000 (Robinson projection).
Iraq and Turkey, the Aral sea basin, the Amu Darya and Syr Darya river basins, the Brahmaputra basin in China and Bangladesh, the Mekong delta in Vietnam, the plain around Bangkok in Thailand, the island of Java (Indonesia) and the Murray-Darling basin in Australia. Smaller irrigation areas are spread across almost all populated parts of the world (Fig. 3).
4 Assessment of map quality
A common method to assess the quality of a macro-scale data set is to compare it with independent smaller-scale informa-tion at selected locainforma-tions and then to draw conclusions with respect to the quality at these locations and in general. Here, however, all data on irrigated areas known to the authors (at appropriate scales) were used to compile the map itself and could thus not be used for a quality assessment. Besides, any generalization would not be possible, as the map quality is different in each individual sub-national unit depending on the data sources used in the specific case. Instead, to assess the quality of the Global Map of Irrigation Areas, two indi-cators were computed that take into account the geospatial information density (Sect. 4.1), and the map was compared to the irrigated areas of two global land cover inventories that are based on remote sensing (Sect. 4.2).
4.1 Indicators of map quality
Because of the mapping methodology (see Sect. 2), the qual-ity of the mapping product is strongly influenced by the den-sity and reliability of the used information. Thus the map
quality differs from country to country and even within coun-tries.
Two country-specific indicators were developed to quan-tify the density of information used as input data sources: indicator A (IND A) represents the density of the used sub-national irrigation statistics while indicator B (IND B) rep-resents the density of the available geospatial records on po-sition and extent of irrigated areas. Marks derived from the two indicators were combined to obtain a mark for the overall map quality for each country (Table A1).
While the density of information could be assessed, it was in general not possible to estimate the reliability of the data sources. Some local studies show that there may be large dif-ferences between census-based sub-national irrigation statis-tics and the extent of areas equipped for irrigation observed in reality. D¨oll and Hauschild (2002), for example, presented best guess estimates of local experts for area equipped for irrigation in the two semi-arid Brazilian states of Piau´ı and Cear´a that were 28% (Piau´ı) and 45% (Cear´a) lower than the corresponding results of the Brazilian agricultural census. The reliability of geo-spatial data on location and extent of irrigation schemes may be also uncertain. It is well known, for example, that many of the former irrigation schemes in Eastern Europe and the former Soviet Union do not exist any-more. But lack of information made it impossible to verify the available data on the global scale systematically. How-ever, the overall map quality mark was downgraded for a country when it was found that sub-national statistics coming from different sources disagreed, when statistics were found to be incomplete or when geo-spatial information was found to be out of date.
Table 1. Number of countries (ncnt), area equipped for irrigation (areairri), percentage of cultivated area equipped for irrigation (irriperc),
average area of the sub-national units (areaadmav)and average area of the sub-national units weighted by irrigation density (areaadmw)for
the entire world and 19 world regions.
Region ncnt areairri(ha) irriperc(%) areaadmav(ha) areaadmw(ha) (IND A)
North America 2 28 698 918 12.4 512 287 243 101 Central America 32 7 859 309 18.3 971 195 938 242 South America 14 10 102 130 8.1 9 065 021 2 744 775 Northern Africa 5 5 804 793 20.5 3 860 121 448 374 Western Africa 24 1 005 495 1.1 4 939 529 2 520 777 Eastern Africa 13 3 546 276 7.5 4 404 625 1 918 066 Southern Africa 11 1 880 337 4.6 7 445 113 3 408 977 Western Europe 15 2 131 807 6.9 7 387 722 4 385 796 Eastern Europe 18 7 556 000 8.1 11 745 784 13 696 554 Southern Europe 9 10 022 456 18.0 2 222 626 2 635 819 Russian Federation 1 4 878 000 3.9 19 234 888 5 028 884 Near East 16 18 839 608 30.6 2 075 844 834 586 Central Asia 9 14 854 955 34.9 1 045 886 323 565 East Asia 7 59 875 193 19.4 457 947 161 378 South Asia 7 77 236 998 37.6 523 047 395 817 South-East Asia 11 16 793 335 17.7 1 603 949 681 205 Oceania 26 2 637 835 4.7 623 907 147 544 World 221 273 723 445 16.3 1 241 912 330 249
4.1.1 Indicator for the density of sub-national irrigation statistics (IND A)
A possible indicator for the density of sub-national irriga-tion statistics is the arithmetic mean of the size of the sub-national units. However, there are some countries where irri-gation is concentrated in some small sub-national units while in other very large sub-national units of the same country there is no or very little irrigation. One of these countries is Canada, with a lot of irrigation in some small census divi-sions in southern Alberta and no irrigation at all in several very large census divisions in the northern part. To avoid that large sub-national units without significant irrigation have a negative impact on the indicator, the size of each sub-national statistical unit is weighted by the irrigation density in the sub-national unit relative to the irrigation density in the entire re-gion (country, world rere-gion or global), and
I N D Areg =
areareg
n
P
adm=1
(irridensadm/ irridensreg)
(1) with irridensadm= irareaadm areaadm (2) where IND Areg is the average weighted size of the
sub-national units in region reg (ha), arearegis the surface area of
region reg (ha), irridensadmis the irrigation density in
sub-national unit adm (-), irridensreg is the irrigation density in
region reg (-), n is the number of sub-national units in region
reg, irareaadmis the irrigated area in sub-national unit adm
(ha) and areaadmis the surface area in sub-national unit adm
(ha).
Simplifying Eq. (1) results in
I N D Areg = irareareg n P adm=1 irridensadm (3)
where irarearegis the total irrigated area in region reg (ha). IND A would be equal the arithmetic mean of the size of
sub-national units in a region if the irrigation density would be the same in all sub-national units of the region. If all ir-rigated area would be concentrated in only one sub-national unit, IND A would be equal to the size of this sub-national unit. IND A would be lower than the arithmetic mean of the size of the sub-national units if the irrigation density is higher in small sub-national units than in the larger sub-national units.
A comparison of the arithmetic mean of the size of sub-national units (areaadmav) and IND A on the country level
(Table A1) or per region (Table 1) shows that IND A is smaller in most cases. This indicates that the density of ir-rigation statistics is higher in areas where irir-rigation is im-portant (areas of high irrigation density). However, there are also exceptional cases, e.g. the countries of Azerbaijan, Cameroon, Fiji (Table A1) or the regions of Eastern and Southern Europe (Table 1).
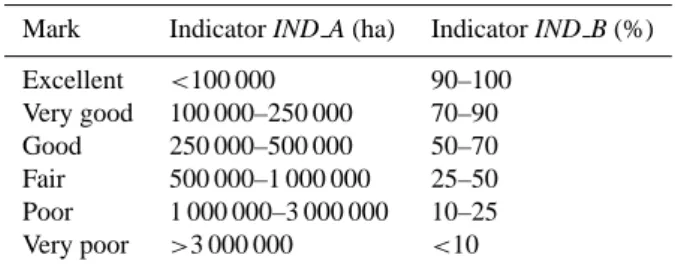
Table 2. Assignment of marks dependent on the quantities of the map quality indicators for the weighted average size of sub-national statistical units (IND A) and the percentage of irrigated area as-signed to grid cells by using geospatial records on position and ex-tent of known irrigation schemes (IND B).
Mark Indicator IND A (ha) Indicator IND B (%) Excellent <100 000 90–100 Very good 100 000–250 000 70–90 Good 250 000–500 000 50–70 Fair 500 000–1 000 000 25–50 Poor 1 000 000–3 000 000 10–25 Very poor >3 000 000 <10
4.1.2 Indicator for the density of geo-spatial records (IND B)
The second indicator (IND B) was developed to give an es-timate on the density of geospatial information used to as-sign irrigated area to specific cells within the sub-national units. IND B was computed as the fraction of irrigated area that could be assigned to specific grid cells by using geospa-tial records on the position and extent of known irrigation projects.
4.1.3 Mark for the overall map quality at the country level Depending on the computed indicator values, the marks ex-cellent, very good, good, fair, poor or very poor were given to each country for both of the indicators IND A and IND B (Table 2). A mark for the overall quality was given assum-ing that the types of information that are reflected by the two indicators can replace each other. Thus, in general, the mark for the overall map quality was set to the better of the two marks given according to IND A and IND B (Table A1). If, for example, the location and extent of almost all irrigation projects in a country is known then the overall quality of the map should be excellent independently from the mark given according to the weighted size of sub-national units. On the other hand, if the size of the sub-national statisti-cal units is very small (in an extreme case smaller than the map resolution of 5 arc minutes), the overall quality of the map should also be excellent even if there are no geo-spatial records on the position of irrigation schemes within the sub-national units available.
In 64 out of 211 countries, however, the mark for the over-all map quality was downgraded because there were doubts regarding the reliability of the used information (Table A1). One example is Cyprus. Based on the average weighted size of the sub-national units of 81 702 ha the mark for IND A is excellent. The mark given according to IND B is good, because an inventory of public irrigation schemes was avail-able. The overall quality mark is set to good and not to
ex-cellent, because of lack of information for the Turkish part of the island. Another example is China, where the marks ac-cording to both of the indicators are very good. However, the overall map quality is estimated as good only, because there are doubts regarding the quality of information published in the statistical yearbooks (Heilig, 1999) and due to inconsis-tencies between irrigated areas derived from a land use at-las and the statistics published in the corresponding statisti-cal yearbook. There are 27 countries where the overall map quality is estimated as very good but also 9 countries with a very poor map quality (all of the latter are located in Africa or Europe).
4.1.4 Mark for the overall map quality at the global level and in world regions
Marks for the overall mapping quality in world regions or at global scale were computed by combining the marks for the overall quality of the map at country level and the irrigated area in the corresponding countries (Table A1) as:
mreg=
irareav good+2 × irareagood+3 × irareafair+4 × irareapoor+5 × irareav poor
irareareg
(4) where mreg is the overall quality of irrigation map in
re-gion reg, irareav good, irareagood, irareafair, irareapoor and irareav poor represent the irrigated area of all countries in a
region reg with very good, good, fair, poor or very poor map quality (ha) and irareareg is the irrigated area in region reg
(ha).
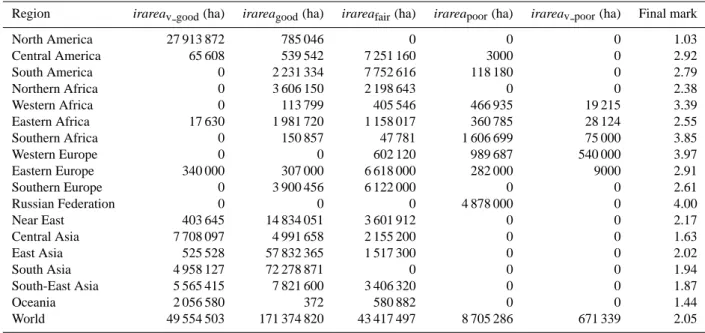
At the level of world regions, map quality in North Amer-ica (overall mark 1.03), Oceania (1.44), Central Asia (1.63), South-East Asia (1.87) and South Asia (1.94) is best. West-ern Africa (3.39), SouthWest-ern Africa (3.85), WestWest-ern Europe (3.97) and the Russian Federation (4.00) have the worst map quality. At the global scale, the overall map quality is good (2.05). About 50 Mio ha of areas equipped for irrigation are located in countries where map quality is estimated to be very good, 171 Mio ha in countries with good map qual-ity, 43 Mio ha in countries with fair map qualqual-ity, 9 Mio ha in countries with poor map quality and 0.7 Mio ha in countries with very poor map quality. Consequently about 81% of the total irrigated area of the world is located in countries where the map quality is assessed to be very good or good (Table 3). More than 20% of the cultivated area is equipped for irri-gation in Northern Africa, Near East, Central Asia and South Asia (Table 1). The overall map quality mark in these regions is best in Central Asia (1.63) and worst in Northern Africa (2.38) (Table 3). The overall map quality mark for these four regions is 1.96. 93% of the total irrigated area in this region is located in countries where map quality is assessed to be very good or good. Therefore it can be stated that the map quality is better than average for regions where irrigation is important.
The weighted arithmetic mean of the size of sub-national units at the global scale is 330 249 ha. This is close to the size of one 0.5 degree grid cell at the equator. This indicates,
Table 3. Sum of area equipped for irrigation in countries with very good (irareav good), good (irareagood), fair (irareafair), poor (irareapoor)
and very poor (irareav poor)map quality and resulting final mark for map quality for the entire world and 19 world regions.
Region irareav good(ha) irareagood(ha) irareafair(ha) irareapoor(ha) irareav poor(ha) Final mark
North America 27 913 872 785 046 0 0 0 1.03 Central America 65 608 539 542 7 251 160 3000 0 2.92 South America 0 2 231 334 7 752 616 118 180 0 2.79 Northern Africa 0 3 606 150 2 198 643 0 0 2.38 Western Africa 0 113 799 405 546 466 935 19 215 3.39 Eastern Africa 17 630 1 981 720 1 158 017 360 785 28 124 2.55 Southern Africa 0 150 857 47 781 1 606 699 75 000 3.85 Western Europe 0 0 602 120 989 687 540 000 3.97 Eastern Europe 340 000 307 000 6 618 000 282 000 9000 2.91 Southern Europe 0 3 900 456 6 122 000 0 0 2.61 Russian Federation 0 0 0 4 878 000 0 4.00 Near East 403 645 14 834 051 3 601 912 0 0 2.17 Central Asia 7 708 097 4 991 658 2 155 200 0 0 1.63 East Asia 525 528 57 832 365 1 517 300 0 0 2.02 South Asia 4 958 127 72 278 871 0 0 0 1.94 South-East Asia 5 565 415 7 821 600 3 406 320 0 0 1.87 Oceania 2 056 580 372 580 882 0 0 1.44 World 49 554 503 171 374 820 43 417 497 8 705 286 671 339 2.05
that the use of the map can be recommended in general for global or regional studies at this resolution. The overall qual-ity of the map at the global scale (2.05) indicates, that the use of the map can also be recommended for global studies per-formed on the map resolution of 5 arc minutes. For studies performed on the country or regional scale, we recommend the use of the Global Map of Irrigation Areas only if the over-all map quality was estimated as very good (Table A1) or better than 2.5 (Table 3).
4.2 Comparison to global land cover data sets
To further assess the quality of the Global Map of Irrigation Areas, it was compared to results of global land cover classi-fications based on remote sensing which distinguish in their classification irrigated and rainfed agriculture at the global scale (Global Land Cover Characterization GLCC, USGS, 2000) or at least for some world regions (Global Land Cover 2000 database GLC2000, European Commission, Joint Re-search Centre, 2003). Both data sets have a resolution of 1 km by 1 km. Please note that they were not developed with the focus on mapping irrigated areas, and that the land cover class irrigated agriculture is only one of many others.
GLCC was derived from 1-km Advanced Very High Res-olution Radiometer (AVHRR) 10-day composites spanning a 12-month period (April 1992–March 1993). In addition, other key geographic data such as digital elevation data, ecoregions interpretations, and country or regional-level veg-etation and land cover maps have been used in the classifica-tion. The methodology used to develop GLCC is described
in Loveland et al. (2000). Dataset and documentation are available at http://lpdaac.usgs.gov/glcc/glcc.asp.
GLC2000 was developed by using 14 months of daily 1-km resolution satellite data acquired over the whole globe by the VEGETATION instrument on-board the SPOT 4 satellite and delivered as multi-channel daily mosaics. The monitor-ing period was from 1 November 1999 to 31 December 2000. Irrigated and rainfed agriculture was distinguished in the re-gional products for Africa, Europe, South Asia and South-East Asia only. Dataset and documentation are available at http://www-gvm.jrc.it/glc2000/defaultGLC2000.htm.
The area classified as irrigated in these data sets was sum-marized for each country and compared to the corresponding irrigation statistics as used for the Global Map of Irrigation Areas (Table A1). The two remote sensing based data sets detected the area that was actually irrigated during the mon-itoring period while the statistics used to develop the Global Map of Irrigation Areas depict, for most countries, the area equipped for irrigation, which includes all areas having irri-gation infrastructure. Therefore it can be expected that the irrigated areas of the remote sensing products are somewhat smaller than the values of the irrigation statistics. However, the result of the comparison shows that there is hardly any agreement between the statistical data and the irrigated areas of GLCC and GLC2000 even on the country level. The dif-ference between irrigated areas from the statistics and from remote sensing was smaller than 20% for only seven coun-tries in the case of GLCC, and for only three councoun-tries in the case of GLC2000. Additionally there is also hardly any agreement between the two land cover data sets (Table A1). Certainly, census based statistics may have a high degree of
-180 -150 -120 -90 -60 -30 0 30 60 90 120 150 180 180 150 120 90 60 30 0 -30 -60 -90 -120 -150 -180
Irrigation area as percentage of total area 0 < 0.1 0.1 - 1 1 - 5 5 - 10 10 - 20 20 - 35 35 - 50 50 - 75 75 - 100 90 60 30 0 -30 -60 90 60 30 0 -30 -60
Fig. 4. Percentage of 5-min grid cell area that was classified as irrigated agriculture in the GLCC (in Robinson projection).
-180 -150 -120 -90 -60 -30 0 30 60 90 120 150 180 180 150 120 90 60 30 0 -30 -60 -90 -120 -150 -180
Irrigation area as percentage of total area 0 < 0.1 0.1 - 1 1 - 5 5 - 10 10 - 20 20 - 35 35 - 50 50 - 75 75 - 100 90 60 30 0 -30 -60 90 60 30 0 -30 -60 no distinction of irrigated and rainfed agriculture
uncertainty, depending often on the importance of irrigation for a country. However, the large discrepancies in most coun-tries do indicate that the estimates of the extent of irrigated areas as derived from the land cover classification are not very reliable.
A second comparison was performed at the scale of 5 arc minutes. The cells of the two land cover classifications were aggregated to the 5 arc minutes resolution, and the percent-age of each 5 min cell that is irrigated was computed (Figs. 4 and 5). The comparison of the Global Map of Irrigation Areas (Fig. 3) to GLCC shows that the best agreement ex-ists in Egypt, Western China and North America (although the many irrigation areas along the Mississippi and the scat-tered small scale irrigation in the Eastern US are missing in GLCC). In all other regions there are large discrepancies. For example most of the important irrigation areas in the Ganges and Indus basins are missing in GLCC. Instead, large parts in South-East India appear to be irrigated. Most of the irri-gation schemes in Africa, Europe, South America, Australia and on the Arabian Peninsula are missing in GLCC, while other areas in Myanmar, Thailand and Eastern China are irrigated very densely. The agreement between the Global Map of Irrigation Areas and GLC2000 is good for the Nile basin and parts of South Asia (Myanmar, Thailand, Vietnam, upper Indus and upper Ganges basins). In all the other re-gions there are large discrepancies. The irrigated areas in many parts of Africa, Europe and South-East Asia are miss-ing in GLC2000, while irrigation density in India is mostly very high. Not only with respect to the country values but also with respect to the spatial distribution of irrigated areas within countries, there is also very little agreement between the two land cover classifications themselves (Figs. 4 and 5). There are several reasons why the remote sensing based global land cover inventories failed to classify irrigated areas in many regions. First of all, the methodology used in the land cover classifications leads to the detection of the main land cover type for each grid cell, which would be irrigated agriculture if irrigation density is more than 50%, and some-thing else if irrigation density is lower. Therefore, the land cover classification maps tend to overestimate irrigation den-sity in the main irrigation areas as compared to the Global Map of Irrigation Areas, and on the other hand many of the smaller irrigation areas are missing. Second, a successful detection of irrigated areas in more humid regions requires a lot of background knowledge on cropping practices, weather, soil conditions and agricultural management, which is not available on the global scale at the required resolution. The results of the land cover classifications are better in arid re-gions if the irrigation schemes are large enough. The irri-gated areas along the Nile River or at the fringe of the Takla-makan desert in Western China are detected very well while many of the oases on the Arabian Peninsula or in Northern Africa are classified as scrubland or grassland because they are much smaller than the resolution of the used satellite im-agery.
Please remember that the methodology used in the land cover classification was not developed with the focus on irrigated areas. A methodology for remote sensing based global irrigation mapping was developed by researchers at the International Water Management Institute (IWMI). The methodology is actually being used in an ongoing global ir-rigation mapping project (see http://www.iwmidsp.org/iwmi/ info/research.asp).
5 Conclusions
The quality of the Global Map of Irrigation Areas, which was compiled by combining sub-national irrigation statistics for 10 825 statistical units with geo-spatial information on the location and extent of irrigation schemes, differs strongly between countries and world regions, depending on the den-sity and reliability of the used data sources. The overall map quality of version 3 of the global irrigation map is estimated as good. Improvements of the irrigation map are in particular necessary for the continents of Africa and Europe and for the Russian Federation.
The quality of the map allows to recommend the use of the data set for global studies or for studies focusing on the world regions of North America, Northern Africa, Near East, Cen-tral Asia, East Asia, South Asia, South-East Asia or Ocea-nia. Additionally the map quality was estimated as very good for 27 countries so that the use of the Global Irrigation Map for studies performed for these countries can also be recom-mended if there is a lack of similar country specific data sets and if the map resolution of 5 arc minutes is sufficient.
The comparison to two global land cover inventories in-dicates that these data sets should not be used to extract irri-gated areas. The main advantage of the Global Map of Irriga-tion Areas is that the total area equipped for irrigaIrriga-tion in any of the sub-national units is equal to the irrigated area as re-ported by census-based statistics. This is important for many applications of the map, e.g. for the calculation of irrigation water use. The mapping methodology allows to easily in-corporate new information and thus to benefit from advance-ments made by national census and mapping authorities.
Appendix
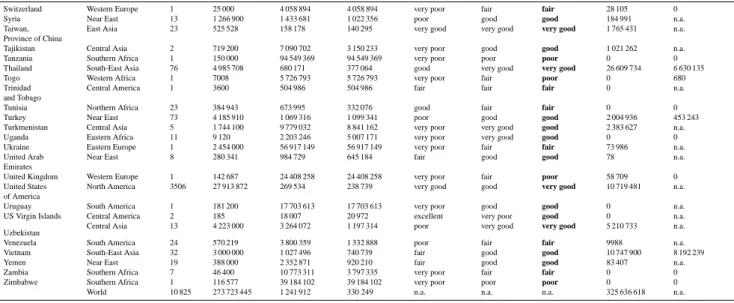
Table A1. Assessment of map quality for countries. Number of sub-national units (nadm), area equipped for irrigation (areairri), average
area of the sub-national units (areaadmav), average area of the sub-national units weighted by irrigation density (IND A), map quality based
on indicators A and B (considering the weighted average size of sub-national units and the availability of geospatial records to distribute irrigated areas within sub-national units, respectively), overall map quality, and irrigated area in the Global Land Cover Characterization (USGS, 2000) data set GLCC, and irrigated area in the Global Land Cover 2000 data set GLC2000 (European Commission, Joint Research Centre, 2003) (GLC2000), for all countries where irrigation was reported.
Country Region nadm areairr(ha) areaadmav(ha) IND A (ha)
Map quality Irrigated area in other datasets (ha) Based on
indica-tor A
Based on indi-cator B
overall GLCC GLC2000
Afghanistan Central Asia 329 3 199 070 195 012 100 129 very good good very good 1 556 249 6 251 633 Albania Eastern Europe 1 340 000 2 869 803 2 869 803 poor very good very good 19 055 0
Algeria Northern Africa 48 555 500 4 832 921 356 678 good poor fair 0 1385
Andorra Southern Europe 1 150 46 040 46 040 excellent good good 1075 0
Angola Southern Africa 1 75 000 125 157 722 125 157 722 very poor very poor very poor 0 0 Antigua and
Barbuda
Central America 1 130 54 524 54 524 excellent very poor good 0 n.a.
Argentina South America 24 1 437 275 11 580 985 10 013 677 very poor good fair 1554 n.a.
Armenia Central Asia 39 286 027 75 942 53 342 excellent good very good 14 107 n.a.
Australia Oceania 1322 2 056 580 582 328 116 419 very good good very good 26 270 n.a.
Austria Western Europe 1 46 000 8 363 819 8 363 819 very poor fair fair 5883 0
Azerbaijan Central Asia 7 1 453 318 1 231 120 2 078 392 poor good good 712 368 n.a.
Bahrain Near East 9 4060 6925 3774 excellent very good very good 0 n.a.
Bangladesh South Asia 64 3 751 045 213 733 202 300 very good good very good 7 466 244 10 339 672
Barbados Central America 1 1000 44 964 44 964 excellent good very good 0 n.a.
Belarus Eastern Europe 1 115 000 17 650 795 17 650 795 very poor poor poor 419 n.a.
Belgium Western Europe 1 40 000 3 046 628 3 046 628 very poor poor poor 6761 0
Belize Central America 1 3000 2 229 079 2 229 079 poor fair poor 0 n.a.
Benin Western Africa 6 10 236 1 933 320 966 604 fair good fair 0 15 121
Bhutan South Asia 20 38 734 198 897 159 021 very good very good very good 63 698 214 268
Bolivia South America 10 128 240 10 877 707 6 741 935 very poor good fair 31 583 n.a.
Bosnia Herzegovina
Eastern Europe 1 2000 5 034 643 5 034 643 very poor very poor very poor 3158 0
Botswana Southern Africa 6 1381 9 659 377 712 669 fair fair fair 0 0
Brazil South America 30 2 656 284 28 355 229 18 399 822 very poor fair fair 0 n.a.
Brunei South-East Asia 1 1000 590 083 590 083 fair fair fair 41 513 0
Bulgaria Eastern Europe 1 800 000 11 034 060 11 034 060 very poor fair fair 86 372 0
Burkina Faso Western Africa 10 24 331 2 757 477 2 723 515 poor fair fair 1337 28 945
Burundi Eastern Africa 8 14 400 338 353 24 229 excellent very poor good 0 0
Cambodia South-East Asia 21 284 172 867 100 537 055 fair very good very good 7 346 838 1 887 695
Cameroon Western Africa 36 20 970 1 300 415 1 739 517 poor very good fair 0 65 537
Canada North America 270 785 046 3 664 480 693 806 fair good good 189 254 n.a.
Cape Verde Western Africa 1 2779 404 523 404 523 good very poor fair 0 0
Central African Republic
Western Africa 24 135 2 595 067 8 845 312 very poor excellent good 0 0
Chad Western Africa 11 14 020 11 585 520 2 872 441 poor very good good 0 130 753
Chile South America 13 1 900 000 5 801 591 2 547 695 poor good good 0 n.a.
China East Asia 2414 53 823 000 387 005 149 312 very good very good good 110 027 672 n.a.
Colombia South America 33 900 000 3 463 207 2 127 824 poor fair fair 305 919 n.a.
Comoros Eastern Africa 4 130 48 447 23 839 excellent excellent very good 0 0
Congo, Dem. Rep.
Western Africa 1 10 500 233 798 683 233 798 683 very poor very good good 0 0
Congo, Rep Western Africa 2 217 17 158 886 590 730 fair very poor poor 0 0
Costa Rica Central America 8 103 084 642 259 944 203 fair fair fair 0 n.a.
Cote D’Ivoire Western Africa 1 72 750 32 316 231 32 316 231 very poor good fair 0 27 326 Croatia Eastern Europe 1 3000 5 675 863 5 675 863 very poor very poor very poor 3224 0
Cuba Central America 15 870 319 734 561 774 494 fair poor fair 0 n.a.
Cyprus Near East 9 55 813 102 795 81 702 excellent good good 9427 0
Czech Republic Eastern Europe 1 24 000 7 868 122 7 868 122 very poor poor poor 55 0
Denmark Western Europe 1 476 000 4 260 345 4 260 345 very poor very poor very poor 243 0
Djibouti Eastern Africa 5 407 434 531 173 210 very good very poor fair 0 0
Dominican Republic
Central America 31 269 710 156 667 186 440 very good good good 0 n.a.
East Timor South-East Asia 1 14 000 1 290 097 1 290 097 poor fair fair 141 290 0
Ecuador South America 22 863 370 1 168 061 914 831 fair fair fair 714 920 n.a.
Egypt Northern Africa 26 3 245 650 3 785 072 366 380 good good good 1 961 473 3 208 725
El Salvador Central America 1 44 993 2 051 927 2 051 927 poor very good good 0 n.a.
Eritrea Eastern Africa 1 28 124 12 175 259 12 175 259 very poor poor very poor 0 4621
Estonia Eastern Europe 1 4000 4 325 320 4 325 320 very poor very poor very poor 263 0
Ethiopia Eastern Africa 9 160 785 12 584 053 10 197 682 very poor fair poor 0 14 895
Fiji Oceania 2 3000 967 209 1 838 800 poor fair fair 0 n.a.
Finland Western Europe 1 64 000 31 286 011 31 286 011 very poor very poor very poor 1039 n.a.
France Southern Europe 22 2 000 000 2 490 354 2 743 917 poor fair fair 291 147 0
French Guyana South America 1 2000 8 362 955 8 362 955 very poor fair fair 0 n.a.
Gabon Western Africa 26 4450 1 021 554 1 476 439 poor good fair 0 0
Gambia Western Africa 3 1670 358 586 390 843 good fair good 0 71 670
Georgia Central Asia 1 300 000 6 979 779 6 979 779 very poor fair fair 43 961 n.a.
Germany Western Europe 15 531 120 2 370 523 3 076 418 very poor fair fair 16 555 0
Ghana Western Africa 9 6374 2 663 105 861 620 fair very good good 0 1555
Greece Southern Europe 1 1 422 000 13 212 760 13 212 760 very poor fair fair 297 326 647 003
Grenada Central America 1 219 41 508 41 508 excellent poor good 0 n.a.
Guadeloupe Central America 1 2000 177 668 177 668 very good good very good 0 n.a.
Guam Oceania 1 312 55 038 55 038 excellent very poor good 0 n.a.
Guatemala Central America 22 129 803 494 303 375 233 good good good 0 n.a.
Guinea Western Africa 23 92 880 1 068 124 1 537 311 poor poor poor 0 42 205
Guinea Bissau Western Africa 1 17 115 3 370 176 3 370 176 very poor very poor very poor 0 108 149
Guyana South America 10 150 134 2 112 413 432 368 good fair good 0 n.a.
Table A1. Continued.
Honduras Central America 18 73 210 622 137 431 031 good fair fair 84 n.a.
Hungary Eastern Europe 1 210 000 9 274 395 9 274 395 very poor fair fair 26 277 0
India South Asia 555 57 291 407 577 832 418 698 good good good 64 989 028 152 440 746
Indonesia South-East Asia 89 4 459 000 2 133 773 929 478 fair good good 11 630 619 516 156
Iran Near East 25 6 913 800 6 488 740 4 599 816 very poor good good 1 908 232 n.a.
Iraq Near East 18 3 525 000 2 399 113 1 218 600 poor fair fair 166 202 n.a.
Israel Near East 33 183 408 67 738 31 251 excellent good very good 35 035 n.a.
Italy Southern Europe 20 2 698 000 1 506 391 1 811 753 poor fair fair 239 901 344 425
Jamaica Central America 14 25 214 79 097 110 296 very good good very good 0 n.a.
Japan East Asia 47 3 129 000 794 798 702 829 fair good good 3 238 580 n.a.
Jordan Near East 8 76 912 1 126 990 294 032 good fair fair 362 n.a.
Kazakhstan Central Asia 19 1 855 200 14 145 120 12 729 831 very poor good fair 5 263 375 n.a.
Kenya Eastern Africa 8 66 610 7 308 011 1 382 698 poor good fair 0 0
Korea, Dem. Rep. East Asia 1 1 460 000 12 244 011 12 244 011 very poor good fair 1 321 814 n.a.
Korea, Republic East Asia 15 880 365 659 376 395 459 good fair good 1 682 588 n.a.
Kuwait Near East 6 6968 288 451 680 602 fair very good very good 0 n.a.
Kyrgyzstan Central Asia 41 1 075 040 486 307 286 062 good good good 1 252 028 n.a.
Laos South-East Asia 18 295 535 1 281 555 1 013 132 poor very good very good 1 579 030 660 757
Latvia Eastern Europe 1 20 000 6 431 369 6 431 369 very poor poor poor 0 0
Lebanon Near East 26 117 113 39 722 50 242 excellent fair very good 22 771 n.a.
Lesotho Southern Africa 1 2722 3 049 045 3 049 045 very poor fair poor 0 0
Liberia Western Africa 1 2100 9 612 261 9 612 261 very poor very poor very poor 0 0
Libya Northern Africa 25 360 500 6 477 352 432 994 good good good 0 143 525
Lithuania Eastern Europe 1 9000 6 459 028 6 459 028 very poor poor poor 0 0
Macedonia Eastern Europe 1 55 000 2 541 962 2 541 962 poor poor poor 14 873 0
Madagascar Eastern Africa 6 1 087 000 9 868 007 8 236 266 very poor fair fair 0 0
Malawi Southern Africa 10 28 000 1 185 072 490 930 good good good 0 0
Malaysia South-East Asia 14 362 600 2 365 595 567 143 fair good good 5 617 450 135 570
Mali Western Africa 34 191 470 3 689 200 3 241 291 very poor fair fair 326 681 653 718
Malta Southern Europe 1 2000 40 055 40 055 excellent very poor fair 0 0
Martinique Central America 1 3000 115 445 115 445 very good fair good 0 n.a.
Mauritania Western Africa 13 49 200 8 026 288 4 147 985 very poor good fair 1323 51 061
Mauritius Eastern Africa 1 17 500 183 361 183 361 very good good very good 0 0
Mexico Central America 32 6 104 956 6 121 135 4 072 214 very poor fair fair 1 956 154 n.a. Moldova Rep. Eastern Europe 1 307 000 3 388 941 3 388 941 very poor very good good 3987 n.a.
Mongolia East Asia 18 57 300 8 678 282 7 070 172 very poor good fair 138 701 n.a.
Morocco Northern Africa 27 1 258 200 2 493 714 2 336 883 poor good fair 0 92 040
Mozambique Southern Africa 10 116 715 7 880 772 5 426 595 very poor very good good 0 0 Myanmar South-East Asia 14 1 841 320 4 783 485 3 921 831 very poor fair fair 13 091 993 3 582 744
Namibia Southern Africa 10 6142 8 246 880 7 608 665 very poor good good 0 0
Nepal South Asia 75 1 168 349 196 349 143 668 very good good very good 2 067 770 2 463 348
Netherlands Western Europe 1 565 000 3 478 820 3 478 820 very poor fair poor 5418 0
New Zealand Oceania 16 577 882 1 679 748 2 996 306 poor fair fair 0 n.a.
Nicaragua Central America 19 61 365 673 557 427 918 good fair fair 6364 n.a.
Niger Western Africa 8 66 480 14 845 330 2 353 231 poor fair poor 0 109 218
Nigeria Western Africa 9 300 350 10 144 308 12 469 784 very poor poor poor 0 167 607
Northern Marianna Islands
Oceania 4 60 7843 4708 excellent very poor good 3233 n.a.
Norway Western Europe 1 127 000 31 435 582 31 435 582 very poor poor poor 1053 n.a.
Oman Near East 8 72 630 3 917 788 1 322 773 poor very good very good 123 569 n.a.
Pakistan South Asia 112 14 417 464 771 245 490 643 good good good 3 393 750 25 964 976
Palestine Near East 17 19 466 36 577 11 530 excellent good very good 0 n.a.
Panama Central America 10 34 626 749 726 669 811 fair poor fair 595 n.a.
Paraguay South America 1 67 000 40 033 587 40 033 587 very poor poor poor 0 n.a.
Peru South America 25 1 195 228 5 186 247 2 540 813 poor fair fair 116 131 n.a.
Philippines South-East Asia 12 1 550 000 2 476 588 2 420 277 poor fair fair 3 668 113 17 486
Poland Eastern Europe 1 100 000 31 074 704 31 074 704 very poor fair fair 2179 0
Portugal Southern Europe 7 632 000 1 303 693 1 435 741 poor good good 17 812 100 129
Puerto Rico Central America 79 37 079 11 348 12 715 excellent fair very good 0 n.a.
Qatar Near East 1 12 520 1 125 261 1 125 261 poor good good 0 n.a.
Reunion Eastern Africa 1 12 000 250 925 250 925 good very poor good 0 8 827
Romania Eastern Europe 1 2 880 000 23 715 940 23 715 940 very poor fair fair 39 938 0
Russian Federation
Russian Federation
88 4 878 000 19 234 888 5 028 884 very poor poor poor 6 180 020 n.a.
Rwanda Eastern Africa 1 4000 2 531 838 2 531 838 poor good fair 0 0
Sao Tome and Principe
Western Africa 1 9700 96 663 96 663 excellent very poor good 0 0
Saudi Arabia Near East 14 1 730 767 13 785 211 5 964 304 very poor good good 42 172 n.a.
Senegal Western Africa 4 71 400 4 932 187 1 995 968 poor good good 0 283 781
Serbia and Montenegro
Eastern Europe 1 57 000 10 247 622 10 247 622 very poor poor poor 4 944 0
Sierra Leone Western Africa 5 29 360 1 448 465 2 475 078 poor good fair 0 2224
Slovakia Eastern Europe 1 174 000 4 889 727 4 889 727 very poor fair fair 2036 0
Slovenia Eastern Europe 1 2000 2 024 675 2 024 675 poor poor poor 2963 0
Somalia Eastern Africa 17 200 000 3 738 850 3 939 119 very poor fair poor 0 521 289
South Africa Southern Africa 45 1 270 000 2 716 145 3 074 240 very poor fair poor 0 143 529 Spain Southern Europe 17 3 268 306 2 968 187 3 323 641 very poor good good 349 598 1 332 525
Sri Lanka South Asia 26 570 000 256 983 285 239 good good good 2 301 825 2 257 224
St. Kitts and Nevis Central America 1 18 29 556 29 556 excellent fair very good 0 n.a.
St. Lucia Central America 1 297 63 905 63 905 excellent good very good 0 n.a.
Sudan Eastern Africa 62 1 946 200 4 052 908 2 286 757 poor very good good 0 944 060
Suriname South America 1 51 180 14 674 639 14 674 639 very poor poor poor 0 n.a.
Swaziland Southern Africa 1 67 400 1 732 063 1 732 063 poor very poor poor 0 0
Table A1. Continued.
Switzerland Western Europe 1 25 000 4 058 894 4 058 894 very poor fair fair 28 105 0
Syria Near East 13 1 266 900 1 433 681 1 022 356 poor good good 184 991 n.a.
Taiwan, Province of China
East Asia 23 525 528 158 178 140 295 very good very good very good 1 765 431 n.a. Tajikistan Central Asia 2 719 200 7 090 702 3 150 233 very poor good good 1 021 262 n.a.
Tanzania Southern Africa 1 150 000 94 549 369 94 549 369 very poor poor poor 0 0
Thailand South-East Asia 76 4 985 708 680 171 377 064 good very good very good 26 609 734 6 630 135
Togo Western Africa 1 7008 5 726 793 5 726 793 very poor fair poor 0 680
Trinidad and Tobago
Central America 1 3600 504 986 504 986 fair fair fair 0 n.a.
Tunisia Northern Africa 23 384 943 673 995 332 076 good fair fair 0 0
Turkey Near East 73 4 185 910 1 069 316 1 099 341 poor good good 2 004 936 453 243
Turkmenistan Central Asia 5 1 744 100 9 779 032 8 841 162 very poor very good good 2 383 627 n.a.
Uganda Eastern Africa 11 9 120 2 203 246 5 007 171 very poor very good good 0 0
Ukraine Eastern Europe 1 2 454 000 56 917 149 56 917 149 very poor fair fair 73 986 n.a. United Arab
Emirates
Near East 8 280 341 984 729 645 184 fair good good 78 n.a.
United Kingdom Western Europe 1 142 687 24 408 258 24 408 258 very poor fair poor 58 709 0 United States
of America
North America 3506 27 913 872 269 534 238 739 very good good very good 10 719 481 n.a.
Uruguay South America 1 181 200 17 703 613 17 703 613 very poor good good 0 n.a.
US Virgin Islands Central America 2 185 18 007 20 972 excellent very poor good 0 n.a.
Uzbekistan Central Asia 13 4 223 000 3 264 072 1 197 314 poor very good very good 5 210 733 n.a.
Venezuela South America 24 570 219 3 800 359 1 332 888 poor fair fair 9988 n.a.
Vietnam South-East Asia 32 3 000 000 1 027 496 740 739 fair good good 10 747 900 8 192 239
Yemen Near East 19 388 000 2 352 871 920 210 fair good good 83 407 n.a.
Zambia Southern Africa 7 46 400 10 773 311 3 797 335 very poor fair fair 0 0
Zimbabwe Southern Africa 1 116 577 39 184 102 39 184 102 very poor poor poor 0 0
Edited by: K. Roth
References
Alcamo, J., D¨oll, P., Henrichs, T., Kaspar, F., Lehner, B., R¨osch, T., and Siebert, S.: Global estimates of water withdrawals and avail-ability under current and future “business-as-usual” conditions, Hydrological Sciences Journal, 48(3), 339–348, 2003.
Boucher, O., Myhre, G., and Myhre, A.: Direct human influence of irrigation on atmospheric water vapour and climate, Clim. Dyn., 22(6–7), 597–603, 2004.
Bruinsma, J. (Ed.): World agriculture: towards 2015/2030. An FAO perspective, FAO and Earthscan Publ., Rome, London, 2003. D¨oll, P.: Impact of Climate Change and Variability on Irrigation
Requirements: A Global Perspective, Clim. Change, 54(3), 269– 293, 2002.
D¨oll, P. and Hauschild, M.: Model-based scenarios of water use in two semi-arid Brazilian states, Regional Environmental Change, 2, 150–162, 2002.
D¨oll, P. and Siebert, S.: A digital global map of irrigated areas, ICID Journal, 49(2), 55–66, 2000.
European Commission, Joint Research Centre: Global Land Cover 2000 database, http://www-gvm.jrc.it/glc2000/defaultGLC2000. htm, 2003.
Faures, J. M., Hoogeveen, J., and Bruinsma, J.: The FAO irrigated area forecast for 2030, FAO, Rome, Italy, 2002.
Food and Agriculture Organization of the United Nations (FAO): FAO Statistical Databases (FAOSTAT), http://faostat.fao.org/, 2005a.
Food and Agriculture Organization of the United Nations (FAO): Review of agricultural water use per country, Rome, Italy, http: //www.fao.org/ag/agl/aglw/aquastat/water use/index.stm, 2005b. Heilig, G. K.: Can China feed itself? International Institute for Applied Systems Analysis (IIASA), Laxenburg, Austria, http: //www.iiasa.ac.at/Research/LUC/ChinaFood/index h.htm, 1999. Loveland, T. R., Reed, B. C., Brown, J. F., Ohlen, D. O., Zhu, J., Yang, L., and Merchant, J. W.: Development of a Global Land Cover Characteristics Database and IGBP DISCover from
1-km AVHRR Data, Int. J. Remote Sensing, 21(6/7), 1303–1330, 2000.
Oki, T., Agata, Y., Kanae, S., Saruhashi, T., Yang, D., and Mu-siake, K.: Global assessment of current water resources using total runoff integrating pathways, Hydrological Sciences – Jour-nal des Sciences Hydrologiques, 46(6), December 2001, Special issue: Can Science and Society Avert the World Water Crisis in the 21st Century?, 983–995, 2001.
De Rosnay, P., Polcher, J., Laval, K., and Sabre, M.: Estimating the atmospheric impact of irrigation in India using a modified land surface model, Global Energy and Water Cycle Experiment, 13(1), 7–9, 2003.
Siebert, S. and D¨oll, P.: A digital global map of irrigated areas – An update for Latin America and Europe, Kas-sel World Water Series 4, Center for Environmental Sys-tems Research, University of Kassel, Germany, 14 pp. + Appendix, http://www.geo.uni-frankfurt.de/fb/fb11/ipg/ag/dl/f publikationen/2001/siebert doell kwws4.pdf, 2001.
Shiklomanov, I. A.: Appraisal and Assessment of World Water Re-sources, Water International, 25(1), 11–32, 2000.
United States Geological Survey (USGS): Global Land Cover Char-acteristics database Version 2.0, http://lpdaac.usgs.gov/glcc/glcc. asp, 2000.
United Nations Commission on Sustainable Development (UNCSD): Comprehensive assessment of the freshwa-ter resources of the world, Report E/CN.17/1997/9, http: //www.un.org/esa/sustdev/sdissues/water/water documents.htm, 1997.
Veneman, A. M., Jen, J. J., and Bosecker, R. R.: 2002 Census of Agriculture – Farm and Ranch Irrigation Survey (2003), United States Department of Agriculture (USDA), National Agricultural Statistics Survey (NASS), http://www.usda.gov/nass/, 2004. V¨or¨osmarty, C. J., Green, P., Salisbury, J., and Lammers, R. B.:
Global Water Resources: Vulnerability from Climate Change and Population Growth, Science, 289, 284–288, 2000.
Wood, S., Sebastian, K., and Scherr, S. J.: Pilot analysis of global ecosystems – Agroecosystems, International Food Policy Re-search Institute (IFPRI) and World Resources Institute (WRI), Washington, D.C., 2000.