HAL Id: hal-02625453
https://hal.inrae.fr/hal-02625453
Submitted on 26 May 2020
HAL is a multi-disciplinary open access
archive for the deposit and dissemination of
sci-entific research documents, whether they are
pub-lished or not. The documents may come from
teaching and research institutions in France or
abroad, or from public or private research centers.
L’archive ouverte pluridisciplinaire HAL, est
destinée au dépôt et à la diffusion de documents
scientifiques de niveau recherche, publiés ou non,
émanant des établissements d’enseignement et de
recherche français ou étrangers, des laboratoires
publics ou privés.
Distributed under a Creative Commons Attribution| 4.0 International License
rural-urban habitats
Anna Wereszczuk, Raphaël Leblois, Andrzej Zalewski
To cite this version:
Anna Wereszczuk, Raphaël Leblois, Andrzej Zalewski. Genetic diversity and structure related to
expansion history and habitat isolation: stone marten populating rural-urban habitats. BMC Ecology,
BioMed Central, 2017, 17, �10.1186/s12898-017-0156-6�. �hal-02625453�
RESEARCH ARTICLE
Genetic diversity and structure related
to expansion history and habitat isolation: stone
marten populating rural–urban habitats
Anna Wereszczuk
1*, Raphaël Leblois
2,3and Andrzej Zalewski
1Abstract
Background: Population genetic diversity and structure are determined by past and current evolutionary processes,
among which spatially limited dispersal, genetic drift, and shifts in species distribution boundaries have major effects. In most wildlife species, environmental modifications by humans often lead to contraction of species’ ranges and/or limit their dispersal by acting as environmental barriers. However, in species well adapted to anthropogenic habitat or open landscapes, human induced environmental changes may facilitate dispersal and range expansions. In this study, we analysed whether isolation by distance and deforestation, among other environmental features, promotes or restricts dispersal and expansion in stone marten (Martes foina) populations.
Results: We genotyped 298 martens from eight sites at twenty-two microsatellite loci to characterize the genetic
variability, population structure and demographic history of stone martens in Poland. At the landscape scale, limited genetic differentiation between sites in a mosaic of urban, rural and forest habitats was mostly influenced by isola-tion by distance. Statistical clustering and multivariate analyses showed weak genetic structuring with two to four clusters and a high rate of gene flow between them. Stronger genetic differentiation was detected for one stone marten population (NE1) located inside a large forest complex. Genetic differentiation between this site and all others was 20% higher than between other sites separated by similar distances. The genetic uniqueness index of NE1 was also twofold higher than in other sites. Past demographic history analyses showed recent expansion of this species in north-eastern Poland. A decrease in genetic diversity from south to north, and MIGRAINE analyses indicated the direc-tion of expansion of stone marten.
Conclusions: Our results showed that two processes, changes in species distribution boundaries and limited
dispersal associated with landscape barriers, affect genetic diversity and structure in stone marten. Analysis of local barriers that reduced dispersal and large scale analyses of genetic structure and demographic history highlight the importance of isolation by distance and forest cover for the past colonization of central Europe by stone marten. This confirmed the hypothesis that human-landscape changes (deforestation) accelerated stone marten expansion, to which climate warming probably has also been contributing over the last few decades.
Keywords: Genetic structure, Genetic diversity, Isolation, Environmental barrier, Expansion, Martes foina
© The Author(s) 2017. This article is distributed under the terms of the Creative Commons Attribution 4.0 International License (http://creativecommons.org/licenses/by/4.0/), which permits unrestricted use, distribution, and reproduction in any medium, provided you give appropriate credit to the original author(s) and the source, provide a link to the Creative Commons license, and indicate if changes were made. The Creative Commons Public Domain Dedication waiver (http://creativecommons.org/ publicdomain/zero/1.0/) applies to the data made available in this article, unless otherwise stated.
Background
The genetic structure of a species is driven by past and ongoing processes within its populations [1–5]. These processes can be divided into two groups: (1) processes
within a species range (e.g. affecting population size and densities, and restricting dispersal), and (2) processes caused by changes in the distribution boundaries of a species. Among past processes, the main driver of current genetic structure is the expansion or contraction of a spe-cies’ range after changes in biotic or abiotic conditions; species re-colonization of the continent from glacial ref-uges was the most important of these. Species expansion
Open Access
*Correspondence: awereszczuk@ibs.bialowieza.pl
1 Mammal Research Institute, Polish Academy of Sciences, Białowieża,
Poland
or contraction is often accelerated by climate changes, and some models predict that even small changes in, for example, average temperature, may result in large shifts in a species range [6, 7]. The second important trigger accelerating expansion or contraction of species range is habitat changes, which can be related to climate changes but also to human-mediated habitat changes (e.g. defor-estation and development of large areas of open habitats). In the last 100 years, climate warming and human-induced habitat changes (e.g. land use changes) have driven the northwards expansion of many species, such as the golden jackal [8] and wasp spider [9]. However, in some species expansion or contraction goes unrecorded, as is the case for elusive and shy species for which obser-vations are limited. To fill this knowledge gap, methods other than observation should be used to record changes in range and demographic expansion, and evaluate fac-tors affecting these changes.
A number of genetic signatures may be used to detect demographic changes, particularly range expansions or contractions [10]. Colonization of new areas is due to demographic expansion; thus population growth is one of the most general consequences of range expansion, and it affects genetic diversity and structure [5, 10]. The genetic diversity of an expanded population is related to the pro-cess of expansion, which may occur gradually or with serial founder events, as well as to the number of immi-grants. During expansion with serial founder events, genetic diversity is higher in the area of initial expansion and gradually decreases along the expansion axis [10, 11]. Both the strength of the founder events and the level of dispersal at the expansion front shape the reduction of genetic diversity at the edge of the species’ range. How-ever, peripheral populations may also undergo differen-tiation due to genetic drift: rare alleles that reach higher frequencies due to surfing and mutation are character-istic of population frontiers [10–12]. Therefore, all these genetic parameters may show that the population was (or is) in expansion and show the direction of that expansion.
Within a species range, variations in genetic diver-sity and its structure are often related to population connectivity by gene flow [13, 14]. Animal dispersal is intrinsically linked to biological movement capabili-ties but can also be restricted by geographic or environ-mental barriers [15, 16]. Usually such barriers comprise mountains, rivers and other natural landscape features, as well as habitat fragmentation caused by humans. In most cases, habitat modified by humans divides natural landscapes with highly unfavorable habitat (e.g. conver-sion of forests into open fields); this, in turn, reduces the dispersal rate of animals as connectivity between areas of optimal habitat is disrupted [17, 18]. As barri-ers reduce—or in extreme cases, preclude—dispbarri-ersal,
gene flow is restricted, which may lead to isolation of populations. Isolated populations suffer from the effects of genetic drift, which leads to loss of genetic diversity and increased differentiation from neighboring popula-tions [19, 20]. Therefore, highly isolated populations, sur-rounded by very unfavorable anthropogenic habitats (e.g. urban and rural areas) should show high genetic differ-entiation from neighboring populations and low genetic diversity [21].
Dispersal restricted by anthropogenic habitat changes depends on species adapting to new human-modified habitats. For some species, human-induced changes may enhance dispersal and connectivity and may also accel-erate colonization of new areas [8, 9]. Species that have adapted to anthropogenic habitats since Neolithic times can use such areas as optimal habitat [22–24] but may, in turn, find some natural habitats to be unfavorable. There-fore, for these species, large natural areas such as large forest patches could act as barriers reducing dispersal and colonization of new areas is only possible after defor-estation and the emergence of more open landscapes within urban or rural areas [9, 23].
The stone marten (Martes foina) is a species that has adapted to anthropogenic habitats. It began to colonize Europe alongside Neolithic human societies and is now widespread across large parts of Europe from Portugal to Eastern Russia [23, 25]. Across its geographic range, the stone marten is a habitat-opportunistic carnivore [26]. It occupies a wide variety of habitat types, from wood-lands, rocky areas, steppe and semi-desert, fields, pas-tures, urban and rural areas. In south-western Europe, the stone marten usually occurs in forests, while in cen-tral and north-eastern Europe it uses urbanized areas more often [22, 27–29]. Stone marten also inhabit for-est-steppe, steppe zones, semi-desert regions and rocky forests in south-west Asia [30]. All this data shows that stone marten habitat use is dependent on its geographi-cal location and is probably constrained by abiotic condi-tions. The observed preference for urban and rural areas, and avoidance of large, continuous forest complexes without human settlements at the northern edge of its range, suggests that habitat selection is mediated by cli-matic conditions [27]. This suggestion is in concordance with the hypothesis that explains the history of stone marten colonization of Europe. Sommer and Benecke [23] proposed that the stone marten was late to colonize northern Europe due to a lack of human settlements and large areas of forest cover. The stone marten uses build-ings as well-insulated denning sites during winter to mitigate heat loss, and such behavioral thermoregulation probably allows it to survive in areas with cold climates [27]. Therefore, climate warming and the ongoing devel-opment of urban and rural areas at the northern edge of
its range should have facilitated dispersal and coloniza-tion of new areas in the last decades.
Our knowledge about range expansion, coloniza-tion history and possible barriers reducing stone mar-ten dispersal at the northern edge of its range is limited. Thus, in this study we used microsatellite markers to: (1) explore the genetic diversity and structure of the stone marten in Poland, (2) investigate its demographic history, in light of the hypothesis about the recent expansion of stone marten populations in north-eastern Europe and (3) analyze the impact on gene flow of potential environ-mental barriers. We predicted that: (1) stone marten col-onized north-eastern Poland in the last decades when the climate warmed and human-induced habitat changed, (2) there are no barriers for dispersal of habitat-opportun-istic stone marten in a mosaic of agriculture and natural habitats, but (3) large primeval forest complexes are a barrier for dispersal between populations of this species, and thus affect its pattern of genetic variability.
Methods
Sampling and microsatellite genotyping
Tissue samples of 298 individuals were collected in Poland between 1994 and 2015 from eight sites in five regions: north-east (NE), central-east (CE) south-east (SE), south-west (SW) and north-west (NW) Poland. DNA samples were obtained from carcasses of martens killed by cars and from hunters or trapped individuals. We only trapped individuals in NE1 and NE2 sites, where we acquired permission from private land owners to conduct studies on their properties. All marten capture and handling procedures were approved by the Minis-try of Environment and the Local Ethics Committee for Animal Experiments at the University of Białystok (no: 756/16/98; 6713-21/35088/11/abr; DL.gł-6713-14/18806/11/abr; 2011/9). Tissue samples, a 1 cm2
piece of skin or muscle, were placed in ethanol and kept frozen at − 20 °C until DNA extraction. The locations of the samples were accurate to 0.5 km.
We extracted DNA from tissue samples using a DNeasy Blood and Tissue Kit (Qiagen) according to the manufac-turer’s instructions. Twenty-two microsatellite loci devel-oped for martens were used to genotype all individuals: Ma8, Lut615, Mlut27, Mp0059, Mf3.2, Mf4.10, Mf3.7, Mf6.5, Mvi57, Mvi072, Ma1, Ma2, Gg454, Mel1, Mer041, Mar43, Mar15, Mf4.17, Mf8.8, Mf8.10, Mar08, Mf1.3 [31–40]. Microsatellites were amplified in seven multi-plex reactions prepared using a Multimulti-plex PCR Kit (Qia-gen) following the manufacturer’s instructions. Reaction mixtures contained approximately 1 μl of template DNA in a total volume of 5.0 μl. The thermal cycle, performed in a DNA Engine Dyad Peltier Thermal Cycler (Bio-Rad), consisted of an initial denaturation step at 95 °C
for 15 min, followed by 30 cycles at 94 °C for 30 s, 54, 57 and 60 °C for different multiplex sets for 1 min 30 s, and 72 °C for 1 min, and then a final extension period of 30 min at 60 °C. The amplified fragments were sepa-rated by electrophoresis using an ABI 3130XL Genetic Analyzer (Applied Biosystems) with the internal size standard GS500 LIZ™ (Applied Biosystems) using Gen-eMarker 1.85.
Genetic diversity
We tested for deviation from Hardy–Weinberg equilib-rium and linkage disequilibequilib-rium between pairs of loci within each sample site with GENEPOP 4.4 [41] using default parameter values, and Bonferroni’s correction was applied to multiple comparisons. In order to estimate the presence of null alleles we assessed whether heterozygote deficits may be due to null alleles with MICROCHECKER 2.2.3 [42]. Including closely related individuals can increase genetic structure; therefore, we also analysed pairwise relatedness to identify related individuals using the Queller and Goodnight estimator (QGM) [43] imple-mented in GENALEX version 6.5 [44] and then removed from the dataset one randomly-selected individual from each related pair, defined as pairs with QGM > 0.7. For each site, the genetic variability of each locus, and the mean for all loci were described using the mean allele number (A), mean number of private alleles, observed heterozygosity (HO), unbiased expected heterozygosity
(uHE) and inbreeding coefficients (FIS) using FSTAT 2.9.3
[45] and GENALEX. The mean number of alleles per locus is expected to be sensitive to sample size; therefore, we also calculated the allelic richness (Ar) according to the smallest sample size (N = 12) using FSTAT.
To test the potential influences of different sampling periods on genetic diversity, we compared Ar and HE for
two periods: 1994–2007 and 2008–2015 for NE1, because only from site NE1 did we obtain a minimum of ten indi-viduals in each period. We tested differences among Ar and HE using Friedman’s test [46].
Population genetic structure and recent migration
Genetic structure was explored using individual-based Bayesian clustering analyses with the program STRUC-TURE v. 2.3.4 (without spatial information) [47], TESS 2.3.1 (incorporating spatial information) [48, 49] and a discriminant analysis of principal components (DAPC) [50]. First, to estimate the most likely number of genetic clusters (K) in STRUCTURE, no prior information about the location of populations was assumed and an admix-ture model with uncorrelated alleles was used with a burn-in phase of 1,000,000 iterations, followed by a run phase of 1,000,000 iterations. Posterior probability values for the number of clusters (K), ranging from 1 to 10, were
calculated from ten independent runs to establish con-sistency. The most likely number of clusters was deter-mined based on change of the posterior probability of the model, and its rate of change with respect to K using the ΔK statistic [51].
Secondly, TESS was run using a Convolution Gaussian prior for spatial admixture (BYM) model with the spatial interaction parameter (ψ) set at 0.6 [48]. This parameter weighs the relative importance given to the geographical distance between sites; therefore to check the influence of this parameter we also considered ψ at 0.4 and 0.0. We considered ten replicate runs of 20,000 burn-in iterations followed by 30,000 iterations. The number of clusters was set to range from K = 2 to K = 10. The preferred K was selected by comparing the individual assignment results and the deviance information criterion (DIC) [49]. Mean DIC values were plotted against K values, and the most likely value of K was selected by visually assessing the point at which DIC first reached the plateau of the DIC curve.
Next, DAPC was used to identify genetic clusters by sequential clustering and model selection. This method provides a description of the genetic structuring using coefficients of alleles in linear combinations that give the largest between-group and smallest within-group variances in these loadings. In contrast to analyses in STRUCTURE and TESS, DAPC cluster detection within the genetic data does not consider any assumptions about HW proportions or linkage equilibrium [52]. The most likely number of genetic clusters associated with the lowest Bayesian Information Criterion values was established using the R package adegenet 2.0.1. [52]. We explored values for the number of clusters between 1 and 30 [52]. In order to avoid overfitting of the discriminant functions due to retaining too many PCs, we performed DAPC retaining the optimal number of PCs based on the calculation of the α-score.
The level of genetic differentiation was estimated by FST [53], and Jost’s DEST [54], which corrects the FST
depend-ency for the amount of within-site variation, using FSTAT and GENALEX, respectively (significance was assessed by 28,000 permutations for FST and 9999
per-mutations for DEST). Differentiation between sample sites
based on FST was represented by a dendrogram using the
program MEGA v.6 [55]. Genetic differentiation was also described using the genetic uniqueness index (GUI), cal-culated as the average of the pairwise FST values observed
between a site and all other sites [56]. To detect restric-tion in gene flow between sites in relarestric-tion to forest cover, the GUI was correlated with the proportion of forest in the buffer zone (20 km width) around each site. Buffer zones and proportions of forests were calculated using
ArcGIS 10.2.1 (Environmental Systems Research Insti-tute, Redlands, California).
We tested the presence of isolation by distance (IBD) across the study area using a Mantel test [57]. The Mantel test was performed between a matrix of pairwise genetic distances between sites (FST/(1 − FST) and the
loga-rithm of geographical Euclidian distance, measured as a straight-line between the central point of each site, using the Isolation by Distance Web Service (http://ibdws.sdsu. edu/~ibdws/) [58], for all sites and next for all sites after removing NE1. In addition, we calculated IBD between NE1 and all other sites separately to analyse the influ-ence of the large forest complex surrounding NE1 on the genetic differentiation of this site. We calculated a simple regression between the pairwise genetic distances and the logarithm of geographical distance for all sites after removing NE1 and next for NE1 and each of the other sites to compare a regression slope.
Current rates of migration between populations were estimated using a Bayesian MCMC method implemented in BIMR 1.0, which is effective at estimating migration rate when genetic structure is weak [59]. Twenty rep-licates were performed for each MCMC run of 100,000 iterations before sampling (burning), and 20,000 itera-tions used for posterior estimation (sample size) with a thinning interval of 100. Each of the 20 replicates started with 20 short pilot runs of 1000 iterations each in which incremental values were tuned by the program in an effort to obtain acceptance rates between 25 and 45%. In the next step, the run with the lowest Bayesian devi-ance (Dassign) was chosen to extract parameter estimates.
Posterior densities were visually inspected, and the mode (point estimate) and 95% highest posterior density inter-val were computed on those densities.
Past demographic processes
In order to test for recent population contractions or expansions, we used the program BOTTLENECK v.1.2.02 [60]. We tested for heterozygosity excess or deficiency over all loci at each sample site using Wilcoxon signed rank tests based on 10,000 replications. Three models of microsatellite mutation were considered: the stepwise mutation model (SMM), and the two-phase model (TPM) with the variance for mutation size set to 12 and two dif-ferent values for the proportion of mutations attributed to the SMM—78 and 95% following the recommendations of [61] and [60], respectively. We also used BOTTLENECK to test for a deficit of rare alleles (mode shift) in the distri-bution of allele frequencies, which is expected if a recent bottleneck had occurred [62].
Populations demographic history was further explored using MIGRAINE 0.5 (http://kimura.univ-montp2. fr/~rousset/Migraine.htm) under single population
models with a single continuous past variation in popu-lation size (OnePopVarSize) and two past variations in population size (OnePopFounderFlush) [63, 64]. To infer model parameters, the program uses a class of coales-cent-based importance sampling algorithms (IS) [64–67]. All analyses were run using a generalized stepwise muta-tion model (GSM), which is the most realistic model for microsatellite markers and reduces the risk of false posi-tives in bottleneck testing [61, 63]. First, for each sample we inferred point estimates and 95% confidence intervals for the four parameters of the OnePopVarSize model: pGSM, 2Nµ, 2Nancµ, and Dg/2N, as well as two extra
composite parameters, namely Nratio and Dg*µ, where µ is
the mutation rate per generation per locus, Dg is the time of the demographic change in generations, N = Ncur is the
current population size and Nanc is the ancestral
popula-tion size, expressed as the number of genes. Second, we fixed pGSM, the parameter of the geometric distribution of mutation step size under the GSM, at 0.3 based on the results obtained in the previous analysis and inferred the remaining four parameters of the OnePopFounderFlush model: 2Nµ, 2Nfounderµ, 2Nancµ and Dg/2N, as well as four
extra parameters: Nancratio, NcurNfounderratio and Nfounder N-anc ratio, where Nfounder is the founder population size, and
Dg*µ. In the OnePopFounderFlush demographic model,
NfounderNanc ratio = Nfounder/Nanc allows the quantification
and testing of a first discrete change in population size (typically a founder event) while NcurNfounder ratio = Ncur/ Nfounder equivalently characterizes the second
continu-ous change in population size, typically an expansion fol-lowing the founder event. Extra parameters were used to better characterize the timing, strength and direction of the demographic events, e.g. Nratio = Nanc ratio = Ncur/Nanc
quantifies the strength of the change between current and ancestral population sizes—it is < 1 for a contraction, and > 1 for an expansion. Past changes in population size are thus significant when the Nratio’s value 1 lies outside
theirs 95% confidence intervals (CI) [63]. To convert scaled parameters (i.e. 2Nµ, 2Nancµ, 2Nfounderµ, Dg/2N
and Dg*µ) into biological ones (i.e. N, Nanc, Nfounder and Dg), we used a mutation rate of 5 × 10⁻⁴ per locus per
generation for all microsatellite loci, a classical average value derived from many different species [68]. We first inferred single past changes in population sizes under the OnePopVarSize demographic model for each of the eight sites separately. Then, we performed the analysis under the OnePopFounderFlush demographic model for sites in which we (1) detected past contractions, and (2) suspected potential past founder events followed by expansions. Analyses under OnePopFounderFlush were thus run separately for the isolated site NE1 and for the pooled sites NE2 + NE3 and CE1 + CE2 due to the lack of genetic structure between them and to increase the
signal strength with larger sample sizes. For both demo-graphic models preliminary runs for every dataset were done using 200 points, 200 trees, and 10 iterations. Next, for the final runs, we used 400 points, 50,000 trees, and 10 iterations with narrow parameter ranges deduced from the preliminary runs.
Results
Genetic diversity
Twenty-two loci were genotyped for the 298 individuals sampled from the eight study sites. Thirteen individuals with high relatedness to others (QGM > 0.7) and thir-teen with missing genotypes were removed from this final dataset. Finally, 272 full multi-locus genotypes were obtained with 0.30% missing data. After sequential Bon-ferroni correction (p < 0.000027), deviation from HWE was detected in sites NE2 and CE2 for locus Ma1. Null alleles were found for one locus (Ma1) in four sites and for four loci in one or two sites only (Additional file 1: Table S1). Due to the presence of null alleles in 4 sites, locus Ma1 was subsequently excluded from further analysis. Two out of 1848 pairwise locus exact tests of linkage disequilibrium were significant after Bonferroni correction. After excluding Ma1, deviation from HWE was detected in site CE2 only (Table 1). There was no evidence that different sampling periods (1994–2007 vs 2008–2015) had different levels of genetic diversity: allelic richness and expected heterozygosity did not vary between sampling periods (Friedman test; p = 0.225 and p = 0.074, respectively). Therefore we pooled samples from different periods in subsequent analysis.
The remaining 21 microsatellite loci were polymor-phic in all sample sites with a total number of alleles per locus ranging from 3 to 10 and a mean number of alleles per locus of 5.52 (SE ± 0.31). The mean number of alleles (A) per locus within each sample site ranged from 3.43 to 4.33, the allelic richness (Ar) from 2.98 to 3.80 and the number of private alleles from zero to 0.33 (Table 1). Mean observed heterozygosity (HO) over all
loci was 0.51 (SE = 0.02) and ranged from 0.47 to 0.57, while unbiased expected heterozygosity (uHE) was 0.53
(SE = 0.02) and ranged from 0.47 to 0.59 (Table 1). Both the number of alleles and allelic richness were lowest in site NE1 (p < 0.0001; Friedman test). After excluding site NE1, allelic richness significantly decreased (Spearman rang correlation, rS = − 0.79, p = 0.048), and expected
heterozygosity showed a decreasing trend from south to north (rS = − 0.72, p = 0.067; Fig. 1).
Patterns of genetic structure, differentiation and isolation by distance
Cluster analysis with the non-spatial algorithm imple-mented in STRUCTURE indicated the presence of two to
four genetic groups at the uppermost level, supported by the highest maximal posterior probability, the lowest var-iance between every run and ΔK value (Additional file 1: Figure S1). The proportion of martens assigned to cluster 2 (yellow) and 4 (blue) in model K = 4 gradually changed from north-east to south-west. The same pattern of grad-ually changing proportions of clusters from north-east to south-west was also observed in models K = 2 and K = 3, which is probably due to isolation by distance (Fig. 2). The majority of the sampling areas showed a weak structure, except NE1 in which the proportion of membership was above 70% in all three models K = 2–4 (Fig. 2; Additional file 1: Table S2). Individuals from SW1 also had high membership coefficients (70–80%) in models K = 2–3.
TESS gave results similar to those obtained with STRUC-TURE. The DIC plot of the TESS runs showed the plateau at K = 3, and additionally the individual assignment was high for only three clusters also at K = 4 (Fig. 2; Addi-tional file 1: Figure S2). Individuals from site NE1 were assigned to cluster 1, cluster 2 was composed of individu-als sampled in north-eastern and central Poland (NE2, NE3, CE1, CE2) and cluster 3 was formed by individuals from SE1, SW1 and NW1. TESS produced stable popula-tion clusters that were similar and did not change under the influence of different spatial interaction parameters (ψ) values (Additional file 1: Figure S3).
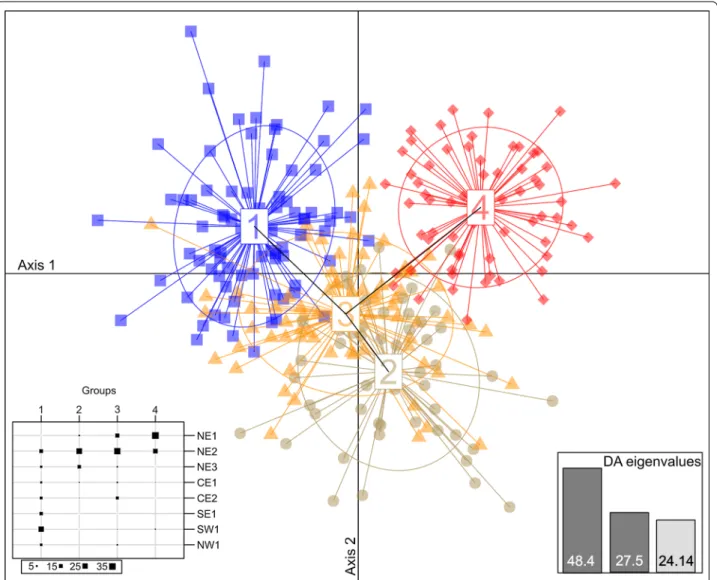
The multivariate DAPC identified four clusters based on the Bayesian Information Criterion but they overlap
Table 1 Genetic diversity indices of samples of stone marten from eight sites in Poland
N, number of samples; A, mean number of alleles per locus; Ar, allelic richness estimated by rarefaction based on a minimum sample size n = 12; Rare A, number of alleles with frequency ≤ 0.07 across all loci; A private, private alleles; HO, observed heterozygosity; uHE, unbiased expected heterozygosity. The p value cutoff after
Bonferroni correction is 0.000027
Region Site N A Ar Rare A A private HO HE/uHE Overall FIS HWE (p value)
Northeast NE1 58 3.57 2.98 22 0.00 0.47 0.47/0.47 − 0.003 0.4095 NE2 95 4.33 3.40 31 0.33 0.50 0.52/0.52 0.049 0.0001 NE3 25 3.86 3.45 19 0.14 0.53 0.53/0.54 0.010 0.1117 Central-east CE1 15 3.81 3.68 20 0.09 0.58 0.54/0.56 − 0.045 0.9519 CE2 22 3.86 3.50 23 0.05 0.46 0.53/0.54 0.157 0.0000 Southeast SE1 14 3.90 3.80 15 0.09 0.54 0.57/0.59 0.083 0.0519 Southwest SW1 31 4.14 3.60 26 0.14 0.52 0.54/0.55 0.055 0.0393 Central-west NW1 12 3.43 3.43 10 0.00 0.50 0.50/0.53 0.032 0.1023
Fig. 1 Variation of allelic richness (Ar) and unbiased expected heterozygosity (uHE) of stone marten from eight sites from Poland in relation to latitude. Ar and uHE of site NE1 were marked separately in grey
Fig. 2 The average proportion of membership identified by STRUCTURE (a) and the assignment of stone marten from Poland in the genetic
clusters from 2 to 4 (b) identified by STRUCTURE (above panel for each K) and TESS (below panel for each K). Single vertical bar represents the indi-vidual’s estimated proportion of membership to the genetic cluster. The locality of origin for each individual is indicated below
to a large extent (Fig. 3; Additional file 1: Table S2). As for STRUCTURE, the different clusters inferred do not glob-ally correspond to the sampling sites, and each of the four groups consist of individuals from at least two or three sites (Additional file 1: Table S2). Some samples from all sites (except NE1) were assigned to cluster 1, with a higher assignment of samples from SE1, SW1 and NW1 (Fig. 3; Additional file 1: Table S2). The samples from sites NE2, NE3 and CE1 form cluster 2 and samples from NE2, NE3, CE1 and CE2 form cluster 3. In addition, the scat-ter plot of clusscat-ters showed considerable overlap between cluster 3 and clusters 1 and 2 (Fig. 3). Most NE1 samples were separated from all other sites in one cluster (cluster 4) with an admixture of samples from NE2 and no over-lap with all other clusters.
Pairwise FST values between sites ranged from 0.002 to
0.084 (Table 2), which indicates relatively limited genetic differentiation patterns between all samples sites. How-ever, NE1 appears more differentiated than the other populations as (1) the largest FST values (from 0.03 to
0.08) were all obtained by comparing NE1 with the other populations; and (2) despite the fact that NE1 is located inside NE2, the FST value between NE1 and NE2 was
higher than between NE2 and NE3. Similar results were obtained using DEST estimator (Table 2). The largest
dif-ferentiation was between NE1 and SE1, SW1, NW1, while the lowest was between CE1 and NE2, as well as between CE1 and NE3. The arrangement of branches of the Neighbour-joining tree (Fig. 4), reflecting past divergence events, indicated that SW1, SE1, NW1 and
Fig. 3 Discriminant analysis of principal components of stone marten from Poland grouped into 4 clusters on the first two axes of DAPC. The main
graph plots show the first two discriminant axes (explaining 48.4 and 27.5% of the variation, respectively). Clusters are shown by different colours and shapes, while points represent individuals
CE2 were the most genetically similar sites, creating one group, whereas sites from NE Poland constituted a sepa-rate group. NE1 is the most genetically distant site from all the others and is most genetically similar to NE2.
The genetic distance was not related to geographic dis-tance for all pairwise comparisons (R2 = 0.163, p = 0.059,
slope = 0.015), but when NE1 was removed from the analyses the IBD relationship significantly explained a significant proportion of the variation (R2 = 0.585,
p < 0.001, slope = 0.019). The slope of regression of genetic and geographic distances from NE1 to other sites was similar to slope between distance matrices exclud-ing NE1 (R2 = 0.958, p < 0.001, slope = 0.024). The mean
differentiation between NE1 and the other sites was on average 20.2% higher than the regression line of genetic vs geographic distances of martens populations between the other sites (i.e. similar slope but much larger inter-cept, Fig. 5). The genetic uniqueness index increased with
proportion of forests in the 20 km-buffer around each site (Spearman rank correlation, rS = 0.78, p = 0.028;
Additional file 1: Figure S4) and was highest for site NE1 (Table 2).
Recent migration and past demographic processes
Results of BIMR analysis of the migration rate showed no migration between most sites. Asymmetric gene flow into the NE2 population from the rest of the populations
Table 2 Pairwise FST (below diagonal) and Jost’s DEST (above diagonal) between samples taken from eight sites in Poland
Statistical significance for pairwise FST is given using the adjusted nominal level for multiple comparisons (after Bonferroni correction). Statistically significant values of
FST are marked in italics
GUI genetic uniqueness index of each site
NE1 NE2 NE3 CE1 CE2 SE1 SW1 NW1
NE1 – 0.029 0.052 0.051 0.065 0.094 0.084 0.087 NE2 0.0281*** – 0.013 0.002 0.022 0.051 0.058 0.046 NE3 0.0504*** 0.0112** – 0.007 0.024 0.032 0.054 0.034 CE1 0.0493*** 0.0016* 0.0055 – 0.005 0.024 0.036 0.022 CE2 0.0624*** 0.0192*** 0.0204 0.0032 – 0.030 0.041 0.021 SE1 0.0835*** 0.0416*** 0.0248** 0.0176 0.0225* – 0.022 0.063 SW1 0.0762*** 0.048*** 0.0424*** 0.0279*** 0.033** 0.0169* – 0.036 NW1 0.0843*** 0.0398*** 0.0292** 0.0186** 0.0167 0.0467** 0.029* – GUI 0.062 0.027 0.026 0.018 0.025 0.036 0.039 0.038
Fig. 4 Neighbour-joining tree based on FST values illustrating rela-tionships between populations of stone marten from Poland
Fig. 5 Relationship between stone marten genetic and geographic
distance between all sites except NE1 (filled circles) and between NE1 site with 7 other sites (open circles). The regression equation for all sites without NE1 is GenD = 0.019390*GeoD − 0.084829 and for site NE1 vs other 7 sites is GenD = 0.024286*GeoD − 0.063133
over the last generation was detected, with no migration from NE2 to the other sites (Additional file 1: Table S3). Migration between NE1 and NE2 sites appears restricted and asymmetrical: there was some migration from NE1 to NE2 but no migration from NE2 to NE1, despite the fact that both sites are close to each other. We found no evidence of immigration or emigration between any other pairs of sites (Additional file 1: Table S3).
Past demographic changes were first analyzed using BOTTLENECK and revealed no significant reduction in population sizes under a SMM, while under a TPM:0.22 a marginally significant heterozygosity excess, indicating past contraction, was detected in site SW1 (Additional file 1: Table S4). None of the eight sites showed evidence of a heterozygosity deficiency indicating expansion. The mode shift test revealed a normal L-shaped distribu-tion indicating the lack of recent loss of rare alleles that is often found in populations that have undergone recent severe bottleneck, with the exception of NE3 and CE1 (Additional file 1: Table S4).
In contrast to BOTTLENECK, the analyses of past demographic history with the GSM assumption and OnePopVarSize demographic model using MIGRAINE indicated significant contractions in sites NE1, NE2 and pooled CE1 + CE2 and a nearly significant contraction in site NE3 (Additional file 1: Table S5). Populations from south-west Poland remained stable and reach the highest numbers of individuals, which gradually decrease towards the north-east. Inferred population size for NE1 was 160 individuals; however, there is not enough information on the strength and timing of past processes, and the bounds of the confidence intervals may be more informative (Additional file 1: Table S5). To get more detailed infor-mation on past demographic changes we carried out an analysis under the OnePopFounderFlush model for sites NE1, NE2 + NE3 and CE1 + CE2, which indicated a significant founder event for NE1 (Fig. 6a; Additional file 1: Table S6) followed by a non-significant expansion (Fig. 6b; Additional file 1: Table S6, Figure S5). Results for the pooled sites of north-eastern Poland (NE2 + NE3) showed a significant founder event (Fig. 6a) followed by a significant expansion (Fig. 6b), whereas populations from central Poland (CE1 + CE2) demonstrated signs of a stable population. The scaled time, in generations, of the founder events in the populations in which we found them, showed a very recent founder event in NE1 (17 gen-erations ago; CI 4–336) and a relatively recent founder event in NE2 + NE3 (45 generations ago; CI 18–142).
Discussion
In this study we demonstrate the influence of processes acting within a range and shaping species’ range bound-aries on population genetic structure and diversity.
Moderate genetic diversity and low genetic structure of stone marten at the landscape scale were related to recent expansion to north-eastern Poland and a general lack of environmental barriers limiting dispersal of this species. The genetic structure was mainly related to iso-lation by distance, with a gradual cline in genetic differ-entiation over increasing geographic distance. However, the data also showed strong evidence for the isolation of one sampled population vs the others, probably due to an environmental barrier—a large forest complex. Isola-tion, restriction of migration and genetic drift were the primary factors that resulted in reduced genetic diversity in this population.
Isolation by barrier
Our results showed that a large forest complex may be a major impediment to dispersal and gene flow between stone marten populations. This was confirmed by various analyses comparing a site surrounded by a large forest complex (NE1) with other sites, including a neighbor-ing site 20 km away. First, pairwise comparisons between NE1 and other sites gave the highest FST values, which
were significantly greater than zero. Second, the analy-ses of the Neighbor-joining tree showed that NE1 is the most distantly related to the other sites on the tree. The IBD analysis showed that the genetic distance from NE1 to other sites is 20% higher than between other sites separated by similar geographic distances. Furthermore, Bayesian clustering implemented in STRUCTURE and DAPC, with no a priori information on an individual’s origin, grouped most samples from NE1 into one cluster with a high probability of assignment and with a small admixture with individuals from site NE2. These results are similar to results obtained from isolated populations on islands that are strongly genetically differentiated and form clearly separate clusters [68–71].
The distinct genetic structure of NE1, an isolated pop-ulation inside a large forest complex, has probably been maintained by low gene flow from neighboring sites. In general, isolated populations with low gene flow are prone to losing alleles, reducing genetic diversity and viability as a result of genetic drift [71–74]. Due to asym-metric migration (BIMR analysis) and rare gene flow into NE1, we may expect higher effect of genetic drift, lead-ing to a reduction in genetic diversity. The genetic diver-sity of stone marten from NE1 was the lowest among all study sites and lower than in neighboring sites 20 km away. Stone martens inhabiting NE1 exhibited signatures of genetic drift, having lower levels of allelic richness as well as lower expected and observed heterozygosities than populations inhabiting other sites. The low expected (HE = 0.47) and observed heterozygosity (HO = 0.47) of
mammals, e.g. the edible dormouse Glis glis (HE < 0.42),
Ethiopian wolf Canis simensis (HE = 0.38–0.54) and
fisher Pekania pennanti (HE = 0.47–0.56) [74–77].
Despite a great reduction in Ar and uHE, there was no
evidence of bottlenecks (analysis using BOTTLENECK). However, analyses with MIGRAINE showed significant founder and expansion events in site NE1, suggesting that stone marten recently colonized this area and that the low local genetic diversity at this site may be related to the founder event.
The large genetic differentiation in and low migration rate into NE1 confirmed that this stone marten popu-lation is separated from the other sites by a large forest complex, creating an isolated population. The avoidance of this large forest complex by stone marten in contrast to pine marten (Martes martes) has been confirmed by habitat selection analyses of radio-tracked martens [27].
Stone marten possibly avoid large forests to reduce ther-mal stress in winter, avoid predators and due to their food preferences [27]. The stone marten originally evolved in Central Asia and is probably adapted to a subtropical cli-mate; thus it selects the most insulated resting sites avail-able, preferring human buildings rather than tree cavities in forest. In addition, its less arboreal lifestyle compared to pine marten exposes it to an increase risk of preda-tion in forests, when moving or resting on or under the ground [22]. Furthermore, villages, in contrast to forests, offer a high abundance of food throughout the year [78]. The genetic analyses in this study show, for the first time, that a large forest complex is not only a habitat that is avoided by stone marten but also constitutes an environ-mental barrier in the dispersal of this species.
Comparison of the genetic diversity and genetic struc-ture of stone marten from all other sites (except site NE1)
Fig. 6 Pairwise likelihood-ratio profiles obtained with MIGRAINE under the OnePopFounderFlush model for central sites (pooled CE1 and CE2),
north-eastern sites (pooled NE2 and NE3) and site NE1 from Poland for some pairs of the following parameters: 2 Nancµ: ancestral effective
population size; 2Nfounderµ: founder population size; 2Nµ: current effective population size. Very recent founder events (panel a) were detected
for NE2 + NE3 and NE1 and significant expansion (panel b) for NE2 + NE3, contrasting with a stable population for sites CE1 + CE2. All axes are represented using a log scale. Point estimate values for each parameter and the associated 95% confidence interval are shown in Additional file 1: Table S6
suggested an absence of barriers and high dispersal rates between sites, causing low genetic structuring across large parts of Poland. However, genetic uniqueness of martens inhabiting sites increased with the increase proportion of forest cover around the sites. This analysis confirmed that forests may restrict gene flow between sites but that prob-ably only large forest complexes reduce it to a level that affects genetic structure. A lack of distinct genetic struc-ture and small divergence between all sites except NE1 was indicated by FST pairwise comparisons between sites
and significant isolation by distance patterns. The genetic structure of stone marten in Poland revealed two to four clusters with high levels of admixture among sites and low probability of assignment (except site NE1). This was confirmed by clustering methods implemented in STRUC-TURE, TESS and DAPC. Greater structures in stone mar-ten populations, with higher probabilities of assignment to groups have been observed elsewhere in Europe (France, Portugal and Spain); however the geographic areas con-sidered in these studies were slightly larger than in our study [78–81]. A weak genetic structure for the stone mar-ten population in Poland seems to confirm the absence of ecological barrier-restricted dispersal. In central Europe, stone marten mostly inhabit villages and towns but also small patches of forest, especially in fragmented agricul-tural landscapes [22, 27]. In addition, they prefer shrub, ecotone areas and brushwood during movement and dis-persal [22], which are widely available in human-modified landscapes. In central and western Poland, the distribution and density of these habitat patches probably provides suf-ficient connectivity for undisturbed marten migration. A low migration rate between sites in southern and eastern Poland (BIMR analysis), which lack genetic structure, sug-gests a “stepping-stone” migration model where study sites are too distant from each other for identification of direct recent migrants.
Expansion in Poland
The lack of evident genetic structure and large similar-ity between stone marten inhabiting distantly-located sites in Poland may also reflect demographic processes, notably the history of colonisation of Poland by this spe-cies. The signal of expansion detected by MIGRAINE indicates a recent demographic expansion of stone mar-ten in NE Poland. The arrangement of Neighbor-joining tree branches indicated the directions of population expansions: the populations from SW Poland gave rise to the populations of central Poland and individuals from these populations then expanded into the north-eastern regions. Also, the DAPC genetic structure results sug-gested the direction of differentiation of populations, where group 1—consisting of the south-west sites—origi-nated group 3 (central and north-east sites), which in turn
initiated the existence of the most north-eastern group 2 and isolated group 4. The direction of migration, indi-cated by BIMR analysis, from all sites to NE2 may also reflect the direction of current expansion. Furthermore, genetic diversity usually decreased along the expansion axis [2, 82]. In Poland Ar and uHE decreased from
south-west to north-east Poland; the highest genetic diversity was recorded in SE1 site and Ar or uHE decreased to the
north, both north-west or north-east. The gradual loss of genetic variability is typical during colonization of new territories because of population bottlenecks and founder effects [2, 82].
The past demographic inferences obtained with MIGRAINE analyses suggested stone marten colonized NE Poland relatively recently (17–45 generations), which is confirmed by observations of stone marten presence in this region. Assuming a generation time of 2 years we can estimate the time of colonization to be around 34–90 years ago but this estimation should be treated with caution as it may be slightly biased by non-synchro-nous sampling. The proportion of stone to pine martens collected from hunters and road-killed animals in the zoological collection of the Mammal Research Institute, Polish Academy of Sciences has increased, over succes-sive decades, since the 1980s (Fig. 7). In NE Poland, no stone marten were collected during the 1960s and 1970s; the first stone marten were collected in the ‘80s and its proportion relative to the number of pine marten col-lected gradually increased over subsequent decades (Fig. 7). Furthermore, in NE Poland only three observa-tions of stone marten were recorded between 1960 and 1974 in the “Atlas of Polish mammals” [83]. During this period the authors did not find any evidence of stone marten presence in church lofts (excrement, eggshells or other prey eaten by stone marten), while success-fully having found it in other parts of Poland, where they identified 54 such cases [83]. All of these observations support our findings of likely recent expansion of stone marten in NE Poland or repopulation after a significant decline, which took place before the 1960s. In contrast to central and eastern Poland, which has higher numbers of villages, cities and small fragments of forest, NE Poland still has large forest complexes and the number of villages is lower. A lack of anthropogenic habitat probably slowed down the expansion of stone marten in NE Poland. We suggest however, that climate warming may also be a fac-tor that is now accelerating the expansion. The hypothe-sis that climate severity caused the stone marten to avoid large forest complexes at the north-east boundary of its range [27] suggests that climate warming over the last two decades [84] may have allowed the stone marten to disperse across smaller forest patches and accelerate its invasion of new areas at the edge of its range.
The stone marten probably colonized Europe post-8000 YBP, which was associated with the spread of Neolithic societies [85, 86]. In the late Mesolithic and early Neo-lithic, the stone marten was recorded in central Europe, particularly in France and Italy. From France, it arrived in the south of the Iberian Peninsula about 7000 YBP; about 3000–5000 YBP stone marten reached the north of the Iberian Peninsula [23]. The stone marten has been colo-nizing north-eastern Europe since the thirteenth century, since the development of a denser network of human set-tlements and larger forest fragmentation. Earlier coloni-zation of this region was probably restricted due to a lack of human settlements [23, 81]. The comparison of genetic variability of stone marten in Poland to southern Europe confirmed this colonization history. Assuming that the stone marten first colonized from south-eastern to south-western Europe and then from south to north, we may expect a gradually increase of number of alleles per locus between these sites. Indeed, comparisons of genetic diversity between our and other studies confirm this: the differences in measures of genetic diversity (mean allele number and HE) for the same loci (as used in this
study) were higher when considering populations from
southern Europe (Bulgaria) than when considering pop-ulations from south-western Europe (France, Spain and Portugal; Table 3) [80, 81, 87]. The colonization of new areas by the stone marten is still ongoing and its range has increased in northern and eastern Europe over the last two decades [25]. Marten expansion is also ongoing in eastern Europe and Asia; since the 1980s stone mar-ten have colonized areas east of the Volga River [30]. This ongoing expansion may be interpreted as a demographic response to habitat changes and global climate warming and are consistent with our observation of stone marten expansion in NE Poland.
Conclusions
Our results showed that two processes, namely changes in species distribution boundaries and limited disper-sal associated with landscape barriers within the species range, probably affect genetic diversity and structure in stone marten in Poland. In landscapes less modified by humans, with large forest complexes, dispersal is lim-ited, and structure between stone marten populations increases. Analysis of local barriers that reduced dispersal and large scale analyses of genetic structure and diversity highlight the importance of anthropogenic landscapes for the past colonization of central Europe by stone marten. This confirmed the hypothesis that human-landscape changes accelerated stone marten expansion, to which climate warming has also probably been contributing over the last few decades. The ongoing colonization pro-cess in north-eastern Europe and Asia may be explained by these two changes in biotic and abiotic conditions.
Abbreviations
NE: north-east region of Poland; CE: central-east region of Poland; SE: south-east region of Poland; SW: south-west region of Poland; NW: north-west region of Poland; A: mean allele number; HO: observed heterozygosity; uHE: unbiased
expected heterozygosity; FIS: inbreeding coefficients; Ar: allelic richness; DAPC:
discriminant analysis of principal components; SMM: stepwise mutation Additional files
Additional file 1. Additional figures and tables. Additional file 2. Row experimental data. Fig. 7 Percentage of collected stone and pine marten from NE1
and NE2 sites in collection of Mammal Research Institute PAS, every 20 years from 1960 to 2010. The numbers above bars indicate sample size
Table 3 Comparison of mean allele number and expected heterozygosity for loci shared between this study and the studies from other part of Europe
Country N shared loci Mean allele number (SE) Expected heterozygosity Sources
Other study This study Other study This study
Bulgaria 3 6.67 (0.33) 3.67 (0.33) 0.709–0.818 0.230–0.607 [87] Spain and Portugal 15 7.4 (0.50) 6.0 (0.52) 0.375–0.854 0.219–0.751 [81] France 6 8.33 (1.04) 7.33 (1.02) 0.406–0.844 0.447–0.751 [80]
model; TPM: two-phase model; GSM: generalized stepwise mutation model; CI: confidence intervals; IBD: isolation by distance; GUI: genetic uniqueness index.
Authors’ contributions
AW and AZ conceived and designed the study. AW and AZ collected data. AW, AZ and RL conducted the statistical analyses and wrote the manuscript. All authors read and approved the final manuscript.
Author details
1 Mammal Research Institute, Polish Academy of Sciences, Białowieża, Poland. 2 CBGP, INRA, CIRAD, IRD, Montpellier SupAgro, University Montpellier,
Mont-pellier, France. 3 Institut de Biologie Computationnelle, University Montpellier,
Montpellier, France. Acknowledgements
The authors are grateful for help in collecting samples for genetic analysis, especially we would like to thank to M. Bartoszewicz, E. Bujko, J. Chilecki, P. Górski, E. Jędrzejewska, R. Kowlaczyk, D. Ławreszuk, T. Tumiel, I. Wierzbowska, A. Zbyryt and stuff of Mammal Research Institute PAS. Part of samples was collected as a result of activities carried out under the project LIFE11 NAT/ PL/428. We are especially grateful for laboratory work to H. Zalewska. We thank C. O’Brien-Moran, J. Power and T. Diserens for comments and English correc-tion to earlier versions of the manuscript. We are grateful to two anonymous reviewers for constructive comments which highly improve the manuscript. Competing interests
The authors declare that they have no competing interests. Availability of data and materials
All data analysed during this study are included in Additional file (Additional file 2: Row experimental data).
Consent for publication Not applicable.
Ethics approval and consent to participate
All capture and handling procedures of the martens were approved by the Ministry of the Environment and the Local Ethics Committee for Animal Experiments at the University of Białystok (no: Dlł-756/16/98; DL.gł-6713-21/35088/11/abr; DL.gł-6713-14/18806/11/abr; 2011/9). The field studies did not involve endangered or threatened species.
Funding
Research was funded by National Science Centre Poland, (grant number UMO 2011/01/NZ/NZ8/04525) to AW. Part of this work was carried out by using the resources of the INRA MIGALE (http://migale.jouy.inra.fr), GENOTOUL (Tou-louse Midi-Pyrénées), CBGP and Montpellier Bioinformatics Biodiversity (MBB) HPC bioinformatic platforms. RL was supported by the Agence Nationale de la Recherche (project GENOSPACE ANR-16-CE02-0008).
Publisher’s Note
Springer Nature remains neutral with regard to jurisdictional claims in pub-lished maps and institutional affiliations.
Received: 2 August 2017 Accepted: 13 December 2017
References
1. Garnier J, Lewis MA. Expansion under climate change: the genetic conse-quences. Bull Math Biol. 2016;78:2165–85.
2. Hewitt GM. Some genetic consequences of ice ages, and their role in divergence and speciation. Biol J Lin Soc. 1996;58:247–76.
3. Le Corre V, Kremer A. Cumulative effects of founding events during colonisation on genetic diversity and differentiation in an island and stepping-stone model. J Evol Biol. 1998;11:495–512.
4. Mairal M, Sanmartín I, Herrero A, Pokorny L, Vargas P, Aldasoro JJ, Alarcón M. Geographic barriers and pleistocene climate change shaped patterns of genetic variation in the Eastern Afromontane biodiversity hotspot. Sci Rep. 2017;7:45749.
5. Mikle N, Graves TA, Kovach R, Kendall KC, Macleod AC. Demographic mechanisms underpinning genetic assimilation of remnant groups of a large carnivore. Proc R Soc Biol Sci. 2016;283:20161467.
6. Sala OE, Chapin FS, Armesto JJ, Berlow E, Bloomfield J, Dirzo R, Huber-Sanwald E, Huenneke LF, Jackson RB, Kinzig A, et al. Biodiversity—global biodiversity scenarios for the year 2100. Science. 2000;287:1770–4. 7. Parmesan C. Climate and species’ range. Nature. 1996;382:765–6. 8. Trouwborst A, Krofel M, Linnell JDC. Legal implications of range
expan-sions in a terrestrial carnivore: the case of the golden jackal (Canis aureus) in Europe. Biodivers Conserv. 2015;24:2593–610.
9. Krehenwinkel H, Tautz D. Northern range expansion of European popula-tions of the wasp spider Argiope bruennichi is associated with global warming correlated genetic admixture and population-specific tempera-ture adaptations. Mol Ecol. 2013;22:2232–48.
10. Excoffier L, Foll M, Petit RJ. Genetic consequences of range expansions. Annu Rev Ecol Evol Syst. 2009;40:481–501.
11. Austerlitz F, Jung-Muller B, Godelle B, Gouyon PH. Evolution of coales-cence times, genetic diversity and structure during colonization. Theor Popul Biol. 1997;51:148–64.
12. Hallatschek O, Nelson DR. Life at the front of an expanding population. Evolution. 2010;64:193–206.
13. Sabuni CA, Van Houtte N, Gryseels S, Maganga SLS, Makundi RH, Leirs H, de Bellocq JG. Genetic structure and diversity of the black and rufous sengi in Tanzanian coastal forests. J Zool. 2016;300:305–13.
14. Akbarirad S, Darvish J, Aliabadian M. Increased species diversity of brush-tailed mice, genus Calomyscus (Calomyscidae, Rodentia), in the Zagros Mountains, western Iran. Mammalia. 2016;80:549–62.
15. Glor RE, Warren D. Testing ecological explanations for biogeographic boundaries. Evolution. 2011;65:673–83.
16. Zalewski A, Piertney SB, Zalewska H, Lambin X. Landscape barriers reduce gene flow in an invasive carnivore: geographical and local genetic struc-ture of American mink in Scotland. Mol Ecol. 2009;18:1601–15. 17. Diffendorfer JE, Gaines MS, Holt RD. Habitat fragmentation and
move-ments of 3 small mammals (Sigmodon, Microtus and Peromyscus). Ecol-ogy. 1995;76:827–39.
18. Mader HJ. Animal habitat isolation by roads and agricultural fields. Biol Conserv. 1984;29:81–96.
19. Hoglund J. Evolutionary conservation genetics. Oxford: Oxford University Press; 2009.
20. Keyghobadi N. The genetic implications of habitat fragmentation for animals. Can J Zool. 2007;85:1049–64.
21. Castella V, Ruedi M, Excoffier L, Ibanez C, Arlettaz R, Hausser J. Is the gibraltar strait a barrier to gene flow for the bat Myotis myotis (Chiroptera: Vespertilionidae)? Mol Ecol. 2000;9:1761–72.
22. Goszczyński J, Posłuszny M, Pilot M, Gralak B. Patterns of winter locomo-tion and foraging in two sympatric marten species: Martes martes and
Martes foina. Can J Zool. 2007;85:239–49.
23. Sommer R, Benecke N. Late- and post-glacial history of the Mustelidae in Europe. Mamm Rev. 2004;34:249–84.
24. Cheptou PO, Hargreaves AL, Bonte D, Jacquemyn H. Adaptation to frag-mentation: evolutionary dynamics driven by human influences. Philos Trans R Soc Biol Sci. 2017;372:20160037.
25. Proulx G, Aubry K, Birks J, Buskirk S, Fortin C, Frost H, Krohn W, Mayo L, Monakhov V, Payer D, et al. World distribution and status of the genus
Martes in 2000. In: Harrison DJ, Fuller AK, Proulx G, editors. Martens and
fishers (Martes) in human-altered environments: an international perspec-tive. New York: Springer; 2004. p. 21–76.
26. Genovesi P, Secchi M, Boitani L. Diet of stone martens: an example of ecological flexibility. J Zool. 1996;238:545–55.
27. Wereszczuk A, Zalewski A. Spatial niche segregation of sympatric stone marten and pine marten—avoidance of competition or selection of optimal habitat? PLoS ONE. 2015;10:e0139852.
28. Virgos E, Zalewski A, Rosalino LM, Mergey M. Habitat ecology of martens species in Europe. A review of the evidence. In: Aubry KB, Zielinski WJ, Raphael MG, Proulx G, Buskirk SW, editors. Biology and conservation of
martens, sables and fishers: a new synthesis. Ithaca and London: Cornell University Press; 2012. p. 255–66.
29. Herr J. Ecology and behaviour of urban stone martens (Martes foina) in Luxembourg. Ph.D. thesis. University of Sussex; 2008.
30. Bakeyev YN. Stone martens in the commonwealth of independent states. In: Buskirk SW, Harestad AS, Raphael MG, Powell RA, editors. Martens, sables and fishers biology and conservation. Ithaca and London: Cornell University Press; 1994. p. 243–5.
31. Oconnell M, Wright JM, Farid A. Development of PCR primers for nine polymorphic American mink Mustela vison microsatellite loci. Mol Ecol. 1996;5:311–2.
32. Fleming MA, Ostrander EA, Cook JA. Microsatellite markers for American mink (Mustela vison) and ermine (Mustela erminea). Mol Ecol. 1999;8:1352–4.
33. Basto MP, Rodrigues M, Santos-Reis M, Bruford MW, Fernandes CA. Isola-tion and characterizaIsola-tion of 13 tetranucleotide microsatellite loci in the stone marten (Martes foina). Conserv Genet Resour. 2010;2:317–9. 34. Davis CS, Strobeck C. Isolation, variability, and cross-species
amplifica-tion of polymorphic microsatellite loci in the family Mustelidae. Mol Ecol. 1998;7:1776–8.
35. Walker CW, Vila C, Landa A, Linden M, Ellegren H. Genetic variation and population structure in Scandinavian wolverine (Gulo gulo) populations. Mol Ecol. 2001;10:53–63.
36. Cabria MT, Gonzalez EG, Gomez-Moliner BJ, Zardoya R. Microsatellite markers for the endangered European mink (Mustela lutreola) and closely related mustelids. Mol Ecol Notes. 2007;7:1185–8.
37. Dallas JF, Piertney SB. Microsatellite primers for the Eurasian otter. Mol Ecol. 1998;7:1248–51.
38. Natali C, Banchi E, Ciofi C, Manzo E, Bartolommei P, Cozzolino R. Char-acterization of 13 polymorphic microsatellite loci in the European pine marten Martes martes. Conserv Genet Resour. 2010;2:397–9.
39. Bijlsma R, Van de Vliet M, Pertoldi C, Van Apeldoorn RC, Van de Zande L. Microsatellite primers from the Eurasian badger, Meles meles. Mol Ecol. 2000;9:2216–7.
40. Jordan MJ, Higley M, Matthews SM, Rhodes OE, Schwartz MK, Barrett RH, Palsboll PJ. Development of 22 new microsatellite loci for fishers (Martes
pennanti) with variability results from across their range. Mol Ecol Notes.
2007;7:797–801.
41. Rousset F. GENEPOP ‘ 007: a complete re-implementation of the GENEPOP software for Windows and Linux. Mol Ecol Resour. 2008;8:103–6.
42. van Oosterhout C, Weetman D, Hutchinson WF. Estimation and adjust-ment of microsatellite null alleles in nonequilibrium populations. Mol Ecol Notes. 2006;6:255–6.
43. Queller DC, Goodnight KF. Estimating relatedness using genetic markers. Evolution. 1989;43:258–75.
44. Peakall R, Smouse PE. GenAlEx 6.5: genetic analysis in Excel. Population genetic software for teaching and research-an update. Bioinformatics. 2012;28:2537–9.
45. Goudet J. FSTAT, a program to estimate and test gene diversities fixation indices (version 2.9.3). J Hered. 2001;86:485–6.
46. Zar J. Biostatistical analysis. Englewood Cliffs: Prentice Hall; 1996. 47. Pritchard JK, Stephens M, Donnelly P. Inference of population structure
using multilocus genotype data. Genetics. 2000;155:945–59. 48. Chen C, Durand E, Forbes F, Francois O. Bayesian clustering algorithms
ascertaining spatial population structure: a new computer program and a comparison study. Mol Ecol Notes. 2007;7:747–56.
49. Durand E, Jay F, Gaggiotti OE, François O. Spatial inference of admixture proportions and secondary contact zones. Mol Biol Evol. 2009;26:1963–73.
50. Jombart T, Devillard S, Balloux F. Discriminant analysis of principal components: a new method for the analysis of genetically structured populations. BMC Genet. 2010;11:94.
51. Evanno G, Regnaut S, Goudet J. Detecting the number of clusters of individuals using the software STRUCTURE: a simulation study. Mol Ecol. 2005;14:2611–20.
52. Jombart T. adegenet: a R package for the multivariate analysis of genetic markers. Bioinformatics. 2008;24:1403–5.
53. Wright S. The genetical structure of populations. Ann Eugen. 1951;15:323–54.
54. Jost L. GST and its relatives do not measure differentiation. Mol Ecol.
2008;17:4015–26.
55. Tamura K, Stecher G, Peterson D, Filipski A, Kumar S. MEGA6: molecular evolutionary genetics analysis version 6.0. Mol Biol Evol. 2013;30:2725–9. 56. Coleman RA, Weeks AR, Hoffmann AA. Balancing genetic uniqueness and
genetic variation in determining conservation and translocation strate-gies: a comprehensive case study of threatened dwarf galaxias, Galaxiella
pusilla (Mack) (Pisces: Galaxiidae). Mol Ecol. 2013;22:1820–35.
57. Mantel N. Ranking procedures for arbitrarily restricted observation. Biom-etrics. 1967;23:65–78.
58. Jensen JL, Bohonak AJ, Kelley ST. Isolation by distance, web service. BMC Genet. 2005;6:13.
59. Faubet P, Gaggiotti OE. A new Bayesian method to identify the environmental factors that influence recent migration. Genetics. 2008;178:1491–504.
60. Piry S, Luikart G, Cornuet JM. BOTTLENECK: a computer program for detecting recent reductions in the effective population size using allele frequency data. J Hered. 1999;90:502–3.
61. Peery MZ, Kirby R, Reid BN, Stoelting R, Doucet-Beer E, Robinson S, Vasquez-Carrillo C, Pauli JN, Palsboll PJ. Reliability of genetic bottleneck tests for detecting recent population declines. Mol Ecol. 2012;21:3403–18. 62. Luikart G, Cornuet JM. Empirical evaluation of a test for identifying
recently bottlenecked populations from allele frequency data. Conserv Biol. 1998;12:228–37.
63. Leblois R, Pudlo P, Neron J, Bertaux F, Beeravolu CR, Vitalis R, Rousset F. Maximum-likelihood inference of population size contractions from microsatellite data. Mol Biol Evol. 2014;31:2805–23.
64. Rousset F, Beeravolu RC, Leblois R. Likelihood analysis of population genetic data under coalescent models: computational and inferential aspects. bioRxiv. 2017;85:702.
65. De Iorio M, Griffiths RC. Importance sampling on coalescent histories. Adv Appl Probab. 2004;36:417–33.
66. De Iorio M, Griffiths RC. Importance sampling on coalescent histories. II: subdivided population models. Adv Appl Probab. 2004;36:434–54. 67. De Iorio M, Griffiths RC, Leblois R, Rousset F. Stepwise mutation likelihood
computation by sequential importance sampling in subdivided population models. Theor Popul Biol. 2005;68:41–53.
68. Estoup A, Angers B. Microsatellites and minisatellites for molecular ecology: theoretical and empirical considerations. Adv Mol Ecol. 1998;306:55–86.
69. Ginja C, Gama LT, Martinez A, Sevane N, Martin-Burriel I, Lanari MR, Revi-datti MA, Aranguren-Mendez JA, Bedotti DO, Ribeiro MN, et al. Genetic diversity and patterns of population structure in Creole goats from the Americas. Anim Genet. 2017;48:315–29.
70. Velando A, Moran P, Romero R, Fernandez J, Piorno V. Invasion and eradi-cation of the American mink in the Atlantic Islands National Park (NW Spain): a retrospective analysis. Biol Invasions. 2017;19:1227–41. 71. Forsdick NJ, Cubrinovska I, Massaro M, Hale ML. Genetic diversity and
population differentiation within and between island populations of two sympatric Petroica robins, the Chatham Island black robin and tomtit. Conserv Genet. 2017;18:275–85.
72. Lacy RC. Loss of genetic diversity from managed populations: interacting effect of drift, mutation, immigration, selection, and populaton subdivi-sion. Conserv Biol. 1987;1:143–58.
73. La Haye MJJ, Neumann K, Koelewijn HP. Strong decline of gene diversity in local populations of the highly endangered common hamster (Cricetus
cricetus) in the western part of its European range. Conserv Genet.
2012;13:311–22.
74. Allendorf FW, Luikart G. Conservation and the genetics of populations. Malden: Blackwell Publishing; 2009.
75. Fietz J, Tomiuk J, Loeschcke V, Weis-Dootz T, Segelbacher G. Genetic consequences of forest fragmentation for a highly specialized arboreal mammal—the edible dormouse. PLoS ONE. 2014;9:e88092.
76. Gottelli D, Sillero-Zubiri C, Marino J, Funk SM, Wang J. Genetic structure and patterns of gene flow among populations of the endangered Ethio-pian wolf. Anim Conserv. 2013;16:234–47.
77. Tucker JM, Schwartz MK, Truex RL, Wisely SM, Allendorf FW. Sampling affects the detection of genetic subdivision and conservation implica-tions for fisher in the Sierra Nevada. Conserv Genet. 2014;15:123–36.
• We accept pre-submission inquiries
• Our selector tool helps you to find the most relevant journal • We provide round the clock customer support
• Convenient online submission • Thorough peer review
• Inclusion in PubMed and all major indexing services • Maximum visibility for your research
Submit your manuscript at www.biomedcentral.com/submit
Submit your next manuscript to BioMed Central
and we will help you at every step:
78. Czernik M, Kowalczyk R, Zalewski A. Spatio-temporal variation of predator diet in a rural habitat: stone martens in the villages of Białowieża forest. Mamm Res. 2016;61:187–96.
79. Basto MP, Santos-Reis M, Simoes L, Grilo C, Cardoso L, Cortes H, Bruford MW, Fernandes C. Assessing genetic structure in common but eco-logically distinct carnivores: the stone marten and red fox. PLoS ONE. 2016;11:e0145165.
80. Larroque J, Ruette S, Vandel JM, Queney G, Devillard S. Age and sex-dependent effects of landscape cover and trapping on the spatial genetic structure of the stone marten (Martes foina). Conserv Genet. 2016;17:1293–306.
81. Vergara M, Basto MP, Madeira MJ, Gómez-Moliner BJ, Santos-Reis M, Fernandes C, Ruiz-González A. Inferring population genetic structure in widely and continuously distributed carnivores: the stone marten (Martes
foina) as a case study. PLoS ONE. 2015;10:e0134257.
82. Dlugosch KM, Parker IM. Founding events in species invasions: genetic variation, adaptive evolution, and the role of multiple introductions. Mol Ecol. 2008;17:431–49.
83. Pucek Z, Raczyński J. Atlas of Polish mammals. Warszawa: Polish Scientific Publishers; 1983.
84. Jędrzejewska B, Jędrzejewski W. Predation in vertebrate communities: the Białowieża Primeval Forest as a case study. Berlin: Springer-Verlag; 1998. 85. Masseti M. Presence and distribution of the stone marten, Martes foina
Erxleben, 1777, on the island of Crete (Greece). Hystrix. 1995;7:73–8. 86. Llorente-Rodriguez L, Nores-Quesada C, Lopez-Saez JA, Morales-Muniz
A. Hidden signatures of the Mesolithic–Neolithic transition in Iberia: the pine marten (Martes martes Linnaeus, 1758) and beech marten (Martes
foina Erxleben, 1777) from Cova Fosca (Spain). Quat Int. 2016;403:174–86.
87. Nagai T, Raichev EG, Tsunoda H, Kaneko Y, Masuda R. Preliminary study on microsatellite and mitochondrial DNA variation of the stone marten