HAL Id: insu-01871539
https://hal-insu.archives-ouvertes.fr/insu-01871539
Submitted on 19 Sep 2018
HAL is a multi-disciplinary open access archive for the deposit and dissemination of sci-entific research documents, whether they are pub-lished or not. The documents may come from teaching and research institutions in France or abroad, or from public or private research centers.
L’archive ouverte pluridisciplinaire HAL, est destinée au dépôt et à la diffusion de documents scientifiques de niveau recherche, publiés ou non, émanant des établissements d’enseignement et de recherche français ou étrangers, des laboratoires publics ou privés.
An assessment of retention behavior for gold nanorods
in asymmetrical flow field-flow fractionation
Hind El Hadri, Julien Gigault, Jiaojie Tan, Vincent Hackley
To cite this version:
Hind El Hadri, Julien Gigault, Jiaojie Tan, Vincent Hackley. An assessment of retention behavior for gold nanorods in asymmetrical flow field-flow fractionation. Analytical and Bioanalytical Chemistry, Springer Verlag, 2018, 410 (27), pp.6977-6984. �10.1007/s00216-018-1325-y�. �insu-01871539�
An assessment of retention behavior for gold nanorods in
asymmetrical flow field-flow fractionation
Hind El Hadri1*, Julien Gigault2, Jiaojie Tan1 and Vincent A. Hackley1*
1
Materials Measurement Science Division, National Institute of Standards and Technology, 100 Bureau Drive, Gaithersburg, MD 20899
2
French National Center for Scientific Research (CNRS), Laboratoire Géosciences Rennes UMR6118, 263 Avenue Général Leclerc, 35000 Rennes
*
corresponding authors: h.el.hadri@hotmail.fr; vince.hackley@nist.gov
Abstract
Applications of asymmetrical flow field-flow fractionation (AF4) continue to expand rapidly in the fields of nanotechnology and biotechnology. In particular, AF4 has proven valuable for the separation and analysis of particles, biomolecular species (e.g., proteins, bacteria) and polymers (natural and synthetic), ranging in size from a few nanometers to several micrometers. The separation of non-spheroidal structures (e.g., rods, tubes, etc.) with primary dimensions in the nanometer regime, is a particularly challenging application deserving of greater study and consideration. The goal of the present study was to advance current understanding of the mechanism of separation of rod-like nano-objects in the AF4 channel. To achieve this, we have systematically investigated a series of commercially available cetyltrimethylammonium bromide stabilized gold nanorods (AuNRs), with aspect ratios from 1.7 to 10. Results show clearly that the retention time is principally dependent on the translational diffusion coefficient of the AuNRs. Equations used to calculate translational and rotational diffusion coefficients (cylinder and prolate ellipsoid models) yield similarly good fits to experimental data. Well characterized gold nanorods (length and diameter by transmission electron microscopy) can be used as calibrants for AF4 measurements allowing one to determine the aspect ratio of nanorod samples based on their retention times.
Keywords: Aspect ratio, Diffusion coefficient, Field flow fractionation, Gold
Introduction
Gold nanorods (AuNRs) are principally defined by their length, diameter and aspect ratio (AR). Their optical absorption spectra are characterized by a transverse surface plasmon resonance (TSPR) peak related to their diameter, and a SPR band corresponding to the longitudinal resonance (LSPR) associated with their length [1,2]. Applications of AuNRs are, consequently, mainly based on their optical properties due to their ability to strongly absorb and scatter in the near infrared (NIR) region (650 nm to 900 nm). For example, AuNRs can be used as both contrast agents for molecular imaging and in photothermal cancer therapy [3,4].
Separation of NRs based on shape is challenging. Separation of gold nanospheres and NRs from a mixture has been achieved using size exclusion chromatography (SEC), but the resulting resolution was low (i.e. not baseline resolved) [5]. Among separation techniques that have been exploited to characterize nanomaterials, multi-detector asymmetrical flow field-flow fractionation (AF4) has proven highly relevant. Recent publications have highlighted the potential for shape separation of Au core NRs (with variable aspect ratio) using AF4 [6-9]. It has been found that one of the limitations of the AF4 technique derives from the positively charged surfactants (typically cetyltrimethylammonium bromide, CTAB) commonly used to both synthesize AuNRs and to stabilize them in suspension; CTAB leads to irreversible deposition of AuNRs onto the negatively charged accumulation wall membrane. Therefore, AF4 conditions must be modified to compensate or mitigate this effect. Secondly, the range of ARs and number of different samples investigated has been somewhat limited, making it difficult to fully evaluate the performance of AF4 for shape separation and to define the mechanism(s) of separation. For low aspect ratios (< 4), the relevancy of AF4 has been demonstrated for preparation of AuNRs with narrow dispersity [7]. Moreover, it has been shown that the change in AuNR coating (from CTAB to PEG) does not influence the elution mechanism in AF4; nevertheless, the PEG relative molar mass and surface coverage can be differentiated using AF4 [10]. For single-wall carbon nanotubes having a high AR (up to 1000 with 1 nm diameter), a simulation has shown that the particles elute by the normal mode (i.e., based on translational diffusion) [11]; with the length being substantially superior to the diameter, the latter is negligible and the particles are eluted according to their length [11,12]. AF4 has also been coupled to small-angle
X-ray scattering to measure the shape and size distributions of superparamagnetic iron oxide NRs [13].
To extract size information from the elution profile, it is first necessary to apply an appropriate equation or model. So, with respect to the underlying elution mechanisms for asymmetrical shaped nanomaterials, the issue remains an open point of discussion. Given the growing importance and commercial availability of AuNRs and other high-AR nanomaterials, a more comprehensive consideration of this issue is both timely and warranted. The objective of the present work is to investigate the AF4-based fractionation of AuNRs using a wide range of commercially available materials, in order to address the potential for AF4 to effectively fractionate high-AR nano-objects and to differentiate according to shape specificity. We examine various dependencies of retention behavior and apply structure based models to derive rotational and translational diffusion coefficients for further comparison. In order to perform this investigation, AuNRs were independently analyzed using transmission electron microscopy (TEM). Based on our previous experience, independent verification of the quality, dimensions and ARs for commercially sourced AuNRs is absolutely essential for correct interpretation of results.
Materials and methods
Materials
CTAB stabilized AuNRs were purchased from Nanopartz1 (NPz) (Loveland, CO, USA) and Nanocomposix (NC) (San Diego, CA, USA). Branched polyethylenimine (bPEI, 25 kDa) coated AuNPs with a nominal size of 30 nm were obtained from Nanocomposix (San Diego, CA, USA). CTAB coated selenium nanoparticles were synthetized as previously described [14] and the size (z-average), determined by dynamic light scattering (Zetasizer Nano ZS, Malvern Panalytical, Westborough, MA, USA), was (49 ± 1) nm. Ammonium nitrate (NH4NO3, 99 %) and
CTAB were purchased from VWR (Bridgeport, NJ, USA) and used for mobile phase preparation. High purity deionized (DI) water was generated by an Aqua Solutions system (Jasper, GA, USA). Prior to use, the AF4 mobile phase was passed through a
1 The identification of any commercial product or trade name does not imply endorsement or
0.2 μm regenerated cellulose filter from VWR. The characteristics of the samples are detailed in Table 1.
AF4 instrumentation and conditions
Separation experiments were performed using a DualTec AF4 system (Wyatt Technology, Santa Barbara, CA, USA). Trapezoidal channel dimensions were 26.5 cm in length and from (2.1 to 0.6) cm in width, with a 250 μm spacer defining depth. A polyethersulfone (PES) membrane with a 10 kDa cut-off (Wyatt Technology) was used to define the accumulation wall. Mobile phase flows were controlled with a 1200 series isocratic pump (Agilent Technologies, Santa Clara, CA, USA) equipped with a degasser (Gastorr TG-14, Flom Co., Ltd., Tokyo, Japan). Samples were injected using an Agilent Technologies 1260 ALS series autosampler. The detection system consisted of a 1200 series UV–Vis absorbance diode array detector (DAD, Agilent Technologies) with a spectral range from (190 to 950) nm, and a fiber optic based multi-angle light scattering (MALS) detector (DAWN HELIOS, Wyatt Technology). It should be noted that the MALS detector simply provides a trace signal for the eluting species; the size cannot be determined due to the surface plasmon resonance. The AF4 conditions used in this study were based on a previous AuNR study [6] that used a spacer of 350 µm, a 10 kDa PES membrane, a mobile phase composition of 0.35 mmol L-1 NH4NO3 and 0.15 mmol L-1 CTAB, a
channel flow V0 = 0.5 mL min-1 and a constant cross flow Vc = 0.8 mL min-1. The
addition of CTAB to the mobile phase mitigates loss of analyte onto the negatively charged PES membrane due to electrostatic attraction. In the current study, the same mobile phase composition, membrane and channel flow rate were used. However, because of the large range of ARs and AuNR dimensions employed in the current study, modifications were made to these previous parameters. Namely, a spacer of 250 µm was used to allow a reasonable analysis time and improve the peak resolution relative to 350 µm (data not shown). To improve fractionation, a higher constant cross flow of 2 mL min-1 was applied in the present study, and a focus flow rate of 2.5 mL min-1 was applied for 6 min prior to the separation. At this higher cross flow, the recovery (ratio between the surface area under the peak signal with and without applying a cross flow) was verified and found to be greater than 70 %.
TEM and UV-vis measurements
TEM was performed using a JEOL-2100 FEG (JEOL USA Inc., Peabody, MA, USA) with an accelerating voltage of 200 kV. Samples were deposited onto formvar stabilized with silicon monoxide grids obtained from Ted Pella (Redding, CA, USA). Lengths and diameters were determined as the mean of at least 100 AuNRs analyzed using ImageJ software (http://imagej.nih.gov/ij/). Images are presented in the Electronic Supplemental Material (ESI, Figure S1). AuNRs dimensions, provided by the vendors, were evaluated by TEM, the gold standard for size/shape analysis of AuNRs. These dimensions were also evaluated by TEM in our laboratory. As differences were observed (Table S1), the dimensions determined in our laboratory were used for calculations due to a higher level of confidence in this data. The uncertainties were determined as one standard deviation about the mean. TEM was chosen over other size characterization techniques (e.g. dynamic light scattering, nanoparticle tracking analysis) primarily because the shape can be visualized and determined unambiguously. The other available methods yield an equivalent spherical size only. Moreover, due the nature of the samples (metallic particles provide good contrast and the risk of salt crystallization is limited), and the CTAB coating (good stabilization of AuNRs), this method was well adapted. However, the presence of aggregates could be underestimated in TEM due to sample preparation artifacts (drying the sample); therefore, the nature of the grid, the concentration of the sample and the drying process should be carefully chosen.
A Lambda 750 UV-Vis-NIR spectrophotometer (Perkin Elmer, Waltham, MA, USA) was used for off-line optical absorbance measurements.
Results and discussion
AuNR characteristics
Table 1 summarizes the measured physical characteristics of the CTAB-stabilized AuNRs used in the present study. The AR ranges from 1.7 to 10.4. The LSPR red-shifts with increasing AR, and is linearly proportional (see Electronic Supplementary Information, ESI, Figure S2) with a coefficient of determination R² of 0.96 as reported in the literature [15].
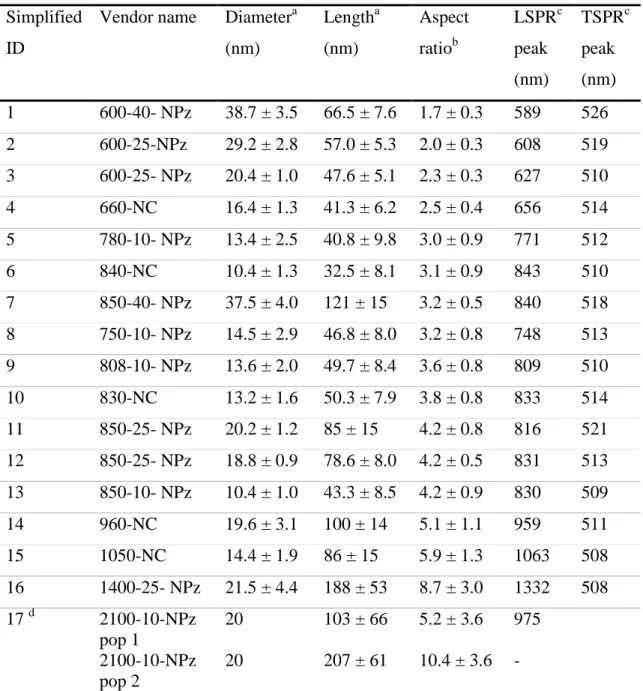
Table 1: Measured AuNR physical and optical characteristics
AuNR ID Simplified
ID
Vendor name Diametera (nm) Lengtha (nm) Aspect ratiob LSPRc peak (nm) TSPRc peak (nm) 1 600-40- NPz 38.7 ± 3.5 66.5 ± 7.6 1.7 ± 0.3 589 526 2 600-25-NPz 29.2 ± 2.8 57.0 ± 5.3 2.0 ± 0.3 608 519 3 600-25- NPz 20.4 ± 1.0 47.6 ± 5.1 2.3 ± 0.3 627 510 4 660-NC 16.4 ± 1.3 41.3 ± 6.2 2.5 ± 0.4 656 514 5 780-10- NPz 13.4 ± 2.5 40.8 ± 9.8 3.0 ± 0.9 771 512 6 840-NC 10.4 ± 1.3 32.5 ± 8.1 3.1 ± 0.9 843 510 7 850-40- NPz 37.5 ± 4.0 121 ± 15 3.2 ± 0.5 840 518 8 750-10- NPz 14.5 ± 2.9 46.8 ± 8.0 3.2 ± 0.8 748 513 9 808-10- NPz 13.6 ± 2.0 49.7 ± 8.4 3.6 ± 0.8 809 510 10 830-NC 13.2 ± 1.6 50.3 ± 7.9 3.8 ± 0.8 833 514 11 850-25- NPz 20.2 ± 1.2 85 ± 15 4.2 ± 0.8 816 521 12 850-25- NPz 18.8 ± 0.9 78.6 ± 8.0 4.2 ± 0.5 831 513 13 850-10- NPz 10.4 ± 1.0 43.3 ± 8.5 4.2 ± 0.9 830 509 14 960-NC 19.6 ± 3.1 100 ± 14 5.1 ± 1.1 959 511 15 1050-NC 14.4 ± 1.9 86 ± 15 5.9 ± 1.3 1063 508 16 1400-25- NPz 21.5 ± 4.4 188 ± 53 8.7 ± 3.0 1332 508 17 d 2100-10-NPz pop 1 20 103 ± 66 5.2 ± 3.6 975 2100-10-NPz pop 2 20 207 ± 61 10.4 ± 3.6 -
a Determined by TEM using the average of at least 100 NRs; for comparison, the vendor’s values are
provided in Table S1; the uncertainty intervals represent one standard deviation (SD) aboutthe mean.
b SD for the quotient L/d (=AR) is calculated as 𝑺𝑫
𝑨𝑹= 𝑨𝑹��𝑺𝑫𝑳𝑳� 𝟐 + �𝑺𝑫𝒅 𝒅 � 𝟐 . c
Measured by UV-Vis spectroscopy, the uncertainty corresponds to the instrument error and precision (≈ 1 %).
d Sample used in a previous study performed by Nguyen et al. (characteristics were previously reported) [8]. Two populations are described here based on the AF4 fractogram (Figure 1) and the data taken
from Ngyuen et al. (see ESI).
Fractionation and mechanism
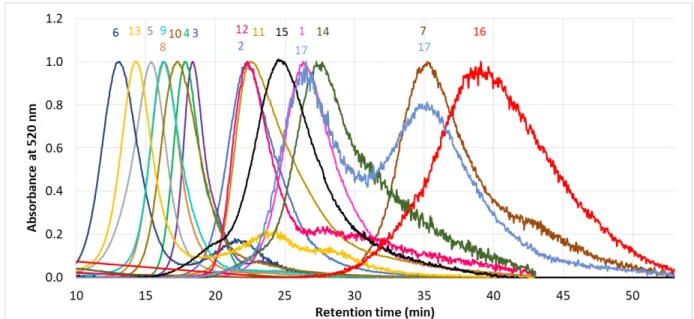
Figure 1 presents AF4 fractograms for all AuNR samples listed in Table 1. During fractionation, the 520 nm absorbance signal was monitored (as it corresponds closely to the TSPR band for all NRs in this study) and was used for normalization of
absorbance data. The observed retention times (tR) ranged from (10 to 50) min under
the conditions of the study.
Figure 1: Fractograms obtained for all AuNRs at V0 = 0.5 mL min-1, Vc = 2 mL min-1, and in a CTAB/ NH4NO3 mobile phase. When a fractogram shows two peaks or a shoulder the retention time of the maximum peak is used for analysis (except for sample 17 where both retention times were considered). Numbers above peaks are simplified IDs (see Table 1). All signals were normalized to 1 in this figure.
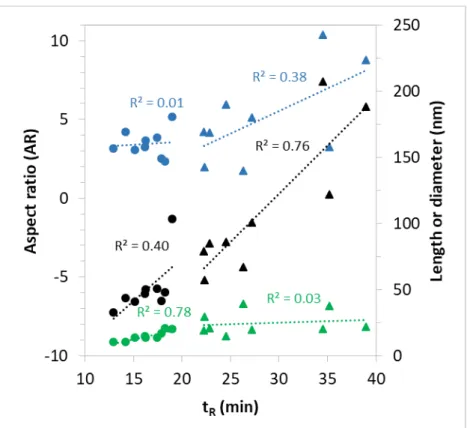
Figure 2 illustrates the variation of the measured lengths and diameters and calculated ARs for the AuNRs with tR. Generally, two distinct retention regimes are apparent
from the data plotted in Figure 2, with a transition occurring near tR = 20 min, where:
(i) The early eluting peaks (i.e., tR ˂ 20 min) correspond to AuNR mean
lengths from about 34 nm to 100 nm. Both length and diameter exhibit a weak but apparently linear positive correlation with tR in this regime.
In contrast, in the same retention range no correlation is observed between AR and retention time (R2 = 0.01).
(ii) The later eluting peaks (i.e., tR ˃ 20 min) correspond to AuNRs with
lengths ranging from about 50 nm to 210 nm. In this regime, only AuNR length is strongly correlated to tR based on linear regression
analysis (see Equations in Table S2 in ESI). Conversely, AR exhibits a weak positive correlation over the same range.
Figure 2: Graph showing the TEM derived AR (blue symbols, top), length (black symbols, middle) and diameter (green symbols, bottom) as a function of retention time, tR,at the peak
maximum. Circles and triangles represent early and later eluting populations (refer to text). Uncertainty for AR is given in Table 1. Uncertainty on tR was determined to be 0.4 min (see ESI).
The coefficient of determination, R2, represents the strength of correlation between the dependent variable and retention time.
While a cursory evaluation of Figure 2 suggests that there is a transition in elution mode near tR = 20 min, it is clear that tR generally increases with AuNR length
over the entire observed range.
According to Beckett and Giddings, for rod-like objects, the translational diffusion coefficient (Dt-AF4) can be determined by AF4 and is related to the retention
ratio (t0/tR) according to the relation: 𝐷𝑡−𝐴𝐹4 =𝑉𝑐𝜔
2 12𝑉0
𝑡0
𝑡𝑅, (1)
where ω is the channel thickness, t0 is the void time and the other parameters are as
previously defined. Deriving and understanding of the elution mechanism is challenging based on this equation alone, without further input. Additionally, two principal diffusion coefficients are associated with NRs: (i) translational (spatial displacement of NR) and (ii) rotational (about the center of mass). The theoretical expression for translational diffusion (Dt) is of the form:
while the corresponding expression for rotational diffusion (Drot) is:
𝐷𝑟𝑜𝑡 =3𝑘πη𝐿𝐵𝑇3𝛼𝑟𝑜𝑡, (3)
where kB is the Boltzmann constant, T is the absolute temperature, η is the viscosity, L
is the rod length, and αt and αrot are model-dependent functions of the AR given by the equations summarized in Table 2. The theory of diffusion for rod-like objects yields different equations and approximations for αt and αrot, and it is not obvious which model is most appropriate for describing NR elution within the AR range investigated in the present study [16-19].
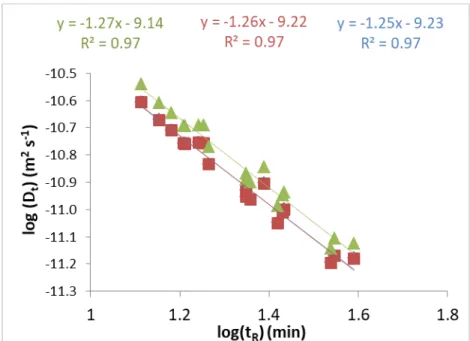
11 Figure 3 shows the variation of Dt (calculated using the three models in Table
2) with the observed tR (maximum of the peak). For the three models, Dt is inversely
correlated to tR, with a slope ranging from -1.25 to -1.27 and corresponding roughly to
the theoretical value of -1. The correlation is similarly strong for the three models (R2 = 0.97). Thus, statistically, the cylinder and prolate ellipsoid models allow one to fit the data equally well. The structures observed by TEM show that the various AuNR samples vary between a solid cylinder and a more ellipsoidal shape (Figure S1 and S3).
To further evaluate these models, Dt (calculated using the equations in Table 2
with measured values for length and diameter of the AuNRs) is plotted against Dt-AF4
(calculated from tR according to Eq. (1)) in Figure 4. The linear regressions confirm
that tR is correlated to the diffusion coefficient of AuNRs, as it was observed and
reported previously for nanospheres [20,21]. The two cylinder models overlap with a slope close to 1.
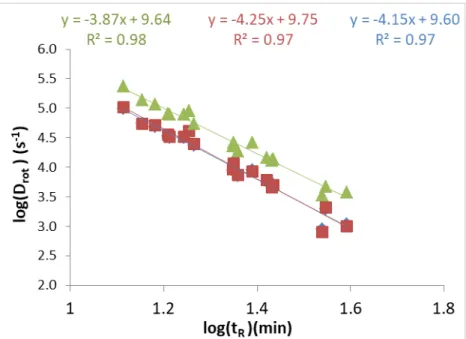
Figure 5 shows the variation of Drot as a function of tR comparing the three
shape models. It is important to note that Drot does not have the same dimensions as Dt; Drot defines the rate at which rods rotate about a center of mass or axis and has
units of Hertz (1/s, equivalent to rad²/s), whereas Dt has units of area per unit time.
The three models appear to be equally well correlated (R2 ≥ 0.97) to tR. This means
that the AuNRs rotate with decreasing frequency as their residence time in the AF4 channel increases. In other words, longer retention correlates with slower rotation of the NRs. The two cylinder models overlap with a slope close to -4.2. The prolate ellipsoid model produces Drot values slightly greater than the cylinder models. It is
important to note that the influence of CTAB on the calculation was also assessed, assuming that CTAB coating adds 4 nm to the diameter and length derived by TEM. The coefficients of determination were similar and the slope in Figures 3 and 5 only decreased by 0.1, which is not statistically significant. The CTAB coating size is close to the uncertainty associated with the measured dimensions of the AuNRs (Table 1).
Given AuNRs with unknown dimensions (L and d), one can determine Dt and Drot from the linear regression fit in Figures 3 and 5. Then, from Equations (2) and
(3), a system of two equations with two unknowns (L and d) can be solved. Therefore, combining empirical and theoretical equations, it is possible to estimate L and d based on the observed retention behavior.
12
Figure 3: Variation of translational diffusion coefficient as a function of tR for the fractionated
AuNRs (see fractograms in Figure 1). Dt is calculated according to the different models described
in Table 2 (green triangles correspond to the prolate ellipsoid model, while red squares (for AR from 0.1 to 20) and blue diamonds (for AR from 2 to 20) correspond to the cylinder model). Note that values for both cylinder models are similar, therefore blue diamonds are not distinguishable from red squares in this figure. A log-log linear regression fit is plotted for each, with fit parameters shown at top.
Figure 4 : Plot of Dt calculated from the different shape models (Table 2) versus Dt calculated
from tR using Eq. (1). Green triangles correspond to the prolate ellipsoid model while red squares
(for AR from 0.1 to 20) and blue diamonds (for AR from 2 to 20) correspond to the cylinder models. Note that values for both cylinder models are similar, therefore blue diamonds are not distinguishable from red squares in this figure. Linear regression fit parameters are shown at the top.
13
Figure 5 : Variation of the rotational diffusion coefficient as a function of tR for the fractionated AuNRs (see fractograms in Figure 1). Drot was evaluated using the three models described in Table 2. Green triangles correspond to the prolate ellipsoid model while red squares (for AR from 0.1 to 20) and blue diamonds (for AR from 2 to 20) correspond to the cylinder models. A log-log plotting was made to obtain a linear regression equation; R2 represents the quality of this fit. Note that values for both cylinder models are similar, therefore blue diamonds are not distinguishable from red squares in this figure. Linear regression fit parameters are shown at the top.
Comparison of NRs and spheres of equivalent hydrodynamic size
Based on the previous results, the cylinder and prolate ellipsoid models are equally appropriate to determine diffusion coefficients (Dt and Drot) for AuNRs.
Nevertheless, both cylinder models, the one developed by Tirado and De la Torre [17,16] and by Ortega and De la Torre [19] for rigid macromolecules (bioparticles) yielded slightly better results compared to the ellipsoid model. The results also indicate that at low AR (≤ 3) the retention time of the particles is dependent on length and diameter (see ESI, Figure S6). To further examine the elution mechanism, the spherical equivalent hydrodynamic diameter was obtained from Dt and compared with
nanosize spheres having the same positive charge and repulsive interactions in the channel (bPEI-AuNPs and CTAB-SeNPs) (Figure 6).
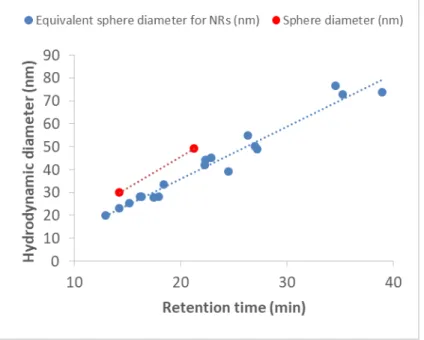
The spherical particles elute faster than their NR counterparts at equivalent hydrodynamic diameters. Put another way, NRs are retained more strongly relative to spheres of the same equivalent size. Phelan et al. (2009) have observed in steric mode that larger rods moved slower than theoretically predicted compared to spheres [22]. A comparison of the slopes for spheres and rods in Figure 6 (albeit based on limited data), suggests that, at increasing tR, dH is increasing to a higher extent relative to
14 spheres. For instance, at tR= 10 min and tR= 30 min, the difference in dH between
spheres and rods is 12 % and 38 %, respectively. It is possible to explain this observation based on the rotational and translational diffusion dependence with tR as
observed. As the length and equivalent spherical size increase, AuNRs rotate with decreasing frequency due to shear forces, become less diffusive (both translationally and rotationally) and, as a result, remain in the channel for a longer time. The decrease in rotational diffusion allows the particles to more closely approach the accumulation wall (based on the steric exclusion boundary condition), and the decrease in translational diffusion reduces their motion away from the wall. Thus, as diffusion becomes less dominant in the elution process, the shape of the particle controls the hydrodynamic elution behavior, which is defined primarily by length in the case of AuNRs with high AR.
Figure 6: Hydrodynamic diameter as a function of tR. The equivalent sphere diameters for the AuNRs were calculated using the Stokes–Einstein equation 𝒅𝑯= 𝒌𝑻 𝟑𝝅𝜼𝑫
𝒕
� with Dt
corresponding to the cylinder model (2< AR <20). The spheres are 30 nm diameter bPEI coated AuNPs and 54 nm CTAB stabilized SeNPs.
Summary and conclusions
In the present study, it has been clearly demonstrated that the retention time of AuNRs is strongly correlated to their coefficient of diffusion (within an AR range from 1.7 to 10) using model equations. Length is correlated to the retention time in the whole range, while diameter is correlated only at low retention times (< 20 min). Comparatively, AR did not exhibit any significant correlation with tR.
15 The analytical challenge presented herein, is to achieve, for the first time, a length and diameter determination for AuNRs over a large range of ARs. By combining experimental data and investigating different shape models, cylinder models within the AR range from 2 to 20 appear most appropriate for the AuNRs examined in the present study. Both models examined here exhibit similar results, the difference would be more pronounced if discs were included (AR < 1). Well characterized AuNRs can potentially be used as calibrants. Based on our model and experimental application, for an unknown AuNR sample, Dt and Drot can be
determined from previously determined calibration curves using well characterized AuNRs. From equations (2) and (3), a system of two equations with two unknowns (L and d) can be solved. Therefore, from empirical and theoretical equations, L and d can be determined or at least estimated. It is then possible to calculate AR based on the Dt
and Drot relationship with tR.
Finally, by calibrating NR length with tR, the sphere equivalent hydrodynamic
diameter can be determined. However, to our knowledge, no theoretical equation exists for determining shape heterogeneity based on tR for rod-like particles.
Conflict of interest
The authors declare that they have no conflict of interest.
References
1. Pérez-Juste J, Pastoriza-Santos I, Liz-Marzán LM, Mulvaney P (2005) Gold nanorods: Synthesis, characterization and applications. Coord Chem Rev 249 (17– 18):1870-1901. doi:http://dx.doi.org/10.1016/j.ccr.2005.01.030
2. Huang X, El-Sayed MA (2010) Gold nanoparticles: Optical properties and implementations in cancer diagnosis and photothermal therapy. J Adv Res 1 (1):13-28. doi:https://doi.org/10.1016/j.jare.2010.02.002
3. Huang X, El-Sayed IH, Qian W, El-Sayed MA (2006) Cancer Cell Imaging and Photothermal Therapy in the Near-Infrared Region by Using Gold Nanorods. J Am Chem Soc 128 (6):2115-2120. doi:10.1021/ja057254a
4. Dickerson EB, Dreaden EC, Huang X, El-Sayed IH, Chu H, Pushpanketh S, McDonald JF, El-Sayed MA (2008) Gold nanorod assisted near-infrared plasmonic photothermal therapy (PPTT) of squamous cell carcinoma in mice. Cancer Lett 269 (1):57-66. doi:10.1016/j.canlet.2008.04.026
5. Wei G-T, Liu F-K, Wang CRC (1999) Shape Separation of Nanometer Gold Particles by Size-Exclusion Chromatography. Anal Chem 71 (11):2085-2091. doi:10.1021/ac990044u
6. Gigault J, Cho TJ, MacCuspie RI, Hackley VA (2013) Gold nanorod separation and characterization by asymmetric-flow field flow fractionation with UV–Vis detection. Anal Bioanal Chem 405 (4):1191-1202. doi:10.1007/s00216-012-6547-9
16 7. Runyon JR, Goering A, Yong K-T, Williams SKR (2012) Preparation of narrow dispersity gold nanorods by asymmetrical flow field-flow fractionation and investigation of surface plasmon resonance. Anal Chem 85 (2):940-948
8. Nguyen T, Liu J, Hackley V (2015) Fractionation and Characterization of High Aspect Ratio Gold Nanorods Using Asymmetric-Flow Field Flow Fractionation and Single Particle Inductively Coupled Plasma Mass Spectrometry. Chromatography 2 (3):422
9. Nguyen TM, Pettibone JM, Gigault J, Hackley VA (2016) In situ monitoring, separation, and characterization of gold nanorod transformation during seed-mediated synthesis. Anal Bioanal Chem 408 (9):2195-2201. doi:10.1007/s00216-016-9366-6 10. Nguyen TM, Gigault J, Hackley VA (2014) PEGylated gold nanorod separation based on aspect ratio: characterization by asymmetric-flow field flow fractionation with UV-Vis detection. Anal Bioanal Chem 406 (6):1651-1659
11. Phelan Jr FR, Bauer BJ (2007) Simulation of nanotube separation in field-flow fractionation (FFF). Chem Eng Sci 62 (17):4620-4635. doi:http://dx.doi.org/10.1016/j.ces.2007.04.019
12. Gigault J, Grassl B, Le Hécho I, Lespes G (2011) Accurate determination of the length of carbon nanotubes using multi-angle light scattering. Microchim Acta 175 (3-4):265-271
13. Thünemann AF, Kegel J, Polte Jr, Emmerling F (2008) Superparamagnetic maghemite nanorods: analysis by coupling field-flow fractionation and small-angle x-ray scattering. Anal Chem 80 (15):5905-5911
14. Gigault J, Nguyen TM, Pettibone JM, Hackley VA (2014) Accurate determination of the size distribution for polydisperse, cationic metallic nanomaterials by asymmetric-flow field flow fractionation. J Nanopart Res 16 (11):2735. doi:10.1007/s11051-014-2735-1
15. Yu, Chang S-S, Lee C-L, Wang CRC (1997) Gold Nanorods: Electrochemical Synthesis and Optical Properties. J Phys Chem B 101 (34):6661-6664. doi:10.1021/jp971656q
16. Tirado MM, de la Torre JG (1980) Rotational dynamics of rigid, symmetric top macromolecules. Application to circular cylinders. J Chem Phys 73 (4):1986-1993 17. Tirado MM, de la Torre JG (1979) Translational friction coefficients of rigid, symmetric top macromolecules. Application to circular cylinders. J Chem Phys 71 (6):2581-2587
18. Gigault J, Le Hécho I, Dubascoux S, Potin-Gautier M, Lespes G (2010) Single walled carbon nanotube length determination by asymmetrical-flow field-flow fractionation hyphenated to multi-angle laser-light scattering. J Chromatogr A 1217 (50):7891-7897
19. Ortega A, Garcıa de la Torre J (2003) Hydrodynamic properties of rodlike and disklike particles in dilute solution. J Chem Phys 119 (18):9914-9919
20. Schimpf ME, Caldwell K, Giddings JC (2000) Field-flow fractionation handbook. John Wiley & Sons,
21. Gigault J, Pettibone JM, Schmitt C, Hackley VA (2014) Rational strategy for characterization of nanoscale particles by asymmetric-flow field flow fractionation: A tutorial. Anal Chim Acta 809:9-24. doi:http://dx.doi.org/10.1016/j.aca.2013.11.021
22. Phelan FR, Bauer BJ (2009) Comparison of steric effects in the modeling of spheres and rodlike particles in field-flow fractionation. Chem Eng Sci 64 (8):1747-1758
![Table 2: Shape model used to characterize the translational and rotational diffusion coefficient [16-19]](https://thumb-eu.123doks.com/thumbv2/123doknet/14797621.604647/11.1263.123.1156.138.630/table-shape-model-characterize-translational-rotational-diffusion-coefficient.webp)