HAL Id: hal-02187477
https://hal-univ-pau.archives-ouvertes.fr/hal-02187477
Submitted on 29 Jul 2019
HAL is a multi-disciplinary open access
archive for the deposit and dissemination of
sci-entific research documents, whether they are
pub-lished or not. The documents may come from
teaching and research institutions in France or
abroad, or from public or private research centers.
L’archive ouverte pluridisciplinaire HAL, est
destinée au dépôt et à la diffusion de documents
scientifiques de niveau recherche, publiés ou non,
émanant des établissements d’enseignement et de
recherche français ou étrangers, des laboratoires
publics ou privés.
Distributed under a Creative Commons Attribution - NonCommercial - ShareAlike| 4.0
International License
deposits based on outcrop examples in the Corinth Rift
Romain Rubi, Sébastien Rohais, Sylvie Bourquin, Isabelle Moretti, Guy
Desaubliaux
To cite this version:
Romain Rubi, Sébastien Rohais, Sylvie Bourquin, Isabelle Moretti, Guy Desaubliaux. Processes and
typology in Gilbert-type delta bottomset deposits based on outcrop examples in the Corinth Rift.
Marine and Petroleum Geology, Elsevier, 2018, 92, pp.193-212. �10.1016/j.marpetgeo.2018.02.014�.
�hal-02187477�
Contents lists available atScienceDirect
Marine and Petroleum Geology
journal homepage:www.elsevier.com/locate/marpetgeoResearch paper
Processes and typology in Gilbert-type delta bottomset deposits based on
outcrop examples in the Corinth Rift
Romain Rubi
a,b,∗, Sébastien Rohais
c, Sylvie Bourquin
a, Isabelle Moretti
b, Guy Desaubliaux
b aUniv Rennes, CNRS, Géosciences Rennes - UMR 6118, F-35000 Rennes, FrancebEngie, 1 Place Samuel de Champlain, 92930, Paris La Défense Cedex, France
cIFP Energies nouvelles - Géosciences Division, 1 et 4 avenue de Bois-Préau, 92852, Rueil-Malmaison Cedex, France
A R T I C L E I N F O
Keywords: Facies association Depositional architecture Sequence stratigraphy Hydraulic jump BypassA B S T R A C T
Middle Pleistocene Gilbert-type delta in the Gulf of Corinth, Greece, has been investigated combiningfield methods and photo acquisition by drone to generate a high-resolution 3D model. This study case can be used to document four different dynamics in Gilbert-type bottomset deposits, each one of which is characterized by a specific range of facies, facies associations and geometries: (1) the sandy-gravelly bottomset, (2) the erosional-bypass stage, (3) thefine-grained bottomset and (4) the massive-sandy bottomset. By comparing the typologies of the bottomset, we propose a conceptual model that predicts the occurrence of these four different bottomset stage dynamics depending on the stratigraphic context.
During highstand normal regression, the gravelly bottomset develops under subcriticalflow. The supercritical flow undergoes a stationary hydraulic jump in the toeset due to the slope break. As a result, a low-relief channel-levees system is formed in the bottomset. The channels arefilled/reworked by backstepping conglomeratic lenses interbedded with silty concave-up and concave-down levees. During normal regression, the foreset beds are steeper than during previous stage and scoured in the upper part. In the bottomset, significant erosion recording sediment bypass downstream toward the pro-delta can be observed. During lowstand normal re-gression, a starvedfine silt to shale bottomset onlaps onto the major erosional surface. The bulk of the coarse-grained sediments is stored in the delta topset and foreset. During the transgressive to highstand stage, the former topset and foreset are eroded by high-density turbidity currents and massive-sandy turbidites are de-posited in the bottomset, which onlap onto the foreset beds and form a slope apron geometry in the delta toe. The stratigraphic model improves the prediction for the sand distribution within the various parts of the bottomset. This approach is particularly relevant for clastic depositional systems with high sediment discharge and a high accommodation rate.
1. Introduction
The transfer of sediment from the catchment area to the deeper marine environments is crucial to better constrain the nature and ar-chitecture of sediments that control potential mineral resources (Sømme et al., 2009). The processes responsible for transporting and bypassing large volumes of sediment from the shoreline to the deep sea, such as submarine gravityflows, are a key factor to characterize and model the transfer of sediment (Nemec, 1990; Stevenson et al., 2015). Nevertheless, the bypass phenomenon has not been systematically de-scribed and integrated into a sequence stratigraphic framework. It is often difficult, if not impossible, to characterize the entire depositional profile, including the facies description and associated architectural elements from the sedimentary source to the most distal setting, with a
detailed characterization of the sedimentary processes integrated within a sequence stratigraphic framework in outcrops. To address this issue, we focus on a Gilbert-type delta, which has a short-length de-positional profile that allows to observe the entire dede-positional system from the sediment source to the deep basin (Fig. 1a).
Gilbert-type deltas,first described from Lake Bonneville beds, occur in front of river mouths in deep lacustrine (Gilbert, 1885) or marine basins (Postma and Roep, 1985) and are commonly linked with tecto-nically active settings (Gawthorpe and Colella, 1990; Dart et al., 1994; Dorsey et al., 1995). They have an internal tripartite architecture: topset, foreset and bottomset (Fig. 1a and b).
The geometries, sedimentary processes and stratigraphic archi-tectures in topsets and foresets are well known (e.g.Prior, 1981; Lowe, 1982; Postma, 1984a, b; Bornhold and Prior, 1988; Massari and Colella,
https://doi.org/10.1016/j.marpetgeo.2018.02.014
Received 23 April 2017; Received in revised form 23 November 2017; Accepted 12 February 2018
∗Corresponding author. Géosciences Rennes, UMR CNRS 6118, OSUR, Université Rennes 1, 35042, Rennes Cedex, France.
E-mail address:[email protected](R. Rubi).
Marine and Petroleum Geology 92 (2018) 193–212
Available online 19 February 2018
0264-8172/ © 2018 Elsevier Ltd. All rights reserved.
1988; Kostaschuk and McCann, 1989; Nemec, 1990; Horton and Schmitt, 1996; Massari, 1996; Breda et al., 2007; Rohais et al., 2008). Conversely, toesets and bottomsets are poorly charaterized and con-strained. The toeset forms the tangential transition from a foreset to a bottomset, and presents a large scale clinoform that has already been studied (Breda et al., 2007; Rohais et al., 2008; Gobo et al., 2014).
Three bottomsets typologies are commonly defined. Firstly,Gilbert (1885) describedfine-grained, shale to silt bottomset deposits, inter-preted as primarily recording a decantation process (Fig. 1a). This means that all the coarse-grained sediments are assumed to be stored in the delta or upstream. Secondly,Postma (1984a, b)andPostma and Roep (1985) illustrated the occurrence of pebbles in the bottomset, called bottomset-modified Gilbert-type delta (Fig. 1b), produced by major delta front failures. The conglomerates are limited in the bot-tomset area and could not reach the distal part of the basin. Thirdly,
Poulimenos et al. (1993)introduced the trapezoidal fan delta (Fig. 1c), which is a Gilbert-type delta characterized by the lack of bottomset deposits. It can either be explained by a sediment storage upstream from the bottomset area or by a sediment bypass in the bottomset area (Doutsos and Poulimenos, 1992). Under this last hypothesis it may possible to export coarse-grained sediments trough the basin. Never-theless, the presence of both a turbiditic system as well as conglom-eratic beds and channels described by Ferentinos et al. (1988) and
Rohais et al. (2008)in the Corinth rift cannot be properly explained by any of these three models (Fig. 1).
The purpose of this paper is to present for the Ilias Gilbert-type delta, exposed on the southern margin of the Gulf of Corinth: (1) a sedimentological description of the foreset-toeset-bottomset, (2) their geometries and related processes, in order tofinally establish (3) a se-dimentological model integrated within a sequence stratigraphic fra-mework.
We propose a comparison with studies based on the same outcrop (Rohais et al., 2008; Gobo et al., 2014) and with previous Gilbert-type delta models (Gilbert, 1885; Postma and Roep, 1985; Poulimenos et al.,
1993) to challenge them within a stratigraphic context. Finally, an in-novative model is proposed to document Gilbert-type delta typology stratigraphic evolution and sediment processes. Reservoir and seal oc-currences in the distal basin axis could then be better predicted, espe-cially in active tectonic settings such as rifts in their early phases. 2. Geological setting
The present investigations are based on the Ilias Gilbert-type delta, located on the southern coast of the Gulf of Corinth, Greece (Fig. 2a). The Gulf of Corinth is an active east-west graben with currently very fast north-south opening rates at 0.5 cm/yr eastward and 1.5 cm/yr westward (Tselentis and Makropoulos, 1986; Billiris et al., 1991; Clarke et al., 1997; Briole et al., 2000). The extension is generally interpreted as the result of a back-arc extension within the frame of the East Mediterranean subduction (Fig. 2a, e, g.Rohais and Moretti, 2017). As the gulf is also located at the tip of the North Anatolian Fault (NAF), the observed changes in subsidence and uplift are generally interpreted in relation with the propagation of the NAF. However the interactions between the two major features, subduction and NAF propagation, are complex and are still being discussed (e.g. Moretti et al., 2003, and references within). The thickness of the syn-rift sediments reaches up to 3 km and the current maximum water depth is 860 m (Clément et al., 2004). Extension started at the end of the Miocene in the Aegean Sea (Jolivet et al., 1994) as well as in the Corinth Rift (Papanikolaou et al., 2009) and affected an area much larger than the current gulf. The southern coast has been uplifted from ca. 0.8 Myr providing outcrops of early syn-rift sediments along a proximal to distal profile (e.g.Rohais et al., 2007; Rohais and Moretti, 2017). The uplift rate reached 1.5 mm/ yr since the late middle Pleistocene (Stewart and Vita-Finzi, 1996; Stewart, 1996). The rift sequence, referred to hereafter as the pre-rift basement, consists of a stack of Mesozoic and early Paleogene north-south oriented thrust sheets. The carbonate-dominated deposits have been highly structured by the Hellenic compressive phases.
The models for the stratigraphic evolution of the Gulf of Corinth available in the literature are mainly based on seismic interpretations; nevertheless, there is no deep well to constrain the facies, the thick-nesses or the timing of sedimentation of the offshore deposits. In con-sequence, the evolution of the Gulf of Corinth is still being debated and was recently reviewed (Nixon et al., 2016; Rohais and Moretti, 2017). From outcrops the evolution has been subdivided into three phases (Fig. 2b, c, Rohais et al., 2007): 1) the Lower group, composed of continental to shallow fresh or brackish lacustrine deposits with a subsidence compensated by sedimentation; 2) the Middle group, which recorded a major structural reorganization and an increase in bathy-metry with massive turbiditic deposits; during the late Middle group, Gilbert-type deltas developed on active normal faults and followed the northward fault migration; and 3) the Upper group, characterized by stepped terraces and slope breccias onshore in relation with the southern margin uplift and the rapid subsidence of the basin axis.
The Mavro-Ilias-Evrostini Gilbert-type delta (GTD) system is located between the cities of Derveni and Xylokastro (Fig. 2b). It developed during the late Middle group rifting phase (Fig. 2c) and was then fully exhumed during the recent Quaternary uplift of the southern margin. The stratigraphic architecture established byRohais et al. (2007, 2008)
considered that the Mavro GTD progrades from Mount Mavro and progressively passes downstream to the Ilias GTD. The Evrostini GTD developed on top of the Ilias GTD. The Ilias GTD (ca. 4 km long and ca. 300 m thick) spectacularly crops out along the Derveni River where the geometrical relationship from the foreset to bottomset and the asso-ciated turbidite systems can be studied in detail (Fig. 2d).
3. Dataset and methodology
This study is based on outcrop observations with conventionalfield methods and via abseiling: detailed logging scale 1/50e, facies
Fig. 1. a: Gilbert-type delta cross-sections fromGilbert (1885); b: Modified Gilbert-type delta fromPostma and Roep (1985); c: Trapezoidal fan delta fromPoulimenos et al. (1993).
Fig. 2. Regional context and geological map modified fromRohais et al. (2008); a: Structural context of the Gulf of Corinth with the North Anatolian Fault tip (NAF) shown in blue and the compressive thrust and Hellenic subduction shown in red; b: Geological map; c: Simplified stratigraphic log modified fromRohais et al. (2008); d: Geological map of the study area with position of the panoramas and log. (For interpretation of the references to colour in thisfigure legend, the reader is referred to the Web version of this article.)
description and facies associations, line-drawing on photomosaics and log correlations. Additionally, a 3D outcrop photogrammetric model has been carried out to generate a more accurate line drawing and architectural element analysis. Photo acquisitions by drone and model processing were performed with the support of IFPEN (Schmitz et al., 2014). Twelve flights resulted in the acquisition of more than 2000
georeferenced images. A specialist software (Virtuoso) designed by IFPEN was used to manage the layering visualization andfield data integration. The layers are displayed according to the scale observation (Fig. 3a–d); the various levels of the wireframe are dependent on the
zoom (Fig. 3a, c). Virtuoso was then used to perform the 3D correlation and to take measurements on the modelled geometries (dip, surface,
Fig. 3. Virtuoso Drone Workflow: a to d: two examples of line drawing. Ilias cliff overview: a: mesh density on the line drawing along the horizons and b: photo layer. Ilias bottomset outcrop: c: mesh density with key horizons and d: photo layer. e: Toeset Ilias cliff: interpretation with the dip and azimuth tools and log transparency along the cliff; the vertical resolution is around 5 cm in this area; f: photo of the drone and the camera pilot, a live video is displayed on a screen shown in the binoculars. See location inFig. 2.
length and vector; seeFig. 3e).
4. Facies and depositional model
The middle part of Ilias cliff shows the downstream transition from the foreset through the intermediate toeset to the distal bottomset in less than 1 km (Fig. 4). The foreset-bottomset geometry indicates a bathymetry that was more than 400 m deep. The main units have been identified based on their facies, facies associations, internal geometries and the relationship with their bounding surfaces (Fig. 4).
The facies description of the Ilias GTD (Table 1) is based on 16 detailed sedimentological sections; each facies is described, interpreted and classified from the coarsest (G1) to finest (F3) grains. From the foreset to the bottomset, the facies are gathered into six facies asso-ciations: 1) foreset; 2) modified foreset; 3) toeset; 4) sandy-gravelly bottomset; 5)fine-grained bottomset and 6) massive-sandy bottomset deposits. The results are presented from the foreset to the bottomset. 4.1. Foreset
4.1.1. Foreset facies association: For1
Description (i.e. G1, G2, F3;Table 1;Figs. 5a and 6a): The foreset facies association (For1) consists of two sub-facies associations: clast-to matrix-supported pebbly sandstones and conglomerates (For1a) and
shales (For1b). Both For1a and For1b are well-bedded with beds dip-ping from 15∘to 20∘.
The sub-facies association For1a is composed of an alternation of heterolithic pebbly sandstones and matrix-to clast-supported conglom-erates (facies G1, G2) organized in 1–10 m thick packages (Fig. 5a). The G1 and G2 facies may reach up to 1–5 m in thickness (Fig. 5a, top of
Fig. 6b). Clasts are generally sub-rounded to rounded. The massive fa-cies G1 is matrix-to clast-supported with common openwork. Fafa-cies G2 corresponds to coarse-grained sand matrix-supported and cobble to pebble conglomerates displaying a crudefining-up feature. The top and bottom of the beds are continuous and extend up to several hundred metres in length.
The sub-facies association For1b is made up of 1–5 cm thick shale beds (F3) withoutfloating clasts draping the 15∘to 20∘dipping foresets with a total thickness of 50 cm (Fig. 5a).
Interpretation: Massive clast-supported conglomeratic beds (G1) are interpreted as the result of a mass freezing and/or debrisflow deposits (Lowe, 1982; Postma and Roep, 1985; Colella et al., 1987; Prior and Bornhold, 1988; Nemec, 1990; Mulder and Alexander, 2001). The matrix-rich foreset deposits (G2) are interpreted as the result of hy-perconcentrated density flows (sensu Mulder and Alexander, 2001). Debrisflows and en masse depositions are in accordance with the ori-ginal description ofGilbert (1885)to maintain the angle of repose of this coarse-grained material on the slope of the delta.
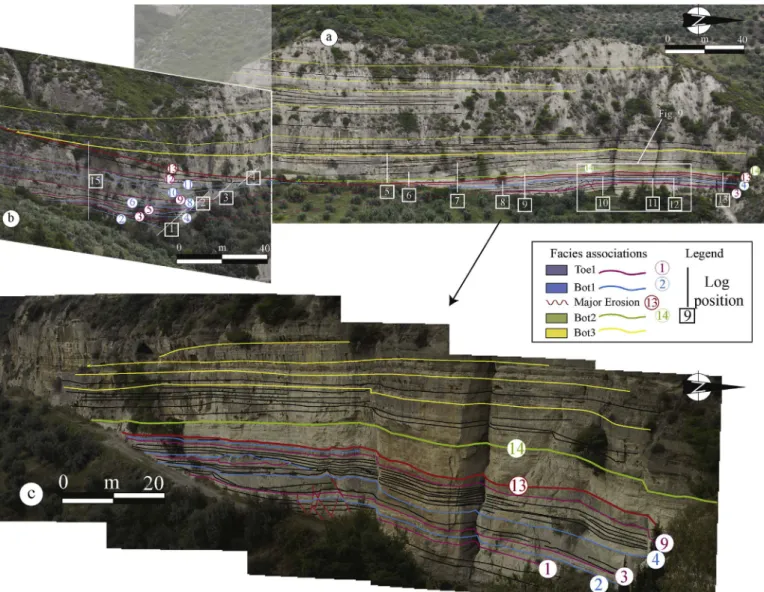
Fig. 4. Ilias architectures for the toeset, bottomset and location of the sedimentological sections; a: bottomset overview; b: toeset overview; c: zoom on the bottomset area. SeeFigs. 2d and 3a for the location.
The shale deposits withoutfloating clasts (F3) are interpreted as a decantation deposit (Breda et al., 2007) and highlight an inactivity in this foreset area: during a change in the sediment delivery point on the topset or during a lower sediment supply from the delta.
The foreset facies association (For1a) is characterized by gravity-drivenflows as debris flow and hyperconcentrated density flow, with episodes of decantation illustrated by mud drapes (For1b), attesting to discontinuousflows or lateral decantations.
4.1.2. Modified foreset facies association: For2
Description (i.e. G3, G4, F1;Table 1;Figs. 5a and 6b): The modified
foreset facies association (For2) mainly consists of conglomerates ran-ging in grain size from cobbles (G3) to granules (G4) and silt lenses (F1). The basal surface of this facies association presents large and deep erosion features and scours. These erosions arefilled by ca. 3-5 m-thick units organized in beds with a dip declination ranging from 0∘to 5∘ (Figs. 5a and 6b). For2 also exhibits cross-bedded conglomerates with a
Table 1
Transition from the foreset to the bottomset: facies description and interpretation in terms of depositional process.
Schema Name Facies Name DescripƟon Bed Geometry
Processus ClassificaƟon from Mulder
& Alexander (2000) Fo r1 Fo r2 To e 1 Bo t1 Bo t2 Bo t3
G1 Well bedded massive strutureless
conglomerate
Well bedded conglomerate matrix (very coarse sand) to clast supported. Granules to cobbles clasts size.
Unsorted and unclassed. Erosive surface at base
Planar bed with 15° to 20° dip 1 to 2 meters thick
Masse freezing Debris Flow Deposit (Holmes, 1965; Nemec, 1990 Postma 1990; Miall
1996)
1
G2 Well bedded fining up conglomerate
Well bedded matrix supported (coarse sand) conglomerate. Clasts size cobbles to granules. Clasts size fining up and proporƟon decrease
Planar bed with 15° to 20° dip 1 to 3m thick
Debris Flow Gravity processes (Holmes, 1965; Nemec, 1990 Postma 1990; Miall
1996)
1 2
G3
Cross-bedded pebble to granule conglomerate
(heteroliƟc )
HeteroliƟc conglomerate cross bedded (granules to cobbles) with a coarse sandy matrix Large erosion - incision at base with 15° deep
conglomerate deposits
5 m thick unit of 0.2 to 0.5 m thick set Variable dip from 0° to 25°
Poor lateral extension AnƟdune - Chute-and-Pool
MulƟstored Hydraulic Jump (CarƟgny et al., 2014) (Postma et al., 2014, 1984)
2
G4 Chute and pools clast supported
pebbles conglomerate
Cobble to pebble clast supported conglomerate SomeƟmes lateral grainsize variaƟons and
internal erosion. Medium sorted and classed Oblique shear stress at top
0.15 to 2 m thick Variable dip deposiƟon High lateral thickness and granulometry variaƟons
Chutes and pools bed geometry
CriƟcal flow condiƟons Generated by Hydraulic Jumps
Hyper concentrated flow (CarƟgny et al., 2014) (Postma et al., 2014, 1984)
3
G5
horizontal bedded with internal backstep cross straƟficaƟon pebble
conglomerate (heteroliƟc)
Cobble to pebble conglomerate Clast supported Erosional basal surface
Inverse grading at top Some pebble layers show an oxidaƟon surface
1m thick bed with 0.3 to 0.6 m thick set straƟficaƟon Horizontal planar bedding Locally show backstep sets deposit with
chutes and pools features
Downstream to a hydraulic jump (CarƟgny et al., 2014) (Postma et al., 2014, 1984)
3 6
G6 Granules Lenses
(heteroliƟc)
Granules to locally pebble to conglomerate Current ripples and by pass features
Normal grading
0 to 0.3 m thick Large lenses UndulaƟon features
CriƟcal flow condiƟons Generated by hydraulic jump
3 6 5
GT1 Horizontal pebble conglomerate
(heteroliƟc)
Cobble to pebble conglomerate Clast supported Inverse grading at top Poorly sorted / Graded
20cm to 1m thick Horizontal planar bedding
Gravelly High Density Turbidity (HDT) Deposits (Facies 8, R3, Lowe 1982) (Stow & Johansson, 2000)
4
GT2 Horizontal well bedded sandstone
(heteroliƟc)
Well bedded sandstone fine to coarse with floaƟng pebbles (isolated to imbricated, tracƟon
carpet) OxidaƟon traces
1cm to 1m thick Horizontal planar bedding
Gravelly High Density Turbidity Deposits (Facies 8, S1, Lowe 1982) (Stow & Johansson, 2000)
4
S1 Sandstone with current ripples
(heteroliƟc)
Fine to coarse sandstone Planar base Starved current ripple and by pass features
VerƟcal BioturbaƟon
Lenses thickness is 5cm UndulaƟng geometry
SubcriƟcal flow condiƟons By pass
3 6 5
F1
Horizontal siltstone with aligned floaƟng pebbles
(heteroliƟc)
Horizontal planar laminaƟon Aligned floaƟng clast and or isolated floaƟng
clast (oŌen pebbles)
2 to 10 cm thick Generated by upstream or lateral Hydraulic Jump
2 3 6 5
F2
Horizontal well bedded shales with rare isolated pebbles
(heteroliƟc)
Well bedded shales with rare isolated pebble. Ripples marks and by pass
20cm to 1m thick of
thin shale layers (1 to 5mm) Mainly decantaƟon deposit
5
F3 Shales Laminated shales Planar bed with 20° dip
1 to 5 cm thick
LaƩeral decantaƟon InacƟve Foreset
1
X1 Muddy matrix rich conglomerate
Clast to matrix supported mud clast conglomerate. Erosional Lower and uneven upper boundaries
Thin to medium thick bedded 0.1 to 0.5m thick
Mudclasts Lag, Hydraulic fracturing
Local deposiƟon
3 5
X2 ChaoƟc deposit (Slump) ChaoƟc deposits of folded and brecciated blocks
of sediment
Thin to medium thick bedded
0.1 to 1m Slumps and Slides
3 5
Main characterisƟcs of the sedimentary facies and their interpretaƟon in terms of deposiƟonal process : TransiƟon Foreset to BoƩomset
general backstepping bed deposition and antidune, chute-and-pool and cyclic step bedforms. The backstepping bed consists of sub-rounded to rounded clasts showing imbrication structures. The thickness of the conglomerate beds varies from 0.2 to 0.5 m for G3 facies and from 0.15 to 2 m for G4 facies. Conglomerate beds (G3, G4,Table 1) alternate with thin silt lenses (F1) with aligned floating pebbles and current ripples, recording a multiphase deposition event.
Interpretation: The basal erosional surface is interpreted as formed under high velocity currents, i.e. able to erode conglomerate and so promoting deep erosion features and scours. The well-organized fabric of cross-bedded backstepping upslope conglomerates is interpreted as coarse-grained lag deposits (sensuStevenson et al., 2015) under a high velocity flow building antidune, chute-and-pool and cyclic step
bedforms with a dip declination ranging from 0∘to 5∘. These bed forms and the upslope migration are key observation to argue for supercritical flow conditions (Smith et al., 2007; Cartigny et al., 2014) and are the witness of hydraulic jump deposits on the delta slope (Massari and Parea, 1990; Massari, 1996; Breda et al., 2007; Fernandez et al., 2011; Clarke et al., 2012; Clarke, 2016). The cross-bedded chute-and-pool conglomerates are so interpreted as coarse-grained lag deposits (sensu
Stevenson et al., 2015) under supercriticalflow conditions (Cartigny et al., 2014) may generating hydraulic jumps on the slope.
The silt lenses with current ripples are interpreted as a draped erosion surface (sensuStevenson et al., 2015), with discontinuous lags of coarse-grained sediment, i.e. alignedfloating pebbles interbedded withfine-grained facies (Beaubouef et al., 1999). The draped erosion
Fig. 5. Sedimentological sections with the facies, facies associations, and key surfaces for the a: foreset; b: toeset; and c: bottomset. SeeFigs. 2d and 4a for location.
surface is often observed veneering an erosional basal surface of scour-and channel-form bodies (Stevenson et al., 2015, and references within). Draped erosional surfaces in the delta foreset are also inter-preted as several amalgamation surfaces (sensuDietrich et al., 2016) onlapping the multi-erosion surfaces.
Consequently, the draped erosion surfaces and coarse-grained lag deposits are key features to identify a major sediment bypass (e.g.
Stevenson et al., 2015) during high-energy episodes. High-discharge events such asflooding on the channelized foreset are suitable condi-tions to generate hydraulic jumps on the delta slope (Breda et al., 2007; Dietrich et al., 2016; Clarke et al., 2012; Clarke, 2016).
4.1.3. Dip evolution on foreset beds
When outcrop is not accessible, the slope of the foreset (Fig. 7) was measured with the Virtuoso software. Dip measurements were taken along a vertical cliff measuring 60 m high. A 10–20 m escarpment in-side the outcrop can be used to take triangulated dip measurements.
During the deposition of the Bot1 facies association, the angle of the foreset beds increases from 19.7∘to 23.6∘. It corresponds to the brown lines inFig. 7from For1bed 1 (19.7∘) to For1bed 3 (23.6∘). The steepest foreset is reworked to form the For2 facies association. The steepest foreset beds are interpreted as having formed during the maximal progradation of the delta. Then, a major undulating surface erodes the previous foreset beds (ERO onFig. 7and corresponding with Line 13 on
Fig. 6. Facies photo; a. Facies of the foreset association For1a (20 dip) with G1 (Table 1), well-bedded massive structureless conglomerates, and G2 (Table 1), well-beddedfining-up conglomerates; b. Contact between the For2 and For1 facies associations. For2: at its base, a scour isfilled by the G3 facies with a dip of 5 opposed to the general normal dip of 20; the scour is then eroded and sealed by F1. For1 is constituted of thick and continuous planar beds (G1 and G2). This outcrop is located on the west side of the Ilias foreset; c: Foreset facies association For1a where the G1 massive bed is eroded by surface 4. The erosion isfilled by chute-and-pool backstepping deposits of the toeset facies association Toe1 from conglomerates G4 tofine deposit S1/F1; d: Illustration of the transition from Bot1 to Bot2, and the Bot3 facies associations. In further detail, Bot1 is composed of a bimodal granulometry with conglomerate G5 and silt F1. Bot1 is eroded by surface 13 and a large lens of Bot2 is observed with a thin facies association (G6, S1, and F2). The top of this sequence is deformed (local decametric slump X2, injectites) by the weight of the next facies association, Bot3, and is limited by surface 14; e: Details of the Bot1 facies association (in the distal part of the study cliff): lenticular shape of the beds (G6, S1), red condensed surfaces and current ripples (S1); f: Bot3 facies association with facies GT1 (clast-supported) and GT2 (matrix-supported with aligned clasts) generated by high-density turbidites. (For interpretation of the references to colour in thisfigure legend, the reader is referred to the Web version of this article.)
othersfigures). This major erosional surface has a dip of 25.8∘which is the maximum measured angle. The same pattern is observed along the outcrop in the underlying deposits, with a foreset slope increase, a foreset beds reworking, andfinally foreset beds erosion in their upper part.
4.2. Toeset
The toeset outcrop is 15 m high and 50 m long with a 15 m es-carpment inside the outcrop, allowing 3D geometries to be determined. The toeset is located at the base of the outcrop and shown with purple lines (Fig. 4b). The toeset comprises the arriving foreset debrisflow (For1a) and the toeset facies association (Toe1;Fig. 5b).
4.2.1. Facies association Toe1
Description (i.e. G4, G5, G6, S1, F1, X1, X2,Table 1,Figs. 4b, 5b and
6c): The Ilias Gilbert-type Toeset facies association mainly consists of an alternation between silty-sandy deposits (S1, F1) and pebble con-glomerates (G4, G5, G6). Bothfine- and coarse-grained deposits are organized in lenticular gently dipping beds. Backstepping geometries are common with evidence of antidune, chute-and-pool, and cyclic step bedforms (sensuCartigny et al., 2014, onFig. 6c). The cyclic steps have an apparent wavelength about 50 m in the toeset (see the scale in
Fig. 4b) which is a minimal wavelength due to the erosion of the lee side (Clarke, 2016). Cobble to pebble clast-supported conglomerates (G4, G5, G6) are organized in lenticular beds that are 0.15–2 m thick (Fig. 5b) with a highly variable grain-size distribution. The deposits display lateral bedded subdivisions and significant internal erosions. The top of the beds commonly shows erosion and inverse grading. Silty-sandy lenticular deposits present various grain sizes from shales with alignedfloating pebbles (F1) to very coarse-grained sandstones (S1) without any bioturbation. Mud clasts lag deposits (X1) and a local
Fig. 7. Virtuoso screenshot from the Ilias foreset cliff; a: slope evolution in the foreset beds along a vertical profile; b: the dip is plotted against the direction. The foreset dips increase and arefinally eroded by Ero1 (Line 13). Bot3 onlaps this erosional surface. SeeFig. 2d for the location.
Fig. 8. Correlation of the sedimentological sections (Log 1 to 15) in the Ilias toeset bottomset (see location in Fig. 4 ). The correlations are controlled in the fi eld and with line drawing on the panorama (see Fig. 4 ). Correlations between the toeset and bottomset under line 13 are aff ected by an observation gap. The analysis between the facies and erosional surfaces (at the base and top) can be used to correlate the key surfaces of the toeset to bottomset (see the text for an explanation). Above line 13 (in red), the Bot2 and Bot3 facies associations onlap line 13. See Figs. 2d and 3 a for location.
slump (X2), which form 1–20 cm thick beds, are observed only in this facies association.
Vertical evolution in the toeset area: Between lines 1 and 9, the se-quences in the toeset area are commonly 5–7 m thick with a fining- and thinning-up trend (Fig. 5b). The toeset sequence is commonly char-acterized at its base by a 2 m thick debrisflow (For1a) associated with a dm-thick slump (X2) and mud clasts lag deposits (X1). The debrisflows are sourced from the foreset, and are deposited above an erosive planar base (purple lines 3, 5, 9, 12 inFigs. 5b and 8). At the top, they are progressively eroded (blue lines 4, 6, 7, 8 inFigs. 5b and 8) and form resedimented chute-and-pool backstepping Toe1 beds (Figs. 4b, 5b and 6c, 8) consisting of lens shaped deposits of very coarse-grained sand-stone tofine facies (S1, F1).
Interpretation: The chaotic deposits (X2) associated with muddy matrix-rich conglomerates (X1) are interpreted as products of slumps and slides. The conglomerate and sandstone facies (G4, G5, G6, S1) are interpreted as bypass features recorded by coarse-grained lag deposits (see4.1.2). The silty-sandy (S1, F1) lenticular deposits are interpreted as draped erosion surface (see 4.1.2). The heterolithic and repetitive character of these deposits are interpreted to be related to periodicflow behaviour.
Additionally, the cyclic steps are interpreted by Cartigny et al. (2014)as a periodic upstream-migrating hydraulic jumps. As the hy-draulic jump is located at the slope break, energetic currents erode the delta toe. When the scour becomes too deep, slides occur upstream to stabilize the slope andfill the scour. The top of the debris flows arriving from the foreset (For1a) are progressively eroded and reworked in multi-bedded cyclic-step deposits (Toe1). Moreover, the significant thickness and vertical stacking of the Toe1 facies association, argue for the presence of a stationary hydraulic jump at the bottom of the slope between the delta-slope and basin (Massari and Parea, 1990; Fildani et al., 2006; Kostic and Parker, 2006; Breda et al., 2007). Criticalflow develops at the transition between supercritical (Froude number (Fr) > 1) and subcritical flow conditions (Fr < 1). A critical flow condition refers to a Fr value equal to 1. It corresponds to the stage in which the flow experiences the hydraulic jump (Kostic and Parker, 2006), in this case in the toeset area.
4.3. Bottomset
Downstream, through the northern part of the Ilias GTD cliff, the beds are generally horizontal to gently northward-dipping (Fig. 4a) and the grain size decreases along the south-north profile. The bottomset package is ca. 40 m thick with three bottomset facies associations and one major erosion/bypass surface (Fig. 5c). From the base to the top of the cliff, the beds are organized as follows: ca. 15 m of the Bot1 facies association, one erosive/bypass surface for Ero1, ca. 5 m of the Bot2 facies association and at least 20 m of the Bot3 facies association (Figs. 5c and 8).
4.3.1. Sandy-gravelly bottomset facies association: Bot1
The base of the northern cliff is formed by the Bot1 facies associa-tion between lines 1 and 9 and is ca. 15 m thick (Figs. 4 and 8).
Facies description (i.e. G5, G6, S1, F1;Table 1;Figs. 4, 5c, 6d–e): The
bottomset facies association (Bot1) consists of a wide range of grain sizes from pebbles to silts forming horizontal to gently dipping beds (Fig. 4c). The top of the beds displays erosional large-scale undulation features. The bottomset facies association is formed by an alternation between two sub-facies associations both presenting lateral thickening and facies variations.
The conglomerates (Bot1a = G5, G6; Table 1; Fig. 5c; base of
Fig. 6d) present backset clast imbrication features, internal backset geometries and show basal and upper erosional boundaries. They can also form amalgamated beds with a thickness ranging from 50 cm to 1.5 m.
Very thinly laminatedfine-grained facies (Bot1b = S1, F1,Table 1,
Figs. 5c, 6e) also show bypass features such as frequent current ripples, aligned floating clasts, basal and upper erosional boundaries. Rare vertical bioturbations are observed. Bot1b presents important thickness variations from 25 cm to 3 m.
Architecture description: Details of the Bot1b deposits are presented inFig. 9along a single panoramic photograph cut into three parts (a, b and c) with the associated sedimentological logs. Three units are stacked on top of one another in a compensational manner (see the arrows which represent the maximal thickness inFig. 9).
Thefirst unit (unit A, down line 1,Fig. 9) developed a convex-up geometry forming a lobate geometry, with a maximal thickness of 3 m on the panorama (part b,Fig. 9). The beds are thicker and coarser-grained away from the apex of the former lobe. Bypass features are characteristic of facies association Bot1b: current ripples, erosional surfaces, lag surfaces and an erosional surface with a 4–5 m wave-length. The coarse-grained beds have a lenticular shape and are dis-continuous; for example, the G5 bed is 25 cm thick in part c (at 5 m on log 11) and is totally eroded or non-deposited on parts a and b of the panorama (Fig. 9). Unit A is formed by a positive geometry, with a wavelength of 4–6 m and a vertical amplitude of 50 cm.
The second unit (unit B, between lines 1 and 2,Fig. 9) is deposited as lateral offset deposit on the previous unit A on the southern part of the outcrop. It is affected by syn-sedimentary normal faulting with a maximal offset of 1 m. In the faulted area, 25 cm thick coarse-grained beds (G5) alternate with 25 cm thickfinely laminated silt to sand beds withfloating pebbles (S1/F1). These beds pinch downstream above the unit A lobe apex and only form erosive surfaces. Unit Bfills the low topography created by the lobe geometry of unit A.
The third unit (unit C, between lines 3 and 4,Fig. 9) is a gravelly unit of Bot1a constructed by multiple erosional events. Bot1a beds have a planar basal surface and are eroded with a deep incision (20 cm). Unit C is composed of large scale backsets and internal cross-stratification, highlighted by thin silt internal beds. Between logs 9 and 10, separated by 5 m, four 20 cm thick conglomeratic beds interbedded with 20 cm thick silt beds (log 9) correlate downstream (log 10) with a massive 2 m thick conglomeratic bed. The coarse facies (Bot1a) are deposited in lateral compensation and eitherfilled and/or eroded the local low in the topography formed by Bot1b (Fig. 9a). The top of the unit is then eroded by line 4.
The bottomset beds between lines 4 to 6 are deeply eroded by line 7 (Fig. 8). The erosion is total for Bot1a (above line 5) and it formed an approximately 10 m long and 1 m deep depression which isfilled by the Bot1b thin beds, onlapping onto the erosional surface 7. Between lines 7 and 8, thick conglomerate beds (log 8,Fig. 8) are subdivided down-stream into two conglomeratic beds separated by thin silt deposits (log 9). Downstream (roughly 40 m), the conglomeratic beds are totally eroded and only erosional surfaces with current ripples are observed (log 13). Above line 9, the conglomeratic beds (log 7) are deeply eroded between logs 9 and 13 and are preserved downstream (logs 13 and 14). Above this conglomerate, the beds are eroded by Ero1 (surface 13).
Cross line description: These observations need to be completed with a perpendicular cross-section to handle the complex 3D architecture:
Fig. 10presents the bottomset architecture, located at a right angle from the otherfigures, i.e.Figs. 4, 8, 9(location onFig. 2d).
The panorama exposed a channel-levee architecture with a channel measuring 15 m limited by levees with a dip ranging from 25∘to 30∘and aflow direction of N55∘10∘. This section constrains the facies asso-ciations: the channel isfilled by the Bot1a facies association and the levees are constructed by Bot1b facies association. At the same strati-graphic level, other channel-levee complexes are observed laterally to this channel, through the south outcropping cliff. The channel-levee complexes are organized in a low-relief morphology with several active channels that are poorly confined by small-sized levees. The channel systems evolve downstream to a large channel belt (30–40 m-wide).
Correlations: The transition between the Toe1 area and bottomset area is poorly exposed in the outcrop (in green,Fig. 8). However, as
shown inFigs. 4 and 8, the erosional surface (line 13) provides a well-constrained boundary and the dip of the toeset and bottomset beds provides limits for the correlation between the toeset and bottomset. Accordingly, below the major erosional surface (line 13), Toe1 is lo-cated upstream (S,Fig. 8) and Bot1 is found downstream (N,Fig. 8).
In order to correlate Toe1 and Bot1, we considered the planar base of the conglomeratic beds (purple lines in Fig. 8) as being relatively continuous. Above the major erosional surface (line 13), Bot2 and Bot3 are not affected by uncertainty (Fig. 4).
Interpretation and sedimentological model: Bot1a with backset clast imbrication features, internal backset geometries and basal and upper erosional boundaries is interpreted as a coarse-grained lag deposits (see
4.1.2) formed through sustained bedload transport process. Bot1b with thin silty beds with current ripples, alignedfloating clasts, basal and upper erosional boundaries and rare vertical bioturbations is inter-preted as draped erosion surfaces (see4.1.2) recording by-pass.
Both Bot1a and Bot1b are interbedded in a complex 3D architecture forming low relief channel-levee geometry. Coarse-grained deposits, Bot1afilled the channel and the draped erosion surface, while Bot1b with important thickness variations, built levees that were produced by lateral overflow deposits. The bedload sediments may have partially bypassed the bottomset, and the upper part of theflow mainly bypassed the low relief channel through the basin. The bypassed currents may also contribute to the low relief channel-levee formation.
Fig. 9. Details of the panorama geometry for the bottomset (see location inFig. 8) in three continuous pictures (from a to c). The three units (A, B, C) are deposited in lateral compensation. Unit A has a lobe shape convex-up geometry with a coarsening- and thickening-up trend away from the apex. Unit B is affected by syn-sedimentary faults (maximum of 1 m of offset) and presents a bimodal fine and coarse-grained succession. Unit C is composed of coarse-grained deposits with thin oblique silt beds. The conglomeratic bed is formed by an oblique backstepping stratification and is deeply eroded at the top.
Based on the correlations panel (Fig. 8), Bot1 is located downslope of Toe1, i.e. located downstream a hydraulic jump and so deposited under subcriticalflow conditions. As highlighted byMcCowan (2001), the hydraulic jump produces oblique velocity vectors with an angle of 80∘compared to the axialflow and may produce significant levees. The inception of deep-water channels have been documented from Lucia channel system (California) by initial erosion stages with cyclic steps bedforms bounded by hydraulic jumps (Fildani et al., 2013; Covault et al., 2014). Moreover, the early formation of a channelized geometry immediately downstream from the hydraulic jump was recently pro-posed byde Leeuw et al. (2016)from lab experiments and they docu-mented that the channel inception is erosional in the upper slope and depositional in the middle and the lower slope.
Coarse-grained sandstone to conglomerate andfine-grained to silt beds have been described as bi-modal sedimentation. By comparing the sedimentological sections, coarse- andfine-grained modified bottomset are respectively associated with Bot1a and Bot1b.
Postma (1984a,b) interpreted the bi-modal sedimentation as the product of a gravity winnowing process, i.e. no erosive currents, limited to the proximal bottomset and the gravel imbrications as shear bands. But the sedimentary by-pass features and cyclic-step bedforms pre-sented above indicate that a hydraulic jump can be inferred to rework and generate constructive bedforms in the bottomset and explain the export of sediment observed in the basin.
Postma and Roep (1985)suggested the presence of a hydraulic jump at the slope break, which transforms slides from the upper delta-slope into a high-density turbulent flow only associated with episodes of coarse-grained sedimentation.
We propose that the hydraulic jump erodes the base of foreset beds, i.e. in toeset, causing a depression and a destabilisation of the lower delta-slope, and that in consequence a debrisflow fills the depression. This deposit is then eroded and reworked by the hydraulic jump cur-rents and built downstream the low-relief channel-levee bottomset above erosional surface.
The Bot1 facies association highlights a new typology in the bot-tomset with low relief channel-levee produced by a stationary hydraulic jump in the toeset. The major part of the sediment is exported to the basin through the channel (Fig. 11a).
4.3.2. Major erosional surface: Ero1
The previous deposits (from lines 1 to 12,Figs. 4 and 8) of the toeset and Bot1 facies association are eroded by a major erosion surface: surface 13 (Figs. 4, 5, 6d and 8). This surface is sub-parallel with the bedding in the bottomset, however we observe a deep incision in the conglomeratic bed located just under the erosion surface and a slanting erosion of the toeset beds (Fig. 6d and lines 10, 11, 12 inFig. 8).
This surface has been already described in the foreset deposits with an erosive angle of 28∘(see section4.1.3,Fig. 7) and in the toeset area
Fig. 10. Panorama of the Ilias bottomset with low relief channel and levee system. The photo illustrates a cross-section located downstream from the previousFigs. 6–9. Theflat braided channel levee geometry is observed with the levee facies association Bot1 in green, and channel facies association in blue. The thickness of the channels is 6 m in average. The channel is limited on the NW side by a sharp erosional surface in the levee facies. On the SW side, the levees have the same thickness as the channel. Channel 6 overspills the SW levee and forms another active channel on the SW side. The channel complex isfinally overfilled by the Bot3 facies association. SeeFig. 2d for location. (For interpretation of the references to colour in thisfigure legend, the reader is referred to the Web version of this article.)
(see4.2.1). The overlying bottomset deposits onlap onto this surface (Figs. 4 and 8). Consequently, this surface highlights a major change in the dynamics of the sedimentary system. It corresponds with the stage of maximum progradation of the delta and is marked by the steepest foreset beds. Most of the sediment is exported through the basin and the flow erodes the previous bottomset beds (Fig. 8) and reset the
channel-levee relief. This deltaic dynamic is called Ero1; it is illustrated by
Fig. 11b and is characterized in the bottomset by a total bypass of the sediment.
This stage without bottomset deposit can be compared with the trapezoidal fan delta (Poulimenos et al., 1993); the lack of bottomsets can be explained by a total sediment bypass and or erosion in the
Fig. 11. Sedimentological model and key processes in the bottomset. a: Bot1 develops under subcriticalflow conditions. An active stationary hydraulic jump at the toeset erodes and deposits Toe1. The downstream Bot1 presents a bimodal sedimentation with coarse-grained backstepping beds (Bot1a) andfine-grained beds (Bot1b). They have a flat braided channel levee morphology with channels (Bot1a) and levees (Bot1b). b: Ero 1 highlights significant erosion from the foreset to the bottomset that exports the fine- and coarse-grained sediments into the basin. c: Bot 2 is composed offine-grained deposits transported by low-density turbidites with a coarsening-up trend. d: Bot 3 provides evidence for high-density turbidity flows and formed a slope apron on the delta toe.
bottomset area (Doutsos and Poulimenos, 1992).
4.3.3. Fine-grained bottomset facies association: Bot2
The Bot2 facies association is ca. 5 m thick above line 13 (Fig. 5c). Description (i.e. G6, S1, F1, F2, X1, X2;Table 1;Figs. 4, 5c, 6d and 8): Thefine-grained facies association (Bot2) is organized in large lenses (80 m long and 5 m thick,Fig. 4c between surfaces 13 and 14). Bot2 onlaps the foreset beds and overlies the previous unit of the bottomset (Bot1). It fills the toeset area and presents a general coarsening-up trend.
The lenses are constituted of a large-scale veneering of heterolitic claystone to siltstone that is thinly laminated with rare isolatedfloating pebbles. At the base of the lens, several reddish surfaces with current ripples are observed. At the top, thefinest facies F2 and F1 are eroded by sandy S1 and gravely lenses G6 (Fig. 6d). Facies G6 and F1 show bypass features as undulating beds and current ripples. Several metric slumps (X2) and mudclasts (X1) are observed at the top of the lens.
Interpretation and sedimentological model: The thin (5 m) lenses with a coarsening-up trend are interpreted as the result of decantation (F2) and low concentrated turbidite (F1). Then, occurrence of current rip-ples and few undulating beds argue for turbulent flows (Stevenson et al., 2015) possibly under subcriticalflows. The metric slumps are interpreted as the result of an overloading that destabilized the Bot2 facies association. This bottomset stage is interpreted as a starved bottomset. Moreover, the coarse-grained sediments being absent, they are assumed to be stored upstream, in the drainage basin or in the delta topset. The sedimentological model is shown inFig. 11c.
In the Gilbert model, the bottomset is preliminary the result of hypopycnal processes: thefinest sediments are carried far out in sus-pension by the superficial stream and selectively sinks to the bottom depending on the grain size. Thefine-grained bottomset facies asso-ciation Bot2, deposited from low density turbidity currents and that onlap on the foreset beds can be associated with the Gilbert model. The transition between the foreset and bottomset can be formed by two architectures: downlap of the foreset beds or onlap of the bottomset beds depending on the A/S ratio.
4.3.4. Massive sandy bottomset facies association: Bot3
The Bot3 facies association is at least 20 m thick above Bot2, line 14 (Fig. 5c).
Description (i.e. GT1, GT2;Table 1;Figs. 4, 5c, 6f and 8): The massive sandy to gravely bottomset facies association consists of planar hor-izontal to gently dipping bed geometries with an erosive base. This facies association is formed by very poorly sorted, pebble to granule conglomerates containing either clast-supported (GT1) or matrix-sup-ported coarse-to medium-grained sand (GT2), with occasionally aligned and imbricated pebbles (Fig. 6f). These deposits are organized in 0.30–1 m thick beds showing a fining- and thinning-upward trend. Locally, the beds present inverse grading at the top. Thefirst massive sandy deposit presents a general large-scale cross backstep sets (Fig. 4a).
The general architecture of the beds onlaps onto the underlying foreset and forms a coarse-grained slope-apron system. The internal slope of Bot3 (Figs. 4, 7a and 8) decreases sharply and the bedding becomes horizontal 17 m above the erosional surface. The previous channels and levee deposits are overfilled by Bot3 (yellow lines in
Fig. 10b).
Interpretation and sedimentological model: The massive poorly sorted, clast-to matrix-supported (GT1 - GT2), sandy to gravely deposits in the bottomset and metric bedding are interpreted as being generated by two processes: sandy debris flow (SDF) and high-density turbidity (HDT) currents (sensuStow and Johansson, 2000) respectively corre-spond with hyperconcentrated to concentrated density flow (sensu
Mulder and Alexander, 2001). The very thick sand beds devoid of pri-mary sedimentary structures are characteristic of the Deep Water Massive Sands (DWMS,Stow and Johansson, 2000). The coarse clast-size, granule to pebble, and the lobate architecture of the beds are characteristic of type I of DWMS, located in proximal systems domi-nated by coarse-grained facies. We can interpret Bot3 as type I DWMS deposits (sensuStow and Johansson, 2000), developing preferentially along the tectonically active margin, downstream from the braided delta system, and forming a coarse-grained slope-apron system, which covers the system. Thus, to the best of the authors knowledge, thefirst evidence of DWMS in the bottomset area of a GTD is documented. Bot3 covers the system by forming an overlap of sandy-rich lobe, so the
Fig. 12. Comparison of the line correlations and stratigraphic cycles, i.e. relative base level cycles, betweenRohais et al. (2008), Gobo et al. (2014)
and this study. Assuming a constant sediment supply (S), we only consider the variation of the accommodation (A), which is related to the Re-lative Water Level (RWL). The RWL trend is in line withRohais et al. (2008)proposition but we detail the Progradational System (ST1) by iden-tifying Bot1, Ero1, Bot2 generated during HNR, FR, and LNR stages, respectively. The processes used byGobo et al. (2014)model explain the in-coherency between the models. Rohais et al. (2008)and our study agree with a transgressive stage during the deposition of Bot3, contrary to
Gobo et al. (2014)who propose that the TFA prevails during the RWL fall.
conglomerates are mainly stored upstream, i.e. in the topset or in the catchment area. Due to the lack of foreset beds and the onlap of Bot3 on the slope of the delta (Fig. 4), theflow carrying the sand must by pass the foreset area and collapses/deposes in the bottomset to form a sandy slope apron. The lack offine-grained deposits is interpreted as being exported through the basin by turbidity currents (Fig. 11d). We suggest that theflow may experience hydraulic jumps in the upper part of the delta, i.e. in the topset and/or upper foreset, that deposed most of the conglomerates and spreading the sand through the bottomset area.
5. Discussion
5.1. Comparison with results from previous studies
A comparison between previous studies (Rohais et al., 2008; Gobo et al., 2014) and the present study summarizes the line drawings on the Ilias GTD (Fig. 12). In order to compare the studies, we refer to the ratio between accommodation (A) and sediment supply (S). The prograda-tional trend (with A/S < 1, i.e. stratigraphic base level fall) is linked with the record of either a relative water level (RWL) drop or an in-crease in sediment supply while the retrograding system (A/S > 1, i.e. stratigraphic base level rise) is linked either with a RWL increase or with a decrease in sediment supply.
Between our lines 1 to 14, the stratigraphic model established by
Rohais et al. (2008)proposed an interpretation in one trend: ST1 is a progradational trend, corresponding to the Bot1 facies association presented in our study. ST1 is characterized by the lack of topset beds, which have been eroded, the presence of bypass surfaces and the rapid progradation of the GTD (Rohais et al., 2008). The Bot2 facies asso-ciation has no equivalence and is merged in between the erosional lines 13 and 14 (this study) in the surface 6 presented byRohais et al. (2008). By comparing the sedimentological sections ofGobo et al. (2014), our section and the line correlations (Fig. 12), the facies association debrite dominated assemblage (DFA) and turbidite dominated assemblage (TFA) respectively correspond to Bot1a and Bot1b facies associations (described in4.3.1) under the line 13. We do not interpret DFA as a debris-flow deposit in the bottomset as proposed byGobo et al. (2014)
because we document low relief channel beds generated by upstream stationary hydraulic jump in the toeset.Gobo et al. (2014)proposed a DFA in the bottomset during the drop in the relative water level and a TFA during the rise in the relative water level with a coeval reciprocity in the foresets. They correlated their observations with an autocyclic process between the foreset and bottomset and an allocyclic process for the dominant facies assemblage in the delta.Gobo et al. (2014) inter-preted the TFA and DFA deposits as due to short-term variations in the relative water level. Nevertheless, the photogrammetric data (Fig. 7) and correlation panel resulting from our study (Fig. 8) do not support the correlation lines proposed byGobo et al. (2014). For example, the TFA has not been observed in the foresets underlying the line 13 (Fig. 8). So, the coeval reciprocity between foreset-bottomset beds could be challenged.
Above our line 14, we agree with previously published descriptions for Bot3, with on one hand the massive sandy turbidite ofRohais et al. (2008), and on the other the TFA with no coeval reciprocity in the foreset of Gobo et al. (2014)(Fig. 12). However, the interpretations proposed by these authors were completely opposite: 1)Rohais et al. (2008)interpreted these beds as a retrograding trend with a landward shift in the position of the offlap break; and 2) Gobo et al. (2014), proposed that the TFA prevailed during base level fall. We do not agree with the deposition of the TFA during base level fall (Gobo et al., 2014) because it is contradictory with the aggrading, onlapping and back-stepping trends of these deposits. Moreover, the facies and related processes encompassed in the Bot3 facies association also indicate that the incomingflow was already turbulent in the upper part of the former foreset, suggesting that the former topset wasflooded.
5.2. Autocyclic behaviour
The clinoform morphologies and growth pattern under conditions of high sediment supply and/or lateral confinement and over steep basin slopes had been modelled by Gerber et al. (2008) with numerical models,flume approaches and outcrop comparison. These authors fixed constant parameters such as theflow discharge (which is already tur-bulent), grain size and water level and obtained an autogenic cycle growth pattern. Gerber et al. (2008) documented a unique style of progradation driven by autogenic cycles of slope steepening. Then, the sediments bypassed the slope and deposited a sediment lobe basinward. Continued deposition caused the lobe to backstep up the slope building a lower-slope foreset and eventually reinitiating the cycle.
This model is in line with the outcrop observations: 1) the increase in the angle of the foreset beds just prior to the deposition of Bot3 facies association, 2) the major erosional surface 3) the lack of foreset deposits during the Bot3 stage, 4) the lobe-slope apron geometry of Bot3, and 5) the retrograding trend of the Bot3 deposit.
Moreover, this model is also coherent with the alternative ex-planation for the genesis of the DWMS by the High Density Turbidites (HDT) put forth byStow and Johansson (2000). Indeed, DWMS were interpreted to be deposited by continuous aggradation/collapse/fall-out from a HDT that experiences a hydraulic jump.
The Bot3 deposits could therefore be interpreted as resulting from an autocyclic clinoform process produced by turbulentflow. It implies that the entire former topset was sufficiently flooded to experience turbulentflow, or at least flow characterized by hydraulic jump dy-namic (Fig. 11).Dalla Valle et al. (2013)developed a similar model and interpreted the DWMS clinoform deposit as the mouth of slope-confined gullies which corresponds with their type 1 slope-confined gullies. However, this model does not explain the presence of the Bot1 and Bot2 facies associations and the relationship between these three types of bottomset deposits as illustrated inFig. 11.
5.3. Stratigraphic model
The stratigraphic architecture is the result of the interplay between accommodation, i.e. relative sea or lake level and tectonic vertical offset, and sediment supply. In this study, we consider the A/S ratio variations as the dominant factor controlling the stratigraphic archi-tecture and we can refer to the terminology given byCatuneanu et al. (2009) for the sequence stratigraphy. We could thus propose a re-lationship between the four stages of bottomset dynamic identified in this study and the stratigraphic architecture of the related Gilbert-type delta.
5.3.1. Bot 1: sandy-gravelly bottomset stratigraphic stage
Bot1 typology of bottomset is characterized by a low relief channel-levee architecture generated by a stationary hydraulic jump in the toeset area (Toe1) linked with active foreset, i.e. For1a or For2 facies association (Fig. 11a). This building stage for both the delta foreset and bottomset could be related to an increase in sediment supply and/or a diminution of the accommodation. The preservation of the toeset and bottomset area needs an aggradation trend which is supported by the aggrado-progradation of the corresponding foreset beds (Fig. 13a). Then, the progradation rate increase with time and the aggradation rate decrease with time. This deltaic dynamic could correspond to the highstand normal regression, sensuCatuneanu et al. (2009).
5.3.2. Ero 1: major erosional stratigraphic stage
The foreset beds are affected by deep scouring and these depressions arefilled by cyclic step beds. Both the erosions and the deposits are generated by the hydraulic jumps migrating upslope (For2 facies as-sociation). The foreset slope increased and a major erosional surface (line 13) highlights the end of the cycle (Figs. 7, 8andFig. 7). This delta architecture with steep foreset and major erosion/bypass are
interpreted as the maximum of progradation in the delta evolution (Fig. 13b). This delta dynamic is interpreted as an important decrease in accommodation and a major increase in sediment supply. Moreover, such evidence of a hydraulic jump upstream from the slope break has been highlighted by modelling studies (Kostic and Parker, 2006), ex-perimental (Garcia and Parker, 1989; Cartigny et al., 2014),field works (Russell and Arnott, 2003; Postma et al., 2014; Dietrich et al., 2016) and in situ delta monitoring (Clarke et al., 2012; Clarke, 2016). This suggests that the sediments were exported to the foreset by a long-lasting (Dalla Valle et al., 2013) and very thick critical densityflow probably related to hyperpycnal conditions (Mulder and Syvitski, 1995; Piper and Normark, 2009) or related to river dischargeflowing near the bottom without water density control (Clarke, 2016). It could be related
to a major bypass and/or erosion dynamic in the delta topset. This phase could correspond to the forced regression, sensuCatuneanu et al. (2009).
5.3.3. Bot 2:fine-grained bottomset stratigraphic stage
The bottomset only records shale to silt-size sediments respectively deposited by decantation or low energetic turbidity currents. Bot2 fa-cies association overlies the previous erosional surface and present a lenticular geometry. Thin-bedded andfine-grained deposits are inter-preted as witnesses of a sharp decrease of sediment supply and/or an increase of accommodation. The active deltaic system is consequently located upstream so the major part of the sediment is stored in the topset and foreset (Fig. 13c). The aggradation rate increases with time
Fig. 13. Ideal stratigraphic cross-section model step by step: a: Highstand normal regression, Bot1 deposition under subcriticalflow conditions with a flat braided channel architecture; b: Forced regression, Ero 1 stage, the foresets are steepening and eroded, the erosion exported massive sediment to the basin; c: Lowstand normal regression, Bot2 deposition by low-density turbidity currents, the coarse-grained sediments are stored in the topset and foreset but the bottomset isfine-grained; d: Transgressive stage, Bot3, deposition of DWMS with a slope apron geometry; e: Completed stratigraphic model showing thefinal architecture of the delta.
and the progradation rate decreases with time (Catuneanu et al., 2009). This delta dynamic can be interpreted as the lowstand normal regres-sion, sensuCatuneanu et al. (2009).
5.3.4. Bot3: massive sandy bottomset stratigraphic stage
The overall architecture of the bot3 typology presents onlaps on the foreset beds, i.e. a retrograding trend as proposed by Rohais et al. (2008). The onlaps and the retrograding trend imply a A/S > 1, and therefore a decrease in sediment supply and/or an increase in accom-modation. But the massive sandy bottomset with coarse-grained sedi-ments and thick beds document a high rate of sediment supply. In consequence, Bot3 dynamic results of a high sediment supply linked with a higher accommodation rate (A/S > > 1). This delta dynamic can be interpreted as the transgressive stage with high sediment supply, sensuCatuneanu et al. (2009).
Conventional sequence-stratigraphic concepts assume that the de-livery of sand to the deep water domain occurs primarily during the relative sea level fall and lowstand deposits (Posamentier and Vail, 1988; Johannessen and Steel, 2005; Helland-Hansen and Hampson, 2009; Gobo et al., 2014). The basinward transport is associated with a shelf-edge incision and sediment bypass (Van Wagonier et al., 1988; Johannessen and Steel, 2005). Nevertheless, significant sand volumes can also be transported to the deep water domain during the relative sea level rise and highstand deposits (rewied by Dalla Valle et al., 2013). This has already been postulated byBurgess and Hovius (1998)
and documented by other authors (Meckel and Galloway, 1996; Dixon et al., 2012; Carvajal and Steel, 2006). Coarse-grained outer-shelf sand ridges developed during highstand periods with formation of clino-forms have been observed in the Pescara Basin and Central Adriatic Basin (Dalla Valle et al., 2013), in the Gulf of Lion (Berne et al., 1998; Bassetti et al., 2006), Gulf of Cadiz (Lobo et al., 2005), Ebro continental margin (Lo Iacono et al., 2010) and northern Adriatic Sea (Storms et al., 2008).
6. Conclusions and perspectives
The Ilias Gilbert-type bottomsets record four key successive stages of evolution with distinctive sedimentary processes and related de-positional profiles (Fig. 13e). Each typology has specific characteristics: facies, facies association, internal architecture, geometry and deposi-tional processes. Sandy-gravelly bottomset (Bot1), erosional-bypass bottomset (Ero1), fine-grained bottomset (Bot2) and massive sandy bottomset (Bot3) typologies have been integrated for the first time within a stratigraphic framework.
This study provides key elements to recognize the specific facies and architectures of the different bottomset typologies. The sedimentary model enhances the process formation knowledge, with a focus on the hydraulic jump behaviour. To establish the sequence stratigraphy, au-tocyclic processes and the resulting architecture have been identified to recognize the allocyclic parameters. The allocyclic parameters have been handled by the ratio between accommodation (A) and sediment supply (S). This approach allows to propose an original sequence stra-tigraphy model for Gilbert-type delta bottomset and a guideline for quantifying the amount of sediments exported basinward.
The gravelly bottomset Bot1, is interpreted to occur primarily during the highstand normal regression of the Gilbert-type delta. The flow erodes the steep foreset with deep scours and fills them with re-worked sediments; they then form cyclic steps and anti-dune deposits. These features are characteristic of a critical-flow that experiences a hydraulic jump. The principal flow creates a confined channel and develops an active foreset probably due to hyperpycnal conditions. Laterally, decantation processes control the shale deposition in the in-active part of the foreset.
When arriving in the toeset, theflow experiences a stationary hy-draulic jump, deposits thick cyclic step beds at the slope break, and the subcritical flow bypasses and reworks the bottomset. In the toeset,
retrogressive erosion due to the hydraulic jump may have induced a slump and slide from the proximal foreset beds. The bottomset is formed of the Bot1 facies association with aflat and low relief braided channel-levee geometry and a backstepping chute-and-pool bedform. The bottomset is characterized by starved current ripples, erosion sur-faces, veneering, floating clasts, bi-modal grain-size distribution and general backset geometries.
Secondly, the forced regression stage is marked by steeper foresets than during the previous stage and by erosional surfaces instead of bottomset deposits. The upstream topset and foreset are then eroded and the sediments are mainly exported to the basin. In the bottomset, this stage is recorded with a major erosional surface (Ero1). Additional studies on the related turbiditic system should be carried out to support and update the timing for maximum sediment delivery into the deep basin.
Thirdly, during the lowstand normal regression, a starved bottomset (Bot2) is deposited onto the erosional surface. This bottomset contains very fine-grained sediments, the coarse-grained deposits being pri-marily stored upstream in the delta topset and foreset.
Fourthly, the Bot3 develops during the transgressive to highstand stage of the Gilbert-type delta evolution. On theflooded former topset, the incomingflow is already turbulent and then erodes the foreset. Bot3 is very poorly sorted, sub-horizontal and onlaps onto the foreset beds. Bot3 beds form a slope apron in the delta foot. The major part of the coarse-grained sediments is stored in the bottomset area and is inter-preted as having been generated by high-density turbidity currents.
These sedimentary and stratigraphic models improve the prediction for the sand distribution and the connectivity between the various parts of the delta in clastic depositional systems with a high-sediment dis-charge and a high accommodation rate.
Acknowledgements
This research is funded by Engie and managed by the CNRS and Engie. We thank Remi Dreux, Bertrand Coureaud and Julien Schmitz for the drone acquisition and modelling processing. We would like to thank the Exploration and Production Engie team and Céline Ducassou for their help and constructive remarks. Anonymous reviewers and Dr. David J.W. Piper greatly improved the quality of the manuscript. References
Bassetti, M.A., Jouet, G., Dufois, F., Berné, S., Rabineau, M., Taviani, M., 2006. Sand bodies at the shelf edge in the Gulf of Lions (Western Mediterranean): deglacial history and modern processes. Mar. Geol. 234 (1–4), 93–109.
Beaubouef, R., Rossen, C., Zelt, F., Sullivan, M., Mohrig, D., Jennette, D., 1999. Deep-water sandstones, Brushy canyon formation, West Texas. In: Continuing Education Course Notes. American Association of Petroleum Geologists, pp. 1–50.
Berne, S., Lericolais, G., Marsset, T., Bourillet, J.F., De Batist, M., 1998. Erosional offshore sand ridges and lowstand shorefaces; examples from tide- and wave-dominated en-vironments of France. J. Sediment. Res. 68 (4), 540–555.
Billiris, H., Paradissis, D., Veis, G., England, P., Featherstone, W., Parsons, B., Cross, P., Rands, P., Rayson, M., Sellers, P., Ashkenazi, V., Davison, M., Jackson, J., Ambraseys, N., mar 1991. Geodetic determination of tectonic deformation in central Greece from 1900 to 1988. Nature 350 (6314), 124–129.http://www.nature.com/doifinder/10. 1038/350124a0.
Bornhold, D., Prior, D., 1988. Submarine morphology and processes of fjord fan deltas and related high-gradient systems: modern examples from British Columbia. In: Nemec, W., Steel, R. (Eds.), Fan Deltas: Sedimentology and Tectonic Settings. Blackie, London, pp. 125–143.
Breda, A., Mellere, D., Massari, F., aug 2007. Facies and processes in a gilbert-delta-filled incised valley (Pliocene of Ventimiglia, NW Italy). Sediment. Geol. 200 (1–2), 31–55.
http://www.sciencedirect.com/science/article/pii/S0037073807000796. Briole, P., Rigo, A., Lyon-Caen, H., Ruegg, J.C., Papazissi, K., Mitsakaki, C., Balodimou,
A., Veis, G., Hatzfeld, D., Deschamps, A., 2000. Active deformation of the Corinth Rift, Greece: results from repeated global positioning system surveys between 1990 and 1995. J. Geophys. Res. 105 (B11), 25605.http://doi.wiley.com/10.1029/ 2000JB900148.
Burgess, P.M., Hovius, N., 1998. Rates of delta progradation during highstands: con-sequences for timing of deposition in deep-marine systems. J. Geol. Soc. 155 (2), 217–222.
Cartigny, M.J.B., Ventra, D., Postma, G., van Den Berg, J.H., 2014. Morphodynamics and sedimentary structures of bedforms under supercritical-flow conditions: new insights