HAL Id: hal-00299367
https://hal.archives-ouvertes.fr/hal-00299367
Submitted on 25 Sep 2006
HAL is a multi-disciplinary open access
archive for the deposit and dissemination of
sci-entific research documents, whether they are
pub-lished or not. The documents may come from
teaching and research institutions in France or
abroad, or from public or private research centers.
L’archive ouverte pluridisciplinaire HAL, est
destinée au dépôt et à la diffusion de documents
scientifiques de niveau recherche, publiés ou non,
émanant des établissements d’enseignement et de
recherche français ou étrangers, des laboratoires
publics ou privés.
Modification of the low-latitude ionosphere before the
26 December 2004 Indonesian earthquake
I. E. Zakharenkova, A. Krankowski, I. I. Shagimuratov
To cite this version:
I. E. Zakharenkova, A. Krankowski, I. I. Shagimuratov. Modification of the low-latitude ionosphere
before the 26 December 2004 Indonesian earthquake. Natural Hazards and Earth System Science,
Copernicus Publications on behalf of the European Geosciences Union, 2006, 6 (5), pp.817-823.
�hal-00299367�
© Author(s) 2006. This work is licensed under a Creative Commons License.
and Earth
System Sciences
Modification of the low-latitude ionosphere before the 26 December
2004 Indonesian earthquake
I. E. Zakharenkova1, A. Krankowski2, and I. I. Shagimuratov1
1West Department of IZMIRAN, Kaliningrad, Russia
2Institute of Geodesy, University of Warmia and Mazury, Olsztyn, Poland
Received: 17 July 2006 – Revised: 5 September 2006 – Accepted: 5 September 2006 – Published: 25 September 2006
Abstract. This paper investigates the features of
pre-earthquake ionospheric anomalies in the total electron con-tent (TEC) data obtained on the basis of regular GPS obser-vations from the IGS network. For the analysis of the iono-spheric effects of the 26 December 2004 Indonesian earth-quake, global TEC maps were used. The possible influence of the earthquake preparation processes on the main low-latitude ionosphere peculiarity – the equatorial anomaly – is discussed. Analysis of the TEC maps has shown that modifi-cation of the equatorial anomaly occurred a few days before the earthquake. For 2 days prior to the event, a positive ef-fect was observed in the daytime amplification of the equa-torial anomaly. Maximal enhancement in the crests reached 20 TECU (50–60%) relative to the non-disturbed state. In previous days, during the evening and night hours (local time), a specific transformation of the TEC distribution had taken place. This modification took the shape of a double-crest structure with a trough near the epicenter, though usu-ally in this time the restored normal latitudinal distribution with a maximum near the magnetic equator is observed. It is assumed that anomalous electric field generated in the earth-quake preparation zone could cause a near-natural “fountain-effect” phenomenon and might be a possible cause of the ob-served ionospheric anomaly.
1 Introduction
The problem of earthquake forecasting is one of the ma-jor unsolved tasks of modern geophysics. Due to the last year’s events, the development and improvement of forecast methods have taken on added urgency. To this end, inten-sive research in the field of using seismo-ionospheric effects, together with traditional methods of geophysical
forecast-Correspondence to: I. E. Zakharenkova
ing, are being conducted into developing various methods of earthquake forecasting.
Since the Alaska earthquake of 28 March 1964 (M=9.2) research into the seismogenic origin of anomalous effects in different ionosphere parameters have been carried out (Davis and Baker, 1965; Datchenko et al., 1972; Larkina et al., 1983; Gokhberg et al., 1983; Liperovsky et al., 1992).
The launch and evolution of the GPS and GLONASS satel-lite navigating systems, along with the creation of special-ized projects investigating earthquake and volcanic eruption effects in the atmosphere and ionosphere and the vigorous development of worldwide and numerous regional networks of satellite signals receivers, have all led to a new stage of research into ionospheric variations observed before and af-ter strong earthquakes. As a result, over the last 10 years many articles have been published dealing with explanations of the physical mechanisms of lithosphere-ionosphere cou-pling, along with descriptions of the main features of seismo-ionospheric phenomena and the first results of a statistical analysis of pre-earthquake effects (Gokhberg et al., 1995; Hayakava, 1999; Hayakava and Molchanov, 2002; Parrot, 1999; Strakhov and Liperovsky, 1999; Pulinets and Bo-yarchuk, 2004).
There has been great interest in research into the influence of electrical fields caused by seismic processes on the equa-torial ionosphere. It is known that the equaequa-torial anomaly reacts sensitively to all changes (of any origin) in electri-cal fields. The equatorial anomaly (the Appleton anomaly) is a regular phenomenon of the ionosphere, with a deep plasma “trough” near the magnetic equator and two maximal (“crests”) displaced ∼20◦–30◦north and south of it.
The equatorial trough in the latitudinal distribution of elec-tron concentration Ne(φ)occurs in the quiet magnetic con-ditions in the early morning hours, reaches its greatest de-velopment in the afternoon and then gradually disappears. Simultaneously with the trough degradation, the anomaly
818 I. E. Zakharenkova et al.: Modification of the ionosphere before Indonesian earthquake 20 21 22 23 24 25 26 27 0 3 6 9 8.3 19.8 26.2 13.5 6.3 21.6 19.8 15.7 20 21 22 23 24 25 26 27 -200 -150 -100 -50 0 50 Ds t, n T 20 21 22 23 24 25 26 27 0 50 100 150 A p i nde x December, 2004 K p i nde x c) b) a) ΣKp EQ
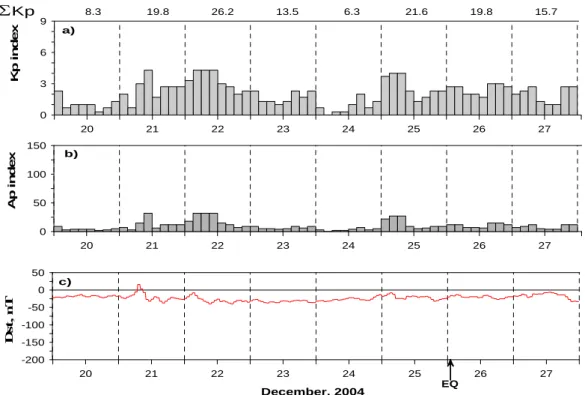
Fig. 1. Geomagnetic conditions on 20–27 December 2004.
the equator and, at night, normal latitudinal distribution with a maximum near the magnetic equator is restored. As a rule, if the anomaly is more strongly expressed, the crests are lo-cated further from the magnetic equator (Hanson and Mof-fett, 1966; Abdu et al., 1981; Fejer et al., 1999; Tsai et al., 2001).
In this paper, the ionosphere variability at low latitudes as-sociated with seismic activity in the Sumatra region on 26 December 2004 has been investigated on the basis of the analysis of the TEC maps created by the GPS-IGS commu-nity.
2 The earthquake description
The devastating earthquake in question occurred on 26 De-cember 2004. It was the fourth largest earthquake in the world since 1900 and was the largest since the 1964 Alaska earthquake. The earthquake and tsunami caused more casu-alties than any other in recorded history.
The event magnitude was 9.0. The epicenter position was located off the west coast of northern Sumatra. The
ge-ographical coordinates of the epicenter were 3.32◦N and
95.86◦E. The first shock (M=9.0) occurred at 00:58 UT and
the series of powerful aftershocks were registered over the next several days. The zone of aftershocks to the December 26 earthquake was over 1300 km long.
3 The geomagnetic conditions
It is necessary to take into account that the detection of seismo-ionospheric effects is complicated in periods of geo-magnetic disturbances, when much stronger variations of the ionospheric parameters “mask” weaker sesmo-ionospheric variations. Figure 1 presents the variations of geomagnetic (Dst) and solar activity indexes (Kp, Ap) in December 2004. The Kp and Ap indexes did not exceed 4, 32, respectively. On the days directly preceding the earthquake, the sum of Kp varied from the minimal value of 6 up to maximal −26. The Dst index shows the presence of a weak ionospheric substorm on 21 December. One can see that the geomagnetic situation was rather quiet on all days prior to the earthquake.
4 Data source
Current GPS techniques are some of the most efficient means of searching for seismo-ionospheric precursors. In recent years, the ionosonde network has been reduced, while in
contrast, the GPS network is being expanded. The GPS
permanent network provides regular monitoring of the iono-sphere on a global scale with high spatial and temporal res-olution of TEC measurements. The data of the ionospheric total electron content (TEC) obtained in the regular GPS ob-servations from the network of IGS stations served as ini-tial data. For the analysis of seismo-ionospheric effects, the global TEC maps in the IONEX format were used. IONEX
50 70 90 110 130 -40 -20 0 20 40 00_00 50 70 90 110 130 -40 -20 0 20 40 02_00 50 70 90 110 130 -40 -20 0 20 40 04_00 50 70 90 110 130 -40 -20 0 20 40 06_00 50 70 90 110 130 -40 -20 0 20 40 08_00 50 70 90 110 130 -40 -20 0 20 40 10_00 50 70 90 110 130 -40 -20 0 20 40 12_00 50 70 90 110 130 -40 -20 0 20 40 14_00 50 70 90 110 130 -40 -20 0 20 40 16_00 50 70 90 110 130 -40 -20 0 20 40 18_00 50 70 90 110 130 -40 -20 0 20 40 20_00 50 70 90 110 130 -40 -20 0 20 40 22_00 50 70 90 110 130 -40 -20 0 20 40 00_00 50 70 90 110 130 -40 -20 0 20 40 02_00 50 70 90 110 130 -40 -20 0 20 40 04_00 50 70 90 110 130 -40 -20 0 20 40 06_00 50 70 90 110 130 -40 -20 0 20 40 08_00 50 70 90 110 130 -40 -20 0 20 40 10_00 50 70 90 110 130 -40 -20 0 20 40 12_00 50 70 90 110 130 -40 -20 0 20 40 14_00 50 70 90 110 130 -40 -20 0 20 40 16_00 50 70 90 110 130 -40 -20 0 20 40 18_00 50 70 90 110 130 -40 -20 0 20 40 20_00 50 70 90 110 130 -40 -20 0 20 40 22_00 26.12.2004 50 70 90 110 130 -40 -20 0 20 40 00_00 50 70 90 110 130 -40 -20 0 20 40 02_00 50 70 90 110 130 -40 -20 0 20 40 04_00 50 70 90 110 130 -40 -20 0 20 40 06_00 50 70 90 110 130 -40 -20 0 20 40 08_00 50 70 90 110 130 -40 -20 0 20 40 10_00 50 70 90 110 130 -40 -20 0 20 40 12_00 50 70 90 110 130 -40 -20 0 20 40 14_00 50 70 90 110 130 -40 -20 0 20 40 16_00 50 70 90 110 130 -40 -20 0 20 40 18_00 50 70 90 110 130 -40 -20 0 20 40 20_00 50 70 90 110 130 -40 -20 0 20 40 22_00 50 70 90 110 130 -40 -20 0 20 40 00_00 50 70 90 110 130 -40 -20 0 20 40 02_00 50 70 90 110 130 -40 -20 0 20 40 04_00 50 70 90 110 130 -40 -20 0 20 40 06_00 50 70 90 110 130 -40 -20 0 20 40 08_00 50 70 90 110 130 -40 -20 0 20 40 10_00 50 70 90 110 130 -40 -20 0 20 40 12_00 50 70 90 110 130 -40 -20 0 20 40 14_00 50 70 90 110 130 -40 -20 0 20 40 16_00 50 70 90 110 130 -40 -20 0 20 40 18_00 50 70 90 110 130 -40 -20 0 20 40 20_00 50 70 90 110 130 -40 -20 0 20 40 22_00 25.12.2004 24.12.2004 20.12.2004 0 5 10 15 20 25 30 35 40 45 50 55 60 65 TECU
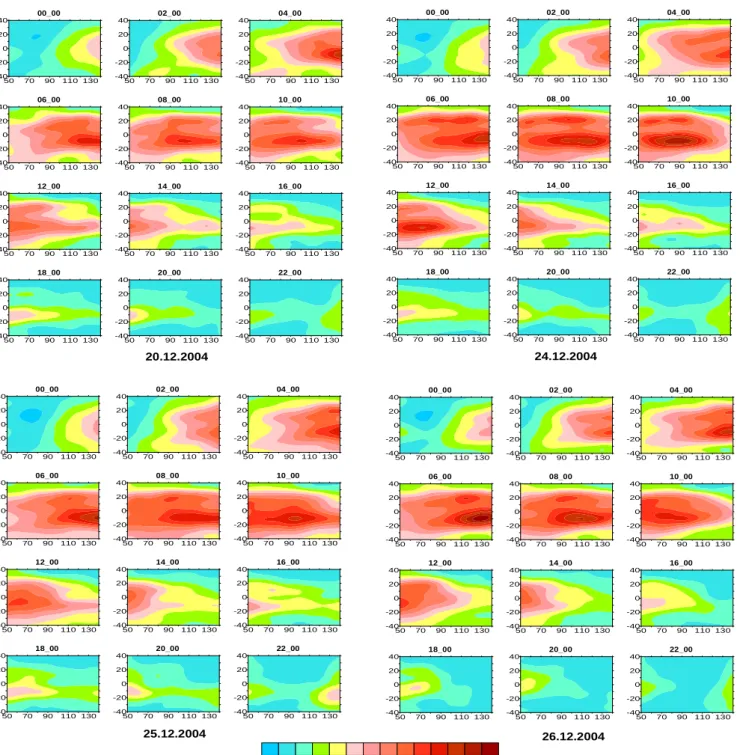
Fig. 2. TEC maps for 20, 24–26 December.
data are accessible at the site: ftp://cddisa.gsfc.nasa.gov/ pub/gps/products/ionex. The global TEC maps are gener-ated routinely by the IGS community with a resolution of 5◦ longitude and 2.5◦ latitude and a time interval of 2 h. The high correlation between the electron density of the F2 layer and the TEC confirms that TEC variations can be used to detect seismo-ionospheric anomalies. The accumulated ho-mogeneous material makes it possible to provide a detailed
study of the TEC behavior in a particular location and also to add algorithms of seismic anomaly detection in the iono-spheric plasma or precursors of seismic activity (Ruzhin et al., 2002; Plotkin, 2003; Pulinets et al., 2005; Zakharenkova et al., 2005, 2006; Krankowski et al., 2006).
820 I. E. Zakharenkova et al.: Modification of the ionosphere before Indonesian earthquake -180 -120 -60 0 60 120 180 -80 -60 -40 -20 0 20 40 60 80 08 UT 23.12.2004 -180 -120 -60 0 60 120 180 -80 -60 -40 -20 0 20 40 60 80 08 UT 20.12.2004 -180 -120 -60 0 60 120 180 -80 -60 -40 -20 0 20 40 60 80 08 UT 24.12.2004 -180 -120 -60 0 60 120 180 -80 -60 -40 -20 0 20 40 60 80 08 UT 25.12.2004 -180 -120 -60 0 60 120 180 -80 -60 -40 -20 0 20 40 60 80 08 UT 26.12.2004 -180 -120 -60 0 60 120 180 -80 -60 -40 -20 0 20 40 60 80 08 UT 27.12.2004 The EQ-day
The quite day
0 5 1015 20 25 30 354045 50 55 6065
TECU
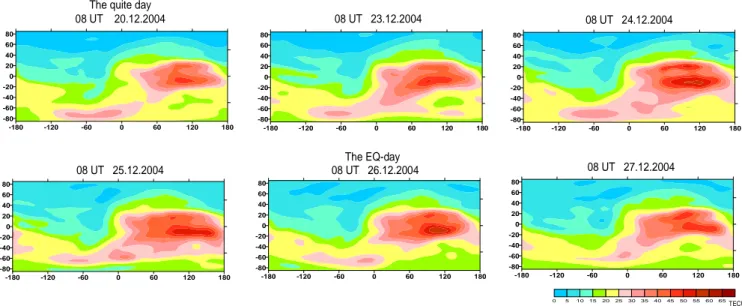
Fig. 3. Global TEC maps for the moment of maximal manifestation of equatorial anomaly for Indonesian region.
5 Results and discussion
According to research into seismo-ionospheric responses arising during the low-latitude earthquake preparation stage, it is known that the modification of the equatorial anomaly associated with seismic activity has various display charac-teristics and is observed from ∼3 days to several hours before the earthquake. These effects are conditionally divided into 3 groups: increasing equatorial anomaly; disappearance of “crests” (the trough filling); disappearance in the form of ab-normal change of the trough and “crests” position (Pulinets and Legen’ka, 2002).
It is known that the equatorial anomaly reacts sensitively to any changes in electrical fields of any origin. In the course of the preparatory stage of the equatorial earthquake, there is a penetration of abnormal electrical fields of seismogenic ori-gin into the ionospheric heights, which strengthens or weak-ens the natural field of equatorial electrojet. It modulates the E×B-drift process and causes the subsequent spatial distri-bution of electron concentration.
If the zero inclination enters the zone of earthquake prepa-ration, the additional upward plasma rejection arises in the sector above the magnetic equator, causing an increase in the maximal values of electron concentration Nerelative to the “crests” of equatorial anomaly and the trough amplification. For detection of seismo-ionospheric variations, the global TEC maps in the IONEX format were used. The day of 20 December was chosen as a control day, as the quietest day in the period previous to this earthquake. For this research, a sufficiently large region was chosen: the latitudes ranged from −40 up to 40 degrees, longitude – from 50 up to 140 de-grees East. Figure 2 shows the spatial-temporal distribution
of TEC (TECU=1016el/m2) for the control day, two days
prior to the earthquake and the day of the earthquake. We can see regular variations connected with the dynamics of equa-torial anomaly over the course of time. In addition, the am-plification of equatorial anomaly with 06:00 up to 12:00 UT is clearly distinct, and corresponds to 13:00–19:00 h of local time (LT=UT+7).
To consider the spatial sizes and amplitudes of the Ap-pleton anomaly, the global TEC maps for the moment of maximal manifestation of the equatorial anomaly for the In-donesian region are given in Fig. 3. It is clear that on the days prior to the earthquake, abnormal TEC behavior was observed. The spatial expansion of the equatorial anomaly, as well as significant enhancement of electron concentration at the equatorial anomaly crests was registered. The maximal increase reached the value of 20 TECU or 50–60% relative to the non-disturbed level on 24 December.
For more detailed clarification of the equatorial anomaly
dynamics, the meridian sections (λ=95◦E) of TEC spatial
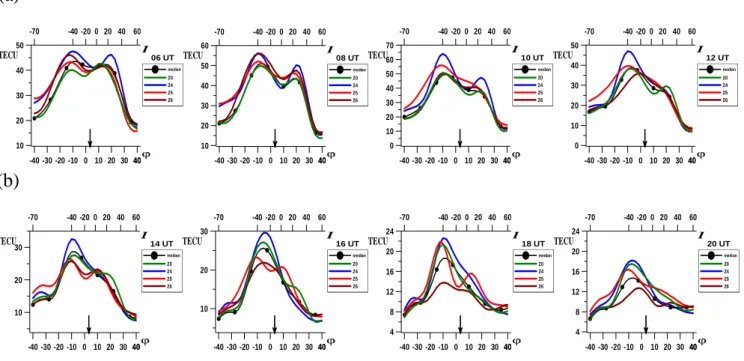
structure were constructed (Fig. 4) and the afternoon hours (13:00–19:00 LT) are included. Geographical latitudes are given on the bottom axis and the top axis shows the mag-netic inclination I. The arrow points to the latitude of the epi-center position. The average, calculated for the period from 10 December to 20 December, is denoted by a black line; the green line reflects TEC variation for the control day (20 December). For 25 December (the red line) the increase in TEC values with displacement of maximal significance to the southern direction is observed. For 24 December (the dark blue line), a clear TEC increase is observed and for 10:00 UT (17:00 LT) there is the northern “crest” in the section struc-ture.
(a)
-40 -30 -20 -10 0 10 20 30 4040 10 20 30 40 50 -70 -40 -20 0 20 40 60 median 20 24 25 26 06 UT I ϕ TECU -40 -30 -20 -10 0 10 20 30 4040 10 20 30 40 50 60 -70 -40 -20 0 20 40 60 median 20 24 25 26 08 UT I ϕ TECU -40 -30 -20 -10 0 10 20 30 4040 0 10 20 30 40 50 60 70 -70 -40 -20 0 20 40 60 median 20 24 25 26 10 UT I ϕ TECU -40 -30 -20 -10 0 10 20 30 4040 0 10 20 30 40 50 -70 -40 -20 0 20 40 60 median 20 24 25 26 12 UT I ϕ TECU(b)
-40 -30 -20 -10 0 10 20 30 4040 10 20 30 -70 -40 -20 0 20 40 60 median 20 24 25 26 14 UT I ϕ TECU -40 -30 -20 -10 0 10 20 30 4040 10 20 30 -70 -40 -20 0 20 40 60 median 20 24 25 26 16 UT I ϕ TECU -40 -30 -20 -10 0 10 20 30 4040 4 8 12 16 20 24 -70 -40 -20 0 20 40 60 median 20 24 25 26 18 UT I ϕ TECU -40 -30 -20 -10 0 10 20 30 4040 4 8 12 16 20 24 -70 -40 -20 0 20 40 60 median 20 24 25 26 20 UT I ϕ TECUFig. 4. The meridian sections (λ=95◦E) of the TEC spatial structure. On the bottom axis there are geographical latitudes. On the top axis
the magnetic inclination I is shown. The arrow points to the latitude of epicentre position.
Similar sections for the appropriate evening and night hours (21:00–03:00 LT) are shown in the second part of Fig. 4. The increase of TEC variation for 24 December (dark blue line) is still marked. On the day prior to the earthquake, the abnormal transformation of the section of TEC values (red line) is fixed and differs essentially from the images of the average line and the control day line. The given variation represents the occurrence of precisely expressed “double-crests” and a small trough. The trough (minimum) is situated directly above the epicenter area.
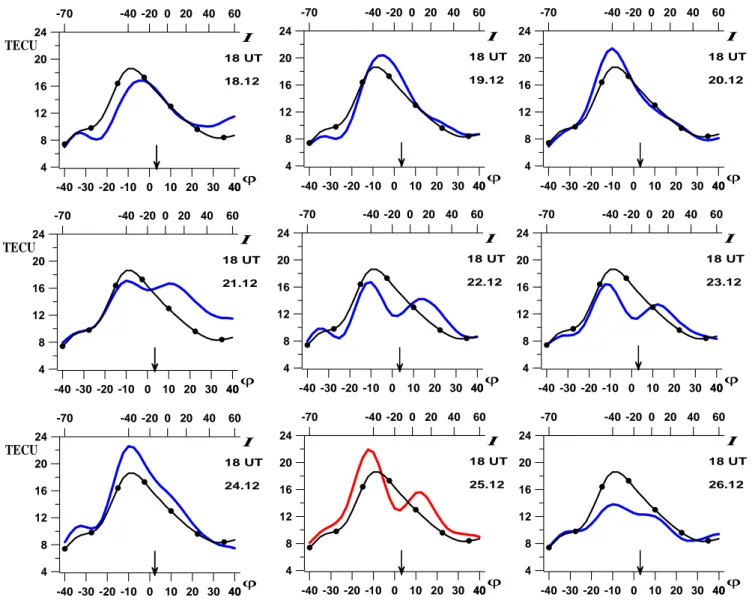
For a more visual demonstration of this phenomenon, sep-arate diagrams for the period of 18–26 December were an-alyzed. Figure 5 presents the meridian sections for the mo-ment of the anomaly maximum manifestation – 18:00 UT corresponds to the 01:00 LT. The comparison of the current day values (color lines) and average meaning (black line) shows that during 18–20 December there are some differ-ences, but the curve shapes are rather similar. However, after 21 December we can see the formation of a double-crest curve with a trough near the epicenter. It was observed each day prior to the earthquake, except the day of 24 De-cember when a day-long enhancement of electron concen-tration was registered. One can see the most well-defined effect on 25 December, a few hours prior to the earthquake itself. In addition, this anomaly was observable for several days about 18:00 UT (01:00 LT) and other evening and night hours (21:00–03:00 LT) when it was registered only once, on 25 December.
Recently, Liu et al. (2001) studied the ionospheric varia-tions observed prior to the Chi-Chi earthquake. For this pur-pose, the Chung-Li ionosonde measurements, as well as the TEC data of the network of 13 GPS receivers were used. The earthquake epicenter position was located in the area of the northern crest of the equatorial anomaly. Thus, the crest dis-placement caused considerable modification of the diurnal TEC variations over the GPS station. In this case, the results showed that the equatorial anomaly crest moved towards the equator and f0F2 as well as the TEC value significantly
de-creased 1, 3 and 4 days before the earthquake. It was sug-gested that the upward electric field near the epicenter and/or the equator-ward neutral wind in the ionosphere stimulated the equator-ward motions and significant TEC decreases in the equatorial anomaly crest.
In the current case, the earthquake epicenter position was located in the area of the anomaly trough between crests. It was assumed that the largest influence would be found in the region nearest to the epicenter close to the magnetic equator. Depueva and Ruzhin (1993) have used the Alouette data to investigate the possible anomalous influence of earth-quake preparation processes with the epicenter located near the magnetic equator on the F2 layer latitudinal distribution. It was found that approximately one day before the
earth-quake, the dependence f0F2(I) took the shape of a
double-crest curve with a trough near the epicenter. This modifica-tion was registered during the evening and night hours (LT), though a similar ionospheric structure (certainly, with greater amplitude) can be observed only in the daytime.
822 I. E. Zakharenkova et al.: Modification of the ionosphere before Indonesian earthquake -40 -30 -20 -10 0 10 20 30 4040 4 8 12 16 20 24 -70 -40 -20 0 20 40 60 18 UT 18.12 I ϕ TECU -40 -30 -20 -10 0 10 20 30 4040 4 8 12 16 20 24 -70 -40 -20 0 20 40 60 18 UT 19.12 I ϕ -40 -30 -20 -10 0 10 20 30 4040 4 8 12 16 20 24 -70 -40 -20 0 20 40 60 18 UT 20.12 I ϕ -40 -30 -20 -10 0 10 20 30 4040 4 8 12 16 20 24 -70 -40 -20 0 20 40 60 18 UT 21.12 I ϕ TECU -40 -30 -20 -10 0 10 20 30 4040 4 8 12 16 20 24 -70 -40 -20 0 20 40 60 18 UT 22.12 I ϕ -40 -30 -20 -10 0 10 20 30 4040 4 8 12 16 20 24 -70 -40 -20 0 20 40 60 18 UT 23.12 I ϕ -40 -30 -20 -10 0 10 20 30 4040 4 8 12 16 20 24 -70 -40 -20 0 20 40 60 18 UT 24.12 I ϕ TECU -40 -30 -20 -10 0 10 20 30 4040 4 8 12 16 20 24 -70 -40 -20 0 20 40 60 18 UT 25.12 I ϕ -40 -30 -20 -10 0 10 20 30 4040 4 8 12 16 20 24 -70 -40 -20 0 20 40 60 18 UT 26.12 I ϕ
Fig. 5. The meridian sections (λ=95◦E) of the TEC spatial structure during 18–26 December (black line – median value calculated for 10–20
December). On the bottom axis there are geographical latitudes. On the top axis the magnetic inclination I is shown. The arrow points to the latitude of epicentre position.
Hence, the modification of the equatorial anomaly associ-ated with Indonesian earthquake had various characteristics and was observed from ∼3–4 days to several hours leading up to the initial shock. At the final stage of the Sumatra earthquake preparation, 2 modifications to the TEC distri-bution were found. For 2 days prior to the event, a positive effect was observed as a daytime amplification of the equa-torial anomaly. Maximal enhancement in the crests reached 20 TECU (50–60%) relative to the non-disturbed state. Over the previous days, in the evening and night hours (local time), a specific transformation of the TEC distribution had taken place. The structure, an anomaly with two crests and a trough, was observed, though at this time the equatorial anomaly usually disappeared.
6 Conclusions
The TEC map analysis has shown that modification of the equatorial anomaly occurred a few days prior to the earth-quake. The daytime amplification of the Appleton anomaly was registered during several days prior to the main event. A spatial size increase and maximal values enhancement also took place 2 days before, and the ratio of crests and trough electron concentration was more pronounced than for other days of the discussed period. In addition, according to the ionosphere total electron content data, it was found that in the days prior to the earthquake, the meridian section of TEC spatial structure took the shape of a double-crest curve with a trough near the epicenter. The effect was most pronounced in the evening and night hours (local time) on 25 December, though usually at this time the restored normal latitudinal
distribution with a maximum near the magnetic equator is observed. It is assumed that an anomalous electrical field generated near the epicenter during the earthquake prepara-tion stage could have caused a near-natural “fountain-effect” phenomenon and might be a possible cause of the observed ionospheric anomaly. Thus, the seismo-ionospheric effect occurred as a specific modification of the equatorial anomaly. It is believed that further analysis of this problem will lead to improved short-term earthquake prediction abilities in seismo-active regions.
Acknowledgements. The authors are grateful to the IGS commu-nity for providing GPS permanent data and to USGS Earthquake Hazards Program for detailed earthquake information.
Edited by: P. F. Biagi Reviewed by: two referees
References
Abdu, M. A., Bittencourt, J. A., and Batista, I. S.: Magnetic dec-lination control of the equatorial F region dynamo electric field development and spread F, J. Geophys. Res., 86, 11 443–11 446, 1981.
Datchenko, E. A., Ulomov, V. I., and Chernysheva, S. P.: The anomalies of the electron concentration of the ionosphere as a possible precursor of the Tashkent earthquake, Doklady Acad. Sci. Uzb. SSR, 12, 30–34, 1972.
Davies, E. and Baker, D. M.: Ionospheric effects observed around the time of the Alaskan earthquake of March 28 1964, J. Geo-phys.Res., 70(9), 2251–2253, 1965.
Depueva, A. K. and Ruzhin, Y. Y.: The equatorial earthquake preparatory stage as a reason of “fountain-effect” in the iono-sphere, Preprint no. 82(1029), M., IZMIRAN, 1993.
Fejer, B. G., Scherliess, L., and Paula, E. R.: Effects of the vertical plasma drift velocity on the generation and evolution of equato-rial spread F, J. Geophys. Res., 104, 19 859–19 870, 1999. Gokhberg, M. B., Pilipenko, V. A., and Pokhotelov, O. A.: On the
seismic precursors within the ionosphere, Izvestiya Acad. Sci. USSR, Series Physics of the Earth, 10, 17–21, 1983.
Hanson, W. B. and Moffett, R. J.: Ionization transport effects in the equatorial F region, J. Geophys. Res., 71, 5559–5572, 1966. Hayakava, M. (Ed.): Atmospheric and Ionospheric Electromagnetic
Phenomena Associated with Earthquakes, Terra Scientific Pub-lishing Company, Tokyo, Japan, 1999.
Hayakava, M. and Molchanov, O. A. (Eds.): Seismo-Electromagnetics: Lithosphere-Atmosphere-Ionosphere Coupling, Terrapub, Tokyo, Japan, 2002.
Krankowski, A., Zakharenkova, I. E., and Shagimuratov, I. I.: Re-sponse of the ionosphere to the Baltic Sea earthquake of 21 September 2004, Acta Geophys., 54, 90–101, 2006.
Larkina, V. I., Nalivayko, A. V., Gershenzon, N. I., Gokhberg, M. B., Liperovskiy, V. A., and Shalimov, S. L.: Observation of VLF emission related with seismic activity on the Intercosmos-19 satellite, Geomagn. Aeron., 23, 684–687, Intercosmos-1983.
Liperovsky, V. A., Pokhotelov, O. A., and Shalimov, S. L.: Iono-spheric precursors of earthquakes, Miesdunarodnaya Nauka, Moscow, 304 pp. (in Russian), 1992.
Liu, J. Y., Chen, Y. I., Chuo, Y. J., and Tsai, H. F.: Variations of ionospheric total electron content during the Chi-Chi earthquake, Geophys. Res. Lett., 28(7), 1383–1386. 2001.
Parrot, M.: Statistical Studies with Satellite Observations of Seismogenic Effects, in:Atmospheric and Ionospheric Electro-magnetic Phenomena Associated with Earthquakes, edited by: Hayakava, M., Terra Scientific Publishing Company, Tokyo, Japan, 685–695. 1999.
Plotkin, V. V.: GPS detection of ionospheric perturbation before the 13 February 2001, El Salvador earthquake, Nat. Hazards Earth Syst. Sci., 3, 249–253, 2003,
http://www.nat-hazards-earth-syst-sci.net/3/249/2003/.
Pulinets, S. A. and Legen’ka, A. D.: Dynamics of equatorial iono-sphere during the preparation of strong earthquakes, Geomag. and Aeron. (in Russian), 42(2), 239–244, 2002.
Pulinets, S. A. and Boyarchuk, K.: Ionospheric Precursors of Earth-quakes, Springer, Berlin, Germany, 315 p., 2004.
Pulinets, S. A., Leyva Contreras, A., Bisiacchi-Giraldi, G., and Ciraolo, L.: Total electron content variations in the ionosphere before the Colima, Mexico, earthquake of 21 January 2003, Ge-ofisica International, 44(4), 369–377, 2005.
Ruzhin, Y. Y., Oraevsky, V. N., Shagimuratov, I. I., and Sinelnikov, V. M.: Ionospheric precursors of earthquakes revealed from GPS data and their connection with “sea-land” boundary, Proceed. 16th Wroclaw EMC Symposium, pp. 723–726. 2002.
Strakhov, V. N. and Liperovsky, V. A. (Eds.): Short-Term Forecast of Catastrophic Earthquakes Using Radiophysical Methods (in Russian), Institute of Physics of the Earth, 176 p., Moscow, 1999. Tsai, H. F., Liu, J. Y., Tsai, W. H., and Liu, C. H.: Seasonal varia-tions of the ionospheric total electron content in Asian equatorial anomaly regions, J. Geophys. Res., 106(A12), 30 363–30 369, 2001.
Zakharenkova, I. E., Shagimuratov, I. I., and Lagovsky, A. F.: Iono-sphere modification during the earthquakes preparation on the basis of satellite system GPS measurements, Radiowaves Prop-agation: collected articles of XXI All-Russian scientific confer-ence (in Russian), Ioshkar Ola, 25–27 May 2005, 1, 194–198, 2005.
Zakharenkova, I. E., Shagimuratov, I. I., Lagovsky, A. F., and Krankowski, A.: The ionospheric precursors research for the earthquakes of M∼5.0 class, Electronic journal “Investigated in Russia”, 39, pp. 361–371, http://zhurnal.ape.relarn.ru/articles/ 2006/039.pdf (in Russian), 2006.