HAL Id: hal-01828542
https://hal.archives-ouvertes.fr/hal-01828542
Submitted on 3 Jul 2018HAL is a multi-disciplinary open access archive for the deposit and dissemination of sci-entific research documents, whether they are pub-lished or not. The documents may come from teaching and research institutions in France or abroad, or from public or private research centers.
L’archive ouverte pluridisciplinaire HAL, est destinée au dépôt et à la diffusion de documents scientifiques de niveau recherche, publiés ou non, émanant des établissements d’enseignement et de recherche français ou étrangers, des laboratoires publics ou privés.
Effect of pressure and temperature on viscosity of a
borosilicate glass
Linfeng Ding, Manuel Thieme, Sylvie Demouchy, Clemens Kunisch, Boris
Kaus
To cite this version:
Linfeng Ding, Manuel Thieme, Sylvie Demouchy, Clemens Kunisch, Boris Kaus. Effect of pressure and temperature on viscosity of a borosilicate glass. Journal of the American Ceramic Society, Wiley, 2018, 101 (9), pp.3936 - 3946. �10.1111/jace.15588�. �hal-01828542�
Effect of pressure and temperature on viscosity
of a borosilicate glass
Linfeng Ding1*, Manuel Thieme2, Sylvie Demouchy2, Clemens Kunisch3, Boris J.P. Kaus1
1
Institute of Geosciences, Johannes Gutenberg University, 55128 Mainz, Germany
2
Geosciences Montpellier,Université de Montpellier & CNRS, 34095 Montpellier, France
3
Schott AG, Corporate Research & Development, 55122 Mainz, Germany
*Corresponding author: [email protected]
Abstract
During industrial glass production processes, the actual distribution of stress components in the glass during scribing remains, to date, poorly quantified, and thus continues to be challenging to model numerically. In this work, we experimentally quantified the effect of pressure and temperature on the viscosity of SCHOTT N-BK7 glass, by performing in situ deformation experiments at temperatures between
550 and 595 °C and confining pressures between 100 MPa and 300 MPa. Experiments were performed at constant displacement rates to produce almost constant strain rates between 9.70 × 10⁻⁶ s-1 and 4.98 × 10⁻⁵ s-1. The resulting net axial stresses range from 81 MPa to 802 MPa, and the finite strains range from 1.4 % to 8.9 %. The mechanical
results show that the SCHOTT N-BK7 glass is viscoelastic near the glass transition
temperature at 300 MPa of confining pressure. To elucidate the data, we incorporated both 1-element and 2-element generalized Maxwell viscoelastic models in an inversion approach, for which we provide MATLAB scrips. Results show that the 2-element Maxwell model fits the experimental data well. The stress decreases with increasing temperature at 300 MPa and the temperature dependence yields a similar activation energy (601±10 kJ·mol-1 or ∆H/R= 7.2×10⁴ K) to a previously reported value at 1-atm (615 kJ·mol-1 or ∆H/R= 7.4×10⁴ K). The SCHOTT N-BK7 glass shows a limited linear increase of viscosity with increasing pressure of ~0.1 log10(Pa·s)/100 MPa, which is in agreement with the most recent two-internal-parameter relaxation model (based on experiments).
Keywords: Borosilicate glass; high pressure; deformation experiment; viscosity;
1. Introduction
Hardness measurements1, 2 have reported that glass flows viscously at room temperature as well as at high temperature (e.g., up to 630 °C for soda-lime-silica float glass3). Nevertheless, during industrial production processes, scribing with defined tools and breaking are used to separate glass sheets. If scribing velocity or scribing force is not well adjusted, it can lead to poor edge quality with non-desirable cracks at the edges or cracks are not deep enough (or sufficiently well developed) for further breaking.1, 4, 5 The propagation of these cracks, desired or not, depends on the stress state underneath the indenter during scribing.6, 7 The actual distribution of stress components in the glass during scribing remains, to date, poorly quantified, and thus continues to be challenging to model numerically.8, 9 To better quantify the viscous contribution to the deformation 10
underneath an indenter or scribing tool, the effect of pressure on the viscosity of an industrial optical glass, needs to be quantified experimentally by in situ measurements.
The temperature dependence of the viscosity of glasses at ambient pressure has already been studied experimentally leading to numerous temperature-dependent models of viscosity for glasses. Notably, the Vogel-Tammann-Fulcher (VTF) model11 which is similar to the Williams-Landel-Ferry (WLF) model,12 the free-volume model,13, 14, 15
the Adam-Gibbs (AG) model16 and the Mauro-Yue-Ellison-Gupta-Allan(MYEGA) model.17 The VTF model can accurately fit the temperature dependence of viscosity of SCHOTT N-BK7 glass in the range from 1 to 13 log10(Pa·s).
Several experimental studies have quantified the pressure dependence of the viscosity of silicate melts, with a special focus on melts relevant to geological and volcanic systems, such as molten olivine, molten jadeite, dacite and basalt at very high temperatures (> 1700 °C)18, 19, 20, 21 and pressure up to 8 GPa. Different behaviors were observed with increasing pressure as a function of the degree of polymerization.19, 22 The polymerization parameter is best described by the ratio of non-bridging oxygen (NBO) and tetrahedrally coordinated cations (T, e.g., Si4+, Al4+, Ti4+, Fe3+). The ratio of NBO/T can be simply calculated by the ratio of O/T at ambient pressure with satisfying accuracy.19 However, under high pressure, highly polymerized silicate melts (NBO/T<1, e.g., obsidian, basalt, dacite) have a lower tetrahedral connectivity (less oxygen atoms in TO4 will bond to adjacent tetrahedron and thus forming less 3D networks) than at ambient pressure. These highly polymerized silicate melts 19display a viscosity decrease with an increase of pressure. While the viscosity of depolymerized silicate melts (NBO/T≥2, molten peridotite, molten olivine, Al-poor melt), with higher tetrahedral connectivity, show a viscosity increase with increasing pressure.19 For borosilicate glasses, in addition to the NBO/T ratio, the structure is greatly influenced by the BO3/BO4 ratio.23 Indeed, the viscosity model presented by Jantzen24 showed an irregular behavior of viscosity versus NBO in radio-active borosilicate glasses, making the prediction of the pressure effect on borosilicate problematic.
Previous experimental studies on the effect of pressure on viscosity and density of glasses have mostly reported a linear relationship for pressure dependence. For example, the pressure dependence of the viscosity of B2O3, studied by Sperry and Makenzie25 at 380-465 °C and from 0.1 to 30 MPa, demonstrated a linear increase of viscosity with increasing pressure (∆/∆P = 0.28 to 0.59 log10(Pa·s)/100 MPa25). A special parallel-plate viscometer was developed by Schulze et al.,26 using an internally heated pressure vessel (IHPV) to deform the standard melt DDG1, Di100 (Di=CaMgSi2O6) and Ab55Di45 (Ab=NaAlSi3O8) silicate melt. And their results also suggest a linear change with increasing pressure up to 350 MPa (∆/∆P = -0.12 to 0.23 log10(Pa·s)/100 MPa26). Deformation of float glass with high water content27 likewise reported a linear viscosity increase with increasing pressure from 100 MPa to 400 MPa, and a negative correlation with increasing water content (0.03-4.87 wt.%), (∆/∆P < 0.22 log10(Pa·s)/100 MPa27). To date, the latest high-pressure dataset available for SCHOTT N-BK7 is based on
relatively fast-cooled glass under high pressure (0.5 GPa to 1.5 GPa using a piston cylinder). Combined with the post-mortem density and volume recovery measurements,28 which also indicate a linear viscosity increase with increasing pressure (∆/∆P =0.05 log10(Pa·s)/100 MPa28).
Several phenomenological models29, 30, 31, 32 describe the time dependence of glass relaxation as a function of both temperature and pressure history. A recent relaxation model was developed by Ding et al.,28 following the approach of Gupta33 to use two
internal parameters, named fictive temperature34 ( ) and fictive pressure33 ( ). This type of phenomenological models can predict the pressure dependence of the viscosity of glass forming materials through the Maxwell relation:
(1)
where is viscosity, is the Maxwell relaxation time, and is the unrelaxed elastic shear modulus.35 For instance, the two-internal-parameter relaxation model presented by Ding et al.,28 predicts a positive linear dependence of pressure on viscosity for pressures up to 1.5 GPa based on the density and volume recovery measurements. On the other hand, some studies directly express the effect of pressure on the viscosity model. For example, the model proposed by Avramov36 describes the pressure dependence of viscosity by relating the viscosity to the entropy of the glass forming melts, using a master equation . The equation derived by Gupta,37 which follows the Adam-Gibbs model,16
predicting a negative pressure dependence of viscosity.
SCHOTT N-BK7 is available in large formats with high homogeneity. Internally
at SCHOTT, it is used as a reference material. It was already used in several studies,38, 39, 40
,5 but the rheological properties were never quantified experimentally in situ at pressures above 1-atm. To quantify the viscosity of SCHOTT N-BK7glass, compared
to (28) we use a totally different experiment set up by performing in situ deformation experiments in a gas-medium pressure vessel.
2. Experimental method
2.1 Sample description and preparation
The borosilicate glass SCHOTT N-BK7 (chemical composition: 70.0 % SiO2,
11.5 % B2O3, 9.5 % Na2O, 7.5 % K2O and 1.5 % BaO) is an optical glass widely used for lenses and prisms, due to its high homogeneity and high light yield. The density of SCHOTT N-BK7 at room temperature and ambient pressure is 2.508 0.001 g/cm3. The glass transition temperature Tg = 561 °C is defined as the temperature at which the viscosity is 12 log10(Pa·s). Cylinders of SCHOTT N-BK7
with a diameter of 9.95 0.05 mm and a length of 17.00 0.10 mm were drilled from large glass blocks, which had been slowly cooled at a rate of -0.4 °C/h. Both ends of the glass cylinder were mirror polished, and parallelism of both extremities was ensured.
2.2 Deformation experiments
Uniaxial deformation experiments were performed with a high temperature and high pressure in situ deformation gas-medium apparatus also called a Paterson Press.41 The apparatus is used with a routine confining pressure of 300 ± 1 MPa, but the confining pressure can range from 50 to 350 MPa. Using Argon as pressure-medium prevents chemical reactions with the samples. Diffusion experiments at high pressure and high temperature have reported an Argon diffusivity of about -3.3 × 10⁻²⁰ cm2 s-1 at 600 °C in silicate glasses.42 Thus, for the short duration of our experiments (1h), the
incorporation of Argon is considered negligible. The force is measured using an internal load cell (2 kN to 75 kN), resulting in an uncertainty in net axial stress (σload) of less
than 20 MPa. In this study, uniaxial compressive deformation experiments on SCHOTT N-BK7 were performed at constant displacement rates (~1 × 10⁻⁵ to ~5 × 10⁻⁵ mm/s)
resulting in almost constant strain rates.
For the deformation experiment, the glass samples were encapsulated with zirconia and alumina pistons and alumina spacers inside a copper jacket as shown in Fig.1, following well-established experimental protocols.43, 44, 45, 46, 47
Fig. 1 (a) Photograph of the high-pressure assembly for a deformation experiment;
1-Zirconia piston; 2-Alumina piston; 3-Alumina spacers; 4-SCHOTT N-BK7 glass cylinder; 5-Fitted copper jacket; 6-Bottom steel piston; 7-Top steel piston.
A self-made internal furnace is used to anneal the sample at high temperature, with a low thermal gradient (±5 °C) along the sample zone. The thermal gradient is established from separate calibration experiments before deformation experiments. The temperature was increased at a rate of ~15 °C/min to the target temperature and maintained stable for 20 to 30 minutes to insure sufficient relaxation of the glass
structure before applying an axial load to the sample. The temperature was kept constant using a proportional–integral–derivative (PID) controller during the mechanical experiment as a small variation in temperature could result in significant variations of viscosity. A data point is recorded each 1 or 2 s. After the end of the deformation, the piston was maintained in position, and the temperature was decreased at a rate of 70 °C/min by decreasing power. Afterward, the pressure was slowly released at a rate of ~10 MPa/min to ambient pressure.
2.3 Data treatment
The mechanical data must be corrected to account for several experimental approximations adequately. Firstly, the displacement has to be corrected for the elastic distortion48 of the apparatus (stiffness = 82.5 kN/mm). Secondly, to determine the contribution of the copper jacket to the measured force, the power flow law for copper from49 is used. Thirdly, values of stresses and strain rates were corrected for instantaneous changes in the cross-sectional area of the copper jacket and the glass cylinder during deformation assuming that samples maintained a cylindrical shape (i.e., negligible barreling) and constant volume. These corrections of the mechanical data are identical to corrections used in numerous published experimental studies43, 44, 45, 46, 47, 50 on polycrystalline silicates using the same gas-medium deformation apparatus, guaranteeing that this source of uncertainty was properly corrected.
The mean stress (total pressure) on the glass sample during deformation is defined as:
σmean = (σload + 2σAr) / 3 (2)
where σload is the net uniaxial stress51 measured by an internal load cell andσAr is
the confining pressure of Argon.
3. Results
Experimental conditions and measured mechanical data obtained from the in situ deformation experiments are reported in Table 1. Repeating the experiments permits to check the reproducibility of the mechanical results and the number of the repeated experiments at identical experimental conditions are reported in Table 1 and shown in Figure S1 (supplementary material). A few samples showed a variation in diameter along the deformed cylinder post-deformation (i.e., classic barreling), which could indicate that the temperature distribution on the sample is not perfectly homogenous. Or more likely that, the viscous flow continued to occur post-data acquisition and during quenching, when the temperature distribution has become heterogeneous (i.e., the bottom cylinder being hotter than top).
Table 4-1 Experimental conditions for deformation experiments and mechanical results Samples Length [mm] Diameter [mm] Confining Pressure [MPa] Temperature [°C] Displacement Rate [mm/s] Strain Rate [s-1] Finite Strain [%] Axial Stress [MPa] Mean Stress [MPa] Viscosity* Log10[Pa·s] Repeat times
Constant pressure and strain rate, variable temperature
LD6 17.10 9.95 300 550 ± 5 5 × 10⁻⁵ 1.50 × 10⁻⁵ 1.4 802 ± 6 467 ± 7 - 2 LD9 17.07 9.95 303 565 ± 5 5 × 10⁻⁵ 3.89 × 10⁻⁵ 3.9 792 ± 6 466 ± 7 - 1 LD15 17.05 9.95 302 575 ± 5 5 × 10⁻⁵ 4.82 × 10⁻⁵ 6.5 560 ± 6 388 ± 7 12.6 ± 0.2 3 LD17 17.10 9.95 303 585 ± 5 5 × 10⁻⁵ 4.77 × 10⁻⁵ 8.7 219 ± 6 275 ± 7 12.2 ± 0.2 1 LD18 17.10 9.95 300 595 ± 5 5 × 10⁻⁵ 4.98 × 10⁻⁵ 8.4 81 ± 6 227 ± 7 11.7 ± 0.2 2
Constant temperature and strain rate, variable pressure
LD13 17.05 9.95 105 575 ± 5 5 × 10⁻⁵ 4.67 × 10⁻⁵ 5.7 340 ± 6 183 ± 7 12.4 ± 0.2 2 LD16 17.05 9.95 203 575 ± 5 5 × 10⁻⁵ 4.86 × 10⁻⁵ 6.5 430 ± 6 279 ± 7 12.5 ± 0.2 3 LD15 17.05 9.95 302 575 ± 5 5 × 10⁻⁵ 4.82 × 10⁻⁵ 6.5 560 ± 6 388 ± 7 12.6 ± 0.2 3
Constant temperature and pressure, variable strain rate
LD20 17.00 9.95 301 575 ± 5 1 × 10⁻⁵ 9.70 × 10⁻⁶ 7.6 144 ± 6 249 ± 7 12.7 ± 0.2 1 LD19 17.02 9.95 302 575 ± 5 3 × 10⁻⁵ 2.88 × 10⁻⁵ 8.9 235 ± 6 280 ± 7 12.4 ± 0.2 1 LD15 17.05 9.95 302 575 ± 5 5 × 10⁻⁵ 4.82 × 10⁻⁵ 6.5 560 ± 6 388 ± 7 12.6 ± 0.2 3 * Viscosity is calculated according to Eq. 4.1
3.1 Mechanical data
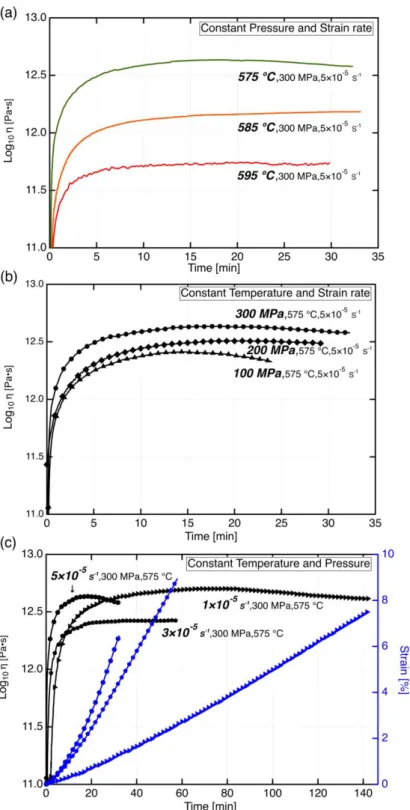
The stress-strain curves for all deformation experiments are shown in Fig. 2. The deformation experiments at constant displacement rates yield strain rates ranging from 9.70 × 10⁻⁶ s-1 to 4.98 × 10⁻⁵ s-1 and finite strains ranging from 1.4 % to 8.9 %. To find the proper temperature and strain rate to study the pressure dependence of the viscosity of our samples, we ran experiments at different temperatures. The temperature dependence is shown in Fig. 2a for experiments performed at a confining pressure of 300 MPa, at a constant displacement rate of ~5 × 10⁻⁵ s−1 and for temperatures from 550 °C up to 595 °C. The glass sample showed an approximately constant stress increase at 550 °C, with the stress-strain curve displaying an almost pure elastic behavior. Between 565 and 575 °C, the samples behave viscoelastic. Steady state (viscous) flow is finally achieved at 595 °C. The stress at 595 °C (81 MPa, sample LD18) is rather low with an applied force of approximately 7 kN.
Fig. 2 Net uniaxial stress versus strain (a) at a constant confining pressure and
constant strain rate for increasing temperatures; (b) at a constant temperature and constant strain rate for increasing confining pressures; (c) at a constant temperature and constant confining pressure for increasing strain rates. For all curves, 1 data point
To determine the pressure dependence, we conducted experiments at a constant temperature of 575 °C, at a constant strain rate of ~5 × 10⁻⁵ s−1 and confining pressures ranging from 100 MPa to 300 MPa as shown in Fig. 2b. The σload increases with
increasing pressure from 340, to 430, and to 560 MPa for a confining pressure of 100, 200 and 300 MPa, respectively (see Table 1). The sample at 100 MPa confining pressure reached steady-state deformation after approximately 4% of strain, which is significantly earlier than for the experiments at 200 MPa and 300 MPa. The stress of the experiment at 100 MPa slightly decreases after reaching steady state, indicating some limited weakening.
To quantify the effect of strain rate, experiments at a constant temperature of 575 °C, a constant pressure of 300 MPa and axial deformation at different strain rates ranging from 9.7 × 10⁻⁶ s−1 to 4.82 × 10⁻⁵ s−1, as shown in Fig. 2c. The maximal stress increases with increasing strain rate. Indeed, the σload increases by ~91 MPa from ~1 ×
10−5 s−1 to ~3 × 10⁻⁵ s−1, while the σload increases by ~325 MPa from ~3 × 10⁻⁵ s−1 to ~5
× 10−5 s−1 (Fig. 2c).
3.2 Maxwell model
We use both a single Maxwell and a two-Maxwell viscoelastic model to fit the experimental data combined with an optimization algorithm (MATLAB scripts are provided as supplementary materials).
The single Maxwell viscoelastic model (1-Maxwell) is defined by52 (3) (4)
where is the total strain rate, is the strain rate of elastic deformation, is the strain rate of viscous deformation, is the shear stress converted from the net uniaxial stress by assuming a constant Poisson’s ratio of 0.206 for SCHOTT N-BK7, is the viscosity and G is the elastic shear modulus. To keep the model simple, we neglect the contributions from the volumetric bulk deformation strain. Under a constantly applied strain rate , the stress can be solved by integrating over time as:
(5)
where is the Maxwell relaxation time can be calculated by Eq. (1), and is the initial stress (in the model, we assume ). For the elastic shear modulus, we assume G as a free parameter, determined during the inversion process. In the limited temperature range of the present study, the dependence of viscosity on temperature can be described by an Arrhenius law. To account for the influence of pressure on viscosity, the Arrhenius equation is extended to Eq. (6) by introducing an activation volume as has been done in several studies.28, 53
(6)
Combining Eq. (6) with the idea from Narayanaswamy54, we assume that the viscosity depends on temperature and pressure as
(7)
where = 105 Pa and =561 °C are reference material parameters, and the initial viscosity , activation energy and activation volume are free parameters28.
The 1-Maxwell model can fit each experiment separately very well by allowing a change of elastic shear modulus G between the different experiments. However, the elastic shear modulus is known to be nearly constant in both glass science and geoscience applications54, 55, 56, 57 for small pressure changes (<2 GPa). Therefore, we tested fitting a single set of material parameters to all experimental mechanical data using a 1-Maxwell model. In order to fit the model to the experiments, we employ a multidimensional unconstrained nonlinear minimization optimization algorithm (using the Nelder-Mead Simplex search algorithm as incorporated in the MATLAB function fminsearch58), to find the best-fit parameters for the model. The best-fit model we obtained (after experimenting with a range of starting values , GPa, ∆H/R = 7.4×10⁴ K,
= 8.129×10⁻⁶ m3/mol59) is shown in Fig. 3a (best-fit yields G=24.9 GPa ∆H/R= 5.4×10⁴ K which are different than the reference value of Gref=34 GPa59 and (∆H/R)ref= 7.4×10⁴ K at 1-atm), which is rather poor.
Fig. 3 (a) Best-fit from the 1-Maxwell model with the fitting parameters: =4.9×10¹² Pa·s, G=24.9 GPa, = 5.4×10⁴ K, and =2.0×10⁻⁶ m3/mol; (b) Best-fit from the 2-Maxwell model with the fitting parameters: =5.4×10¹² Pa·s, G=34.2 GPa, = 6.1×10⁴ K, =2.9×10⁻⁶ m3/mol, w=0.83, and fac=15.6. The uncertainty of the shear stress is calculated from the standard deviation of steady-state viscosity and strain rate.
For many glass types, more than one Maxwell element is needed to describe the experimental data.40 To improve the fitting, we applied a generalized Maxwell model with 2 Maxwell elements59 (2-Maxwell model applied, MATLAB script available in supplemental materials), which models the rheology of glass as two parallel Maxwell bodies, which was previously found to approximate the uniaxial stress relaxation of glass successfully.60 For the stress revolution, we introduce a weighting parameter w for 2-Maxwell model and a free parameter fac to separate the viscosities,54
(8)
where the stresses are (9)
(10)
and the viscosities are (11) (12) (13) (14) (15) (16)
The best overall fit parameters and curves of the 2-Maxwell model are shown in Fig. 3b. We note that the best-fit is not unique, and it is slightly influenced by the initial
guess of the free parameters. We have performed a series of tests with different initial parameters and found an initial guess of (best-fit of 1-Maxwell model), GPa, ∆H/R = 7.4×10⁴ K,
= 8.129×10⁻⁶ m3/mol59, w=0.7 and fac = 10 to give an overall lowest misfit. The best-fit G=34.2 GPa is fit with the reference value of 34 GPa,59 while the best-fit activation energy ∆H/R= 6.1×10⁴ K (482 kJ·mol-1) is lower than the value obtained at 1-atm of ∆H/R= 7.4×10⁴ K (615 kJ·mol-1).59 The fitting is improved compared to the 1-Maxwell model. Still, the fit is not perfect, especially for the data measured at 1×10⁻⁵ s−1 and 3×10⁻⁵ s−1. A generalized Maxwell model with 3-Maxwell elements was also tested, but the results show no significant fitting improvement compared to the 2-Maxwell model. Therefore, the outcome of a 3-Maxwell model is not further discussed here.
3.3 Viscosity
The glass sample is in a uniaxial stress state during the deformation experiment, and the viscosity is then calculated as follows:61
(17)
where is the net uniaxial stress, and is the instantaneous strain rate. The uncertainty of the applied force results in a stress uncertainty of ± 6 MPa. Together with a 1 % error of the strain rate, this yields an uncertainty of the viscosity of ± 0.01 log10(Pa∙s). The uncertainty of the temperature distribution along the sample (maximal ± 5 °C) would yield more important uncertainties on viscosity, up to ± 0.22 log (Pa∙s),
based on the Arrhenius equation at 1-atm. The latter values are reported in Table 1. Our results show that to change the viscosity of SCHOTT N-BK7 glass by 0.1 log10(Pa∙s) has to change the temperature by 2.5 °C (at 300 MPa) or the pressure by 100 MPa. As shown in Fig. 4a, the viscosity decreases by ~0.4 log10(Pa·s)/10 °C from 575 °C to 595 °C. Furthermore, the viscosity curve at 595 °C furthermore takes less time to achieve steady state than deformation experiments at 575 °C.
The effect of pressure on the viscosity of SCHOTT N-BK7 is rather small.
Viscosity-time curves for 100 MPa and 200 MPa of confining pressure, shown in Fig. 4b, almost overlap each other for finite strains < 1 %. Increasing the strain rate to ~ 5 × 10⁻⁵ s-1 results in a viscosity offset of ± 0.2 log10(Pa·s) (Fig. 4c), which is close to the uncertainty of the machine and also consistent with the results from the 2-Maxwell model. Besides, samples deformed with different strain rates achieve steady state (Fig. 4c) at the similar strain of approximately 2 %, indicating that the viscosity of SCHOTT N-BK7 does not significantly depend on strain for this strain level.
Fig. 4 Time dependence of viscosity (a) at a constant confining pressure and constant
strain rate for increasing temperatures; (b) at a constant temperature and constant strain rate for increasing confining pressures; (c) at a constant temperature and constant confining pressure for increasing strain rates. The time dependence of strain is also shown in (c). For all curves, 1 data point out of every 50 points is shown for clarity.
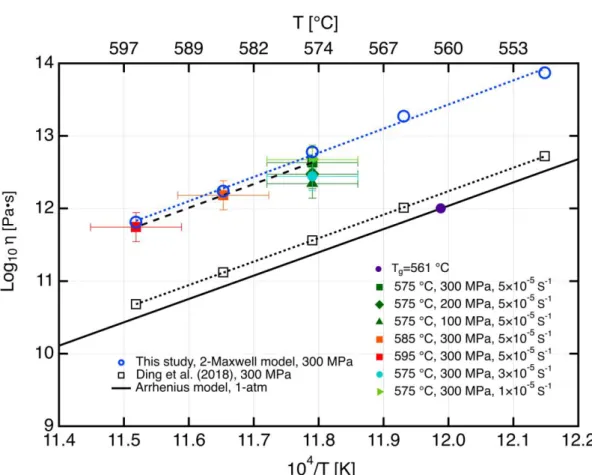
Using an Arrhenius model to describe the temperature dependence of the steady-state viscosity obtained from the deformation experiments at 300 MPa from this study gives ∆H/R= 7.2×10⁴ K (activation energy: 601 ± 10·kJ mol-1, R2=0.99) as illustrated in Fig. 5. The result is in good agreement with the activation energy of approximately ∆H/R= 7.4×10⁴
K (activation energy:615 kJ·mol-1) obtained experimentally at 1-atm.59 However, the viscosities have a significant offset of approximately +1.0 log10(Pa·s) compared to the results from the latest two-internal-parameter relaxation model.
Fig. 5 Temperature dependence of the viscosity of SCHOTT N-BK7 at high pressure compared to an Arrhenius model at 1-atm, a 2-Maxwell model at 300 MPa and the
The model developed by Ding et al.28 can be transformed into a viscosity model
(18)
and gives a positive linear dependence of viscosity on the pressure of SCHOTT N-BK7, with a slope of 0.05 log10(Pa·s)/100 MPa. The pressure dependent viscosity data
from this study, together with the viscosity predicted by the 2-Maxwell model and the latest two-internal-parameter relaxation model28 are shown in Fig. 6. We recall that the mean stress used in Fig. 6 equals to σmean = (σload + 2σAr) / 3 (see Eq. (2),51) and that the
viscosity is calculated using Eq. (17). The overall viscosity change in this study is approximately 0.1 log10(Pa·s)/100 MPa, which is similar to the prediction from the 2-Maxwell model and the latest two-internal-parameter relaxation model. The absolute viscosities are still different from the most recent two-internal-parameter relaxation model of approximately +1.0 log10(Pa·s) (same as the variable temperature experiments), even though the 2-Maxwell model can fit the data well with a negligible difference.
Fig. 6 Viscosity as a function of the mean stress of SCHOTT N-BK7 for the experimental data at 575 °C compared to the values calculated by using a 2-Maxwell model as well as the latest two-internal-parameter relaxation model (Ding et al., 2018).
4. Discussion
Since the viscosity increases with increasing pressure, SCHOTT N-BK7 glass
behaves as a depolymerized glass. The pressure yields a positive effect on forming the 3D networks (oxygen atoms in TO4 connect to adjacent tetrahedron) in SCHOTT N-BK7 glass.
The present in situ experiments confirm the previous overall temperature dependence results fitted by an Arrhenius equation. However, the viscosity dependence
on pressure is rather small and sensitive to uncertainties in temperature. Indeed, ± 5 °C can yield an uncertainty as high as ± 0.22 log10(Pa·s) on the viscosity at 300 MPa.
Glass (i.e., non-crystalline materials) typically behaves like a Newtonian fluid62 under applied stress, yet non-Newtonian viscous flow has also been observed in soda-lime silicate glass62 at strain rates around 10-4 s−1. Here, mechanical data as a function of strain rate indicate that the SCHOTT N-BK7 glass at 300 MPa and 575 °C might have
a non-Newtonian behavior (Fig. 2c), which partly affects the overall fit of the 2-Maxwell model in Fig. 3b. During the industrial glass production, the process parameters are chosen to avoid fracture, that is, to be slow enough to remain perfectly Newtonian. Thus, the influence of a large strain rate range on SCHOTT N-BK7 viscosity will need further experiments to properly quantify. On the other hand, the non-linear viscosity change with increasing strain rates might also be due to the uncertainty in temperature, such as a local heterogeneous temperature distribution (e.g., radial gradient or the heat distribution difference between the deformation assembly containing the glass cylinder and the furnace calibration assembly containing an alumina cylinder).
For the large absolute viscosity discrepancy between experimental data and the latest two-internal-parameter relaxation model (based on static high pressure and volume recovery measurement), we do not have an unambiguous explanation. It may be due to the following aspects: (i) the deformation apparatus does not permit experiments
at 1-atm and high temperature and thus the current data set cannot be confirmed by experimental data at 1-atm and 575 °C. (ii) The temperature calibration was done by using a hollow alumina cylinder instead of the SCHOTT N-BK7 glass cylinder, which
may have affected the temperature distribution. We have tried to calibrate the furnace using a specially designed hollow SCHOTT N-BK7 glass cylinder, but at high
temperature and pressure the hole for the thermocouple (which is at room pressure) shrunk as a result of viscous flow under high confining pressure, preventing any successful temperature calibration with a glass specimen. The different thermal conductivity between the SCHOTT N-BK7 glass hollow cylinder and the alumina
hollow cylinder could have caused a slight change in temperature distribution. (iii) the surface tension63 and friction64 between the glass sample and the copper jacket were not taken into account during the stress determination; or (iv) some other fundamental process is missing in the two-internal parameter relaxation model.
5. Conclusions
Deformation experiments in uniaxial compression on SCHOTT N-BK7 glass
were performed at temperatures near the glass transition temperature (561 °C) and at confining pressures of 100 to 300 MPa. The main results of this study are:
(a) The viscosity of SCHOTT N-BK7 glass increases linearly with increasing
pressure at ~0.1 log10(Pa·s)/100 MPa in the range of confining pressure investigated.
(b) The pressure dependence of viscosity measured in this study (~0.1 log10(Pa·s)/100 MPa) is consistent with the latest two-internal-parameter relaxation model.
(c) At the same temperature and the same pressure, the viscosity measured in this study is approximately +1.0 log10(Pa·s) higher than in Ding et al. (2018).28 The reason for this discrepancy has not been identified clearly.
(d) The mechanical data can be overall fitted by a Maxwell viscoelastic model with two parallel elements.
Acknowledgments
S.D. thanks D. Mainprice and M.A. Bouhifd for informative discussions during this study. The authors thank the technicians and engineers at the SCHOTT machine-shop for the sample preparation. This project has received funding from the European Union’s Horizon 2020 research and innovation program under the Marie Sklodowska-Curie grant agreement N° 642029.
References
1. Peter K. Densification and flow phenomena of glass in indentation experiments. J Non-Cryst Solids. 1970;5(2):103-115.
2. Shang HX, Rouxel T. Creep behavior of soda-lime glass in the 100-500 K temperature range by indentation creep test. J Am Ceram Soc. 2005;88(9):2625-2628. 3. Wilantewicz TE, Varner JR. Vickers indentation behavior of several commercial glasses at high temperatures. J Mater Sci. 2008;43(1):281-298.
4. Dick E. New experiments on the microplasticity of glass. Glastech Ber. 1970;43(1):16-21.
5. An QL, Ming WW, Chen M. Experimental investigation on cutting characteristics in nanometric plunge-cutting of BK7 and fused silica glasses. Materials. 2015;8(4):1428-1441.
6. Hagan J, Swain MV. The origin of median and lateral cracks around plastic indents in brittle materials. J Phys D: Appl Phys. 1978;11(15):2091.
7. Lawn BR, Dabbs TP, Fairbanks CJ. Kinetics of shear-activated indentation crack initiation in soda-lime glass. J Mater Sci. 1983;18(9):2785-2797.
8. Lee EH, Radok JRM. The contact problem for viscoelastic bodies. J Appl Mech. 1960;27(3):438-444.
9. Alkorta J, Martinez-Esnaola JM, Sevillano JG. Absence of one-to-one correspondence between elastoplastic properties and sharp-indentation load-penetration data. J Mater Res. 2005;20(5):1369-1369.
10. Rouxel T, Sangleboeuf JC. The brittle to ductile transition in a soda-lime-silica glass. J Non-Cryst Solids. 2000;271(3):224-235.
11. Fulcher GS. Analysis of recent measurements of the viscosity of glasses. J Am Ceram Soc. 1925;8(6):339-355.
12. Williams ML, Landel RF, Ferry JD. The temperature dependence of relaxation mechanisms in amorphous polymers and other glass-forming liquids. J Am Chem Soc. 1955;77(14):3701-3707.
13. Cohen MH, Turnbull D. Molecular transport in liquids and glasses. J Chem Phys. 1959;31(5):1164-1169.
14. Greet RJ, Turnbull D. Test of adam-gibbs liquid viscosity model with O-Terphenyl specific-heat data. J Chem Phys. 1967;47(6):2185-2190.
15. Turnbull D, Cohen MH. On the free‐volume model of the liquid‐glass transition. J Chem Phys. 1970;52(6):3038-3041.
16. Adam G, Gibbs JH. On the temperature dependence of cooperative relaxation properties in glass-forming liquids. J Chem Phys. 1965;43(1):139-146.
17. Mauro JC, Yue YZ, Ellison AJ, Gupta PK, Allan DC. Viscosity of glass-forming liquids. P Natl Acad Sci USA. 2009;106(47):19780-19784.
18. Mysen BO, Virgo D, Seifert FA. The structure of silicate melts: Implications for chemical and physical properties of natural magma. Rev Geophys. 1982;20(3):353-383. 19. Wang Y, Sakamaki T, Skinner LB, Jing Z, Yu T, Kono Y, et al. Atomistic insight into viscosity and density of silicate melts under pressure. Nat Commun. 2014;5:3241. 20. Kushiro I. Changes in viscosity and structure of melt of NaAlSi2O6 composition at high-pressures. J Geophys Res. 1976;81(35):6347-6350.
21. Kushiro I. Viscosity and structural-changes of albite (NaAlSi3O8) melt at high-pressures. Earth Planet Sc Lett. 1978;41(1):87-90.
22. Scarfe CM, Mysen BO, Virgo D. Pressure dependence of the viscosity of silicate melts. Magmatic processes: Physicochemical principles. 1987;1:59-67.
23. Limbach R, Winterstein-Beckmann A, Dellith J, Möncke D, Wondraczek L. Plasticity, crack initiation and defect resistance in alkali-borosilicate glasses: From normal to anomalous behavior. J Non-Cryst Solids. 2015;417:15-27.
24. Jantzen CM. Using polymerization, glass structure, and quasicrystalline theory to produce high level radioactive borosilicate glass remotely: A 20+ year legacy. Journal of the South Carolina Academy of Science. 2017;15(1):4.
25. Sperry L, JD M. Pressure dependence of viscosity of B2O3. Phys Chem Glasses. 1968;9(3):91-95.
26. Schulze F, Behrens H, Hurkuck W. Determination of the influence of pressure and dissolved water on the viscosity of highly viscous melts: Application of a new parallel-plate viscometer. Am Mineral. 1999;84(10):1512-1520.
27. Del Gaudio P, Behrens H, Deubener J. Viscosity and glass transition temperature of hydrous float glass. J Non-Cryst Solids. 2007;353(3):223-236.
28. Ding L, Buhre S, Kunisch C, Kaus B. Pressure dependence of density and structural relaxation of glass near the glass transition region. J Am Ceram Soc. 2018;101(3):1149-1158.
29. Tribone JJ, Oreilly JM, Greener J. Pressure-jump volume-relaxation studies of polystyrene in the glass-transition region. J Polym Sci Pol Phys. 1989;27(4):837-857. 30. Hodge IM. Enthalpy relaxation and recovery in amorphous materials. J Non-Cryst Solids. 1994;169(3):211-266.
31. Simon SL, Park JY, McKenna GB. Enthalpy recovery of a glass-forming liquid constrained in a nanoporous matrix: Negative pressure effects. Eur Phys J E. 2002;8(2):209-216.
32. Grassia L, Simon SL. Modeling volume relaxation of amorphous polymers: Modification of the equation for the relaxation time in the kahr model. Polymer. 2012;53(16):3613-3620.
33. Gupta PK. Fictive pressure effects in structural relaxation. J Non-Cryst Solids. 1988;102(1-3):231-239.
34. Tool AQ. Relation between inelastic deformability and thermal expansion of glass in its annealing range. J Am Ceram Soc. 1946;29(9):240-253.
35. Dingwell DB, Webb SL. Structural relaxation in silicate melts and non-newtonian melt rheology in geologic processes. Phys Chem Miner. 1989;16(5):508-516.
36. Avramov I. Pressure dependence of viscosity of glassforming melts. J Non-Cryst Solids. 2000;262(1-3):258-263.
37. Gupta PK. Negative-pressure dependence of viscosity. J Am Ceram Soc. 1987;70(7):C152-C153.
38. Mosaddegh P, Ziegert JC. Friction measurement in precision glass molding: An experimental study. J Non-Cryst Solids. 2011;357(16-17):3221-3225.
39. Dyer PE, Maswadi SM, Walton CD, Ersoz M, Fletcher PDI, Paunov VN. 157-nm laser micromachining of N-BK7 glass and replication for microcontact printing. Appl Phys a-Mater. 2003;77(3-4):391-394.
40. Koontz E, Blouin V, Wachtel P, Musgraves JD, Richardson K. Prony series spectra of structural relaxation in N-BK7 for finite element modeling. J Phys Chem A. 2012;116(50):12198-12205.
41. Paterson M. Rock deformation experimentation. Geophys Monogr. 1990:187-194. 42. Carroll MR, Stolper EM. Argon solubility and diffusion in silica glass - implications for the solution behavior of molecular gases. Geochim Cosmochim Ac. 1991;55(1):211-225.
43. Karato SI, Paterson MS, Fitz Gerald JD. Rheology of synthetic olivine aggregates - influence of grain-size and water. J Geophys Res-Solid. 1986;91(B8):8151-8176.
44. Mei S, Kohlstedt DL. Influence of water on plastic deformation of olivine aggregates 1. Diffusion creep regime. J Geophys Res-Sol Ea. 2000;105(B9):21457-21469.
45. Mei S, Kohlstedt DL. Influence of water on plastic deformation of olivine aggregates 2. Dislocation creep regime. J Geophys Res-Sol Ea. 2000;105(B9):21471-21481.
46. Demouchy S, Schneider SE, Mackwell SJ, Zimmerman ME, Kohlstedt DL. Experimental deformation of olivine single crystals at lithospheric temperatures. Geophys Res Lett. 2009;36:L04304.
47. Demouchy S, Tommasi A, Ballaran TB, Cordier P. Low strength of earth's uppermost mantle inferred from tri-axial deformation experiments on dry olivine crystals. Phys Earth Planet In. 2013;220:37-49.
48. Paterson MS. A high-pressure, high-temperature apparatus for rock deformation. Int J Rock Mech Min. 1970;7(5):517-526.
49. Frost HJ, Ashby MF. Deformation mechanism maps: The plasticity and creep of metals and ceramics. Oxford: Pergamon press; 1982.
50. Demouchy S, Mussi A, Barou F, Tommasi A, Cordier P. Viscoplasticity of polycrystalline olivine experimentally deformed at high pressure and 900 degrees C. Tectonophysics. 2014;623:123-135.
51. Paterson MS, Wong T-f. Experimental rock deformation-the brittle field. Berlin Heidelberg: Springer Science & Business Media; 2005.
52. Kaus BJP, Becker TW. Effects of elasticity on the rayleigh-taylor instability: Implications for large-scale geodynamics. Geophys J Int. 2007;168(2):843-862.
53. Jin HJ, Gu XJ, Wen P, Wang LB, Lu K. Pressure effect on the structural relaxation and glass transition in metallic glasses. Acta Mater. 2003;51(20):6219-6231.
54. Narayanaswamy OS. A model of structural relaxation in glass. J Am Ceram Soc. 1971;54(10):491-498.
56. Webb SL, Dingwell DB. Non-newtonian rheology of igneous melts at high stresses and strain rates - experimental results for rhyolite, andesite, basalt, and nephelinite. J Geophys Res-Solid. 1990;95(B10):15695-15701.
57. Zheng QJ, Mauro JC. Viscosity of glass-forming systems. J Am Ceram Soc. 2017;100(1):6-25.
58. Lagarias JC, Reeds JA, Wright MH, Wright PE. Convergence properties of the nelder-mead simplex method in low dimensions. Siam J Optimiz. 1998;9(1):112-147. 59. Jain A, Yi AY, Xie XP, Sooryakumar R. Finite element modelling of stress relaxation in glass lens moulding using measured, temperature-dependent elastic modulus and viscosity data of glass. Model Simul Mater Sc. 2006;14(3):465-477. 60. Scherer GW, Rekhson SM. Viscoelastic‐elastic composites: I, general theory. J Am Ceram Soc. 1982;65(7):352-360.
61. Rouxel T, Besson J-L, Gault C, Goursat P, Leigh M, Hampshire S. Viscosity and young's modulus of an oxynitride glass. J Mater Sci Lett. 1989;8(10):1158-1160.
62. Simmons JH, Mohr RK, Montrose CJ. Non-newtonian viscous-flow in glass. J Appl Phys. 1982;53(6):4075-4080.
63. Parikh NM. Effect of atmosphere on surface tension of glass. J Am Ceram Soc. 1958;41(1):18-22.

![Table 4-1 Experimental conditions for deformation experiments and mechanical results Samples Length [mm] Diameter [mm] Confining Pressure [MPa] Temperature [°C] Displacement Rate [mm/s] Strain Rate [s-1] Finite Strain [%] Axial Stress [MPa]](https://thumb-eu.123doks.com/thumbv2/123doknet/14797898.604773/12.1262.115.1160.164.701/experimental-conditions-deformation-experiments-mechanical-confining-temperature-displacement.webp)