HAL Id: hal-00327999
https://hal.archives-ouvertes.fr/hal-00327999
Submitted on 2 Aug 2006HAL is a multi-disciplinary open access
archive for the deposit and dissemination of sci-entific research documents, whether they are pub-lished or not. The documents may come from teaching and research institutions in France or abroad, or from public or private research centers.
L’archive ouverte pluridisciplinaire HAL, est destinée au dépôt et à la diffusion de documents scientifiques de niveau recherche, publiés ou non, émanant des établissements d’enseignement et de recherche français ou étrangers, des laboratoires publics ou privés.
PM measurement campaign HOVERT in the Greater
Berlin area: model evaluation with chemically specified
particulate matter observations for a one year period
Matthias Beekmann, A. Kerschbaumer, E. Reimer, R. Stern, D. Möller
To cite this version:
Matthias Beekmann, A. Kerschbaumer, E. Reimer, R. Stern, D. Möller. PM measurement campaign HOVERT in the Greater Berlin area: model evaluation with chemically specified particulate mat-ter observations for a one year period. Atmospheric Chemistry and Physics Discussions, European Geosciences Union, 2006, 6 (4), pp.7285-7321. �hal-00327999�
ACPD
6, 7285–7321, 2006Model evaluation with chemically specified PM observations M. Beekmann et al. Title Page Abstract Introduction Conclusions References Tables Figures J I J I Back Close
Full Screen / Esc
Printer-friendly Version Interactive Discussion
EGU
Atmos. Chem. Phys. Discuss., 6, 7285–7321, 2006 www.atmos-chem-phys-discuss.net/6/7285/2006/ © Author(s) 2006. This work is licensed
under a Creative Commons License.
Atmospheric Chemistry and Physics Discussions
PM measurement campaign HOVERT in
the Greater Berlin area: model evaluation
with chemically specified particulate
matter observations for a one year period
M. Beekmann1, A. Kerschbaumer2, E. Reimer2, R. Stern2, and D. M ¨oller31
Laboratoire Interuniversitaire de Syst `emes Atmosph ´eriques (LISA), CNRS UMR 7583, University Paris 7, University Paris 12, 61 Av. du G ´en ´eral de Gaulle, 94000 Cr ´eteil, France
2
Freie Universit ¨at Berlin, Institut f ¨ur Meteorologie, Carl-Heinrich-Becker-Weg 10, 12165 Berlin, Germany
3
BTU Cottbus, Lehrstuhl f ¨ur Luftchemie und Luftreinhaltung, Burger Chaussee 2, 03044 Cottbus, Germany
Received: 22 March 2006 – Accepted: 8 April 2006 – Published: 2 August 2006 Correspondence to: M. Beekmann ([email protected])
ACPD
6, 7285–7321, 2006Model evaluation with chemically specified PM observations M. Beekmann et al. Title Page Abstract Introduction Conclusions References Tables Figures J I J I Back Close
Full Screen / Esc
Printer-friendly Version Interactive Discussion
EGU
Abstract
The HOVERT (Horizontal and VERtical Transport of Ozone and particulate matter) campaign held in the Berlin Brandenburg area in Eastern Germany from September 2001 to September 2002 allowed to collect a unique data set of the aerosol chemical speciation (daily averages) at traffic, urban and rural sites. These observations are
5
used for a thorough evaluation of the aerosol part in the REM-CALGRID model (RCG) developed at the Free University of Berlin (FUB). For inorganic ions (sulphate, nitrate and ammonium), simulated annual averages agree to observations within ±30% at more than half of the sites and always within a factor of two. Correlation coefficients are larger than in previous studies for SO2−4 and NH+4 (>0.7). For nitrate, less elevated
10
correlations, 0.4–0.7 in the cold season, 0.2–0.4 in the warm season, are encountered. To our knowledge, this is one of the first comparisons of air quality model simulated el-emental carbon (EC and OC) with daily observations for a whole year. It suggests an overestimation of EC and OC emissions in the Berlin area (through a scaling tech-niques between EC, OC and NOx and when assuming correct NOx emissions), and
15
an underestimation of EC and OC at rural sites. Secondary organic aerosol (SOA) formation, recently introduced into the model (SORGAM module, Schell et al., 2001), is simulated as a very variable process, SOA levels varying from close to zero for most days to more than 5 µg/m3. Correlation between simulated SOA to observed OC is about 0.6, indicating that simulated variability partly corresponds to reality.
20
1 Introduction
A better knowledge of the chemical and size speciation of particulate matter (PM) is necessary to correctly address their potential health impact. Moreover, different chem-ical PM components are related to distinct sources and physico-chemchem-ical processes in the atmosphere: secondary inorganic ions (SIA) sulphate, nitrate and ammonium are
25
ACPD
6, 7285–7321, 2006Model evaluation with chemically specified PM observations M. Beekmann et al. Title Page Abstract Introduction Conclusions References Tables Figures J I J I Back Close
Full Screen / Esc
Printer-friendly Version Interactive Discussion
EGU
NH3. Secondary organic aerosol (SOA) is related to emission and transformation of VOC, elemental carbon and primary organic carbon to direct emissions, the mineral fraction to dust entrainment.
Air quality model evaluation studies using chemically specified PM data for sec-ondary inorganic ions from the EMEP network have been performed in a number of
5
papers (Hass et al., 2003; Bessagnet et al., 2004; Schaap et al., 2004a; Tørseth et al., 2004). For most of the sites and most of the models, simulated sulphate, nitrate and ammonium summer and winter averages agree within a factor of two to observa-tions. For nitrate and ammonium, routine measurements for only about 10 sites were available; it was thus not possible to discern spatial patterns in the differences. Thus,
10
focussed regional studies with a dense measurement network working over several seasons would greatly enhance the observational basis for evaluation of inorganic ion simulations.
Only a few model evaluation studies include the carbonaceous fraction of aerosols. This is due to the paucity of suitable observational (see a compilation of European
15
EC and OC measurements in Putaud et al., 2004) and emission data, and because the carbonaceous fraction was only recently included in air quality models in enough detail.
An additional difficulty in these studies is that, while elemental or black carbon (EC or BC) is of primary origin, organic carbon (OC) is both of primary and of secondary origin,
20
and both parts can not be discerned by conventional thermal or optical measurement techniques. Processes of SOA formation from thousands of oxygenated VOC’s, as well as removal processes and the climate relevance of SOA have recently been reviewed by Kanakidou et al. (2005). These complex processes are highly parameterised in models (e.g. Schell et al., 2001). In a recent paper Yu et al. (2004) have derived primary
25
OC for several measurement sites in the US using source appointment methods and then compared observation derived primary OC/EC ratios to model derived ones. EC and OC have recently been introduced also in the Unified EMEP model (Tørseth et al., 2004); first evaluation with a limited set of data over Europe (five sites) showed a
ACPD
6, 7285–7321, 2006Model evaluation with chemically specified PM observations M. Beekmann et al. Title Page Abstract Introduction Conclusions References Tables Figures J I J I Back Close
Full Screen / Esc
Printer-friendly Version Interactive Discussion
EGU
strong underestimation of simulated EC and OC (typically by about a factor two and more), which was related to the fact that only fine fraction (PM1) EC and OC emissions were taken into account (Tørseth et al., 2004; Yttry et al., 2005). Schaap et al. (2004b) derived an emission inventory for EC and primary fine aerosol for Europe, and used it to simulate EC and primary PM distributions. They found a model underestimation
5
of a factor of two or more with respect to available EC measurements, which they also attributed to probably too low emissions. A comparison between CTM model output and aerosol Raleigh lidar measurements at a suburban site near Paris led to the suggestion that SOA could be strongly underestimated by the model (Hodzic et al., 2004). Clearly, in this field much more work is needed both on the observational and
10
modelling side.
The German AFO-2000 HOVERT campaign aimed at increasing the observational data basis for chemically and size specified aerosols in a Central European region with strong anthropogenic influence, the Berlin Brandenburg area. Dedicated daily mea-surements in a network of about ten traffic, urban, peri-urban and rural sites for an
15
about one year period (from September 2001 to September 2002) provided valuable information to assess the urban/regional contrast in concentrations, sources of di ffer-ent aerosol componffer-ents and to perform a thorough model evaluation. The HOVERT data base is enhanced by routine observations from the regional Berlin and Berlin-Brandenburg air quality networks and from specific measurements at a traffic
influ-20
enced site in Berlin, supported by the SENAT of Berlin.
The RCG-model, developed at Free University of Berlin with the support of the German Environmental Protection Agency (Umweltbundesamt) (Stern, 2003), is a Chemical-Transport-model of medium complexity designed for the regional and ur-ban scale. In the past, RCG has been mainly used for the simulations of emission
25
abatement scenarios (Stern, 2003) and for ozone forecast (Tilmes et al., 2001). Model evaluation was performed mainly within the framework of several European model in-tercomparison studies (Stern et al., 2003; Hass et al., 2003; Roemer et al., 2003; Van Loon et al., 2004).
ACPD
6, 7285–7321, 2006Model evaluation with chemically specified PM observations M. Beekmann et al. Title Page Abstract Introduction Conclusions References Tables Figures J I J I Back Close
Full Screen / Esc
Printer-friendly Version Interactive Discussion
EGU
In this paper, the HOVERT data base is used for a thorough evaluation of the aerosol part of RCG employing an urban-scale model run over the Berlin Brandenburg area which was nested into an European-scale model run. First, special emphasis will be given on the evaluation of the urban/regional contrast in the simulations, i.e. to know if the model is capable to correctly represent both the production processes of
par-5
ticulate matter within an urban area (Berlin), and long range transport into that area. In an accompanying paper, Kerschbaumer et al. (2006) build on this model evaluation and use RCG for budget analysis of aerosol formation, transport and loss processes within the Berlin area. Second, we will focus on the evaluation of simulations of car-bonaceous species which have been recently introduced into RCG, but which have to
10
be considered still as “tentative”, in particular because of uncertain emission data for primary OC.
The paper is organised in the following way: the RCG model set-up is explained in the following section; in Sect. 3, the observational data base is briefly presented; Sect. 4 is devoted to results of the model/observation comparisons, distinguishing
be-15
tween analysis of annual averages, the seasonal variation, and day to day variability; in Sect. 5, possible reasons for differences between simulations and observations are discussed focussing in particular on the carbonaceous aerosol fraction; conclusions will be given in Sect. 6.
2 Model design
20
2.1 General
REM-CALGRID is an urban/regional scale model development designed to fulfil the requirements of the ambient air quality framework directive 96/62/EC of the European Commission (Stern et al., 2003). Rather than creating a completely new model, the urban-scale photochemical model CALGRID (Yamartino et al., 1992) and the regional
25
ACPD
6, 7285–7321, 2006Model evaluation with chemically specified PM observations M. Beekmann et al. Title Page Abstract Introduction Conclusions References Tables Figures J I J I Back Close
Full Screen / Esc
Printer-friendly Version Interactive Discussion
EGU
for the new urban/regional scale model, REM-CALGRID (RCG). The premise was to design an Eulerian grid model of medium complexity that can be used on the regional and the urban scale for short-term and long-term simulations of oxidant and aerosol formation.
The model includes the following features:
5
– A generalized horizontal coordinate system, including latitude-longitude
coordi-nates;
– A vertical transport and diffusion scheme that correctly accounts for atmospheric
density variations in space and time, and for all vertical flux components when employing either dynamic or fixed layers;
10
– A new methodology to eliminate errors from operator-split transport and to ensure
correct transport fluxes, mass conservation, and that a constant mixing ratio field remains constant;
– Inclusion of the recently improved and highly-accurate, monotonic advection
scheme developed by Walcek (2000). This fast and accurate scheme has been
15
further modified to exhibit even lower numerical diffusion for short wavelength dis-tributions;
– Updated releases of the SAPRC-93 and CBM-IV photochemical reaction
schemes;
– Two equilibrium aerosol modules, that treat the thermodynamics of inorganic
20
aerosols;
– An equilibrium aerosol module, that treats the thermodynamics of organic
aerosols;
– Simple modules to treat the emissions of sea salt aerosols and wind blown dust
particles;
ACPD
6, 7285–7321, 2006Model evaluation with chemically specified PM observations M. Beekmann et al. Title Page Abstract Introduction Conclusions References Tables Figures J I J I Back Close
Full Screen / Esc
Printer-friendly Version Interactive Discussion
EGU
– A simple wet scavenging module based on precipitation rates;
– An emissions data interface for long term applications that enables on-the-fly
cal-culations of hourly anthropogenic and biogenic emissions.
2.2 Model domains
The RCG large scale model domain covers approximately the political Europe (EU25)
5
ranging from –10◦W to 30◦E, and from 35◦N to 66◦N, with a resolution of 0.25◦ in latitude and 0.5◦in longitude. The nested domain covers the Berlin Brandenburg area (12◦E–15◦E, 53.5◦N–55.5◦N) with a 4 km horizontal resolution. The model was run in the dynamic layer mode with five vertical layers. In this mode, the position of the layers follows the planetary boundary layer height, except the terrain following 20 m
10
thick surface layer. Two dynamic equal-thickness layers are below the mixing height, and two above the mixing height and extending to the domain top at 3000 m.
2.3 Meteorology
Meteorological data needed by RCG at hourly intervals consist of layer-averaged grid-ded fields of wind, temperature, humidity and density, plus 2-d gridgrid-ded fields of mixing
15
heights, several boundary layer and surface variables, precipitation rates and cloud cover. All this meteorological data is produced employing a diagnostic meteorological analysis system based on an optimum interpolation procedure on isentropic surfaces. The system utilizes all available synoptic surface and upper air data (Kerschbaumer und Reimer, 2003; Reimer and Scherer, 1992).
20
2.4 Emissions
RCG model requires annual emissions of VOC, NOx, CO, SO2, CH4, NH3, PM10, and PM2.5, split into point and gridded area sources. Mass-based, source group depen-dent NMVOC profiles are used to break down the total VOC into the different species
ACPD
6, 7285–7321, 2006Model evaluation with chemically specified PM observations M. Beekmann et al. Title Page Abstract Introduction Conclusions References Tables Figures J I J I Back Close
Full Screen / Esc
Printer-friendly Version Interactive Discussion
EGU
classes of the chemical mechanisms. Hourly emissions are derived during the model run using sector-dependent, month, day-of-week and hourly emissions factors. Euro-pean - wide annual anthropogenic emission averages for 2000 for CO, NOx, NMVOC, SOx, NH3 and PM10 on a 50 km×50 km grid are taken from the EMEP data base (Vestreng, 2003) and were transformed into the geographical RCG-grid. For the nested
5
region Berlin/Brandenburg, highly resolved emissions data were obtained from regional administrations. To ensure consistency between the urban-scale and the continental-scale emissions, the Berlin/Brandenburg data were continental-scaled sector-by-sector to the level of the EMEP data.
PM10 emissions were split into a PM2.5 and a coarse PM (PM10–PM2.5) part, the
10
PM2.5 part was further split into mineral dust, EC and primary OC. EC fractions in PM2.5 emissions for different SNAP sectors given in Table 1 were taken from (Builtjes et al., 2003) and are discussed in detail in (Schaap et al., 2004b). For primary OC, no such factors exist to our knowledge for Europe. Thus the following crude method was applied to estimate these emissions in a preliminary way: In the 1996 NEI emission
15
data base (http://www.epa.gov/ttn/chief/), an average OCprim/EC emission ratio for all sectors of about two can be derived for the US. This ratio was then applied to Europe regardless of the SNAP sector, i.e. the OC fractions were set as the double of the EC fractions indicated in Table 1, except if the sum of the two factors would be larger than unity. In this case (fE C>0.33), fOC was set as: fOC=1−fE C. For example, for mobile
20
sources fE C and fOC are then nearly equal which is consistent with the global emission inventory from (Bond et al., 2004) which attributes about respectively 2.4 to 3 Tg OC and EC emissions to fossil fuel burning among which transport is a major source. Nevertheless, the allocations of OC emission fractions are crude as they relate the spatial distribution of primary OC to that of PM2.5 without taking into account specific
25
patterns of OC emissions, but a spatialised OC inventory does not exist for Europe. Biogenic VOC-emissions are derived using the E94 emissions factors for isoprene and OVOC (Other VOCs) as described in Simpson et al. (1995). Terpene emission fac-tors are taken from the CORINAIR emission hand-book. These biogenic calculations
ACPD
6, 7285–7321, 2006Model evaluation with chemically specified PM observations M. Beekmann et al. Title Page Abstract Introduction Conclusions References Tables Figures J I J I Back Close
Full Screen / Esc
Printer-friendly Version Interactive Discussion
EGU
are based on the land-use data for deciduous, coniferous, mixed forests and crops. Light intensity and temperature dependencies are also considered. Soil NO emissions are calculated as a function of fertilizer input and temperature following Simpson et al. (1995).
2.5 Chemistry
5
An updated version of the lumped chemistry scheme CBM-4 (Gery et al., 1989), includ-ing Carter’s 1-Product Isoprene scheme (Carter, 1996), was used for the simulations. Homogeneous and heterogeneous conversion of NO2to HNO3 is added. In addition to gaseous phase, also simple aqueous phase conversion of SO2to H2SO4, through oxidation by H2O2and ozone, has been incorporated. Equilibrium concentrations for
10
SO2, H2O2and ozone are calculated using Henry constants from (Seinfeld and Pandis, 1998) and assuming progressive cloud cover for relative humidity above 80%. Effective rate constants for the aqueous phase reactions SO2+H2O2 and SO2+O3 have been calculated for an average pH of 5 using acid / base equilibria and kinetic data from (Se-infeld and Pandis, 1998). The pH of 5 is close to annual averages in rain samples
col-15
lected at many European EMEP sites (http://www.nilu.no/projects/ccc/emepdata.html). Due to uncertainties in cloud liquid water content, pH, and gas phase H2O2 levels, aqueous phase SO2 to SO2−4 conversion rates are relatively uncertain, but this is a common feature for air quality models.
For numerical solution of the chemistry differential equations system, the QSSA
20
chemistry solver with a variable time step control is used. 2.6 Aerosol treatment
In RCG, different chemical fractions are considered to contribute to PM10, i.e. particu-late matter with a dynamical diameter up to 10 µm:
PM10=PMcoarse+ PM2.5prim+ EC + OCprim+ SOA + SO2−4 + NO−3 + NH+4 + Na++ Cl−(1)
ACPD
6, 7285–7321, 2006Model evaluation with chemically specified PM observations M. Beekmann et al. Title Page Abstract Introduction Conclusions References Tables Figures J I J I Back Close
Full Screen / Esc
Printer-friendly Version Interactive Discussion
EGU
For efficiency reasons, a bulk approach is used, i.e. the major PM constituents are treated as a single model species with a given log-normal size distribution. For the majority of species, its geometrical average is set to 0.48 µm±2 (geometric standard deviation), corresponding to the accumulation mode. For PMcoarse(mineral coarse par-ticles between 2.5 and 10 µm diameter), sodium and chloride (sea salt), the diameter
5
is set to 4–5 µm±3.
The equilibrium between solid, aqueous and gas phase concentrations for inorganic ions as a function of temperature and humidity is calculated on-line with the ISOR-ROPIA thermodynamic module, which is optimised for urban and regional pollution conditions (Nenes et al., 1999). Production of secondary organic aerosol (SOA) is
10
treated with the SORGAM module (Schell et al., 2001) which calculates the partition-ing of semi-volatile organic compounds produced durpartition-ing VOC oxidation between the gas and the aerosol phase. For each parent VOC, the module assumes two distinct oxidation products of different saturation vapour pressure (Odum et al., 1996). This module, originally used in the EURAD model in conjunction with the RADM chemical
15
module, was adapted to be used with CBM-4. To this purpose, terpenes (α-pinene and limonene) were added to the chemical scheme.
The aerosol scheme also includes resuspension of mineral aerosol as a function of friction velocity and the nature of soil; both the direct entrainment of small particles (Loosemore and Hunt, 2000) and saltation, i.e. the indirect entrainment due to large
20
particles which fall back to the soil and entrain smaller particles (Claiborn et al., 1998) is taken into account. The sea-salt aerosol emissions (Na+, Cl−) are parameterized according to Gong et al. (1997) as a function of size and wind speed.
2.7 Dry and wet deposition
Dry deposition for gaseous species and particles is calculated using the resistance
25
analogy. Turbulent and laminar resistance are calculated following Prado (1993) from surface roughness, Monin-Obukhov length, friction velocity, molecular diffusivity. Sur-face resistance is computed following Erisman and Pul (1994) for different surfaces
ACPD
6, 7285–7321, 2006Model evaluation with chemically specified PM observations M. Beekmann et al. Title Page Abstract Introduction Conclusions References Tables Figures J I J I Back Close
Full Screen / Esc
Printer-friendly Version Interactive Discussion
EGU
(leaves, soils, . . . ) taking into account species dependent (Henry constant, oxidation power), micro-meteorological (leave temperature, radiation, . . . ), and land-use (agri-cultural land, grass land, forest, . . . ) information. For particles, surface resistance is zero. The atmospheric resistances are large for particles in the accumulation mode (0.1 µm<Ø<1 µm), because neither Brownian motion, nor sedimentation are effective
5
pathways; these resistances are calculated for the different species using the fixed size distributions given above. Wet deposition due to in and below cloud scaveng-ing is parameterized as a function of the species dependent Henry constant and the precipitation rate.
3 Description of observational data set
10
During the HOVERT campaign (September 2001–September 2002), nine special ob-servational sites in the Berlin and Brandenburg area (Fig. 1, Table 2) were equipped with dedicated instruments to perform daily measurements of PM10 and its chemical speciation, including inorganic ions, elemental and organic carbon. Two traffic sites were chosen in the centre of Berlin, one urban background site was installed within the
15
urban area (some km south-east of the town centre), two suburban sites were placed at the southern and northern edge of the urbanised area, three rural sites and one tower in the North of Berlin (Frohnau, 321 m height) were installed in order to obtain an rural counterpart to the urban samples. Measurement sites were often part of regional or national air quality networks. Measurements started right in September 2001 at the
ur-20
ban and suburban sites MP27 (Schichauweg), MP42 (Nansenstr.), MP77 (Wiltbergstr.) and MP174 (Frankfurter Allee) and were after several months extended to other mea-surement stations (Paulinenaue in January 2002, Hasenholz in February, Beusselstr. in July). OC measurements are available from May 2002 on. At Lebus, only PM10 and EC are available, at Hasenholz only PM10. Samples from MP27 and MP77 have been
25
analysed depending on the wind direction in order to sample cases with minimal pollu-tions from the town (for about half of the cases), in order to obtain regional background
ACPD
6, 7285–7321, 2006Model evaluation with chemically specified PM observations M. Beekmann et al. Title Page Abstract Introduction Conclusions References Tables Figures J I J I Back Close
Full Screen / Esc
Printer-friendly Version Interactive Discussion
EGU
levels.
By means of a DIGITEL High-Volume-Sampler, daily samples of atmospheric PM10 fractions have been collected on quartz filters conditioned according to usual regula-tions. Subsequently, filter parts were chemically analysed by means of ion chromatog-raphy (SYKAM) in order to measure main ions (sulphate, nitrate, chloride, potassium,
5
magnesium, calcium, ammonium) as well as by means of thermographimetry to mea-sure EC (elementary carbon) and OC (organic carbon), following VDI regulation 2564, Blatt 2. In this method, elemental (EC) and organic carbon (OC) are determined from one and the same filter sample using the sequential thermal desorption properties of OC and EC and applying an IR-detection of the developed CO2. In a first step, the
10
sample is heated gradually in a helium-atmosphere up to 600◦C evaporating organic C-compounds, which are then catalytically transformed into CO2. In a second step, EC is transformed into CO2in a 20% O2/80% He atmosphere. Moreover, trace metals (Fe, Cu, Zn, etc.) were analyzed by ICP mass spectroscopy, but these measurements are not exploited in this paper (as they are not included in the RCG model).
15
4 Model evaluation
4.1 Annual averages
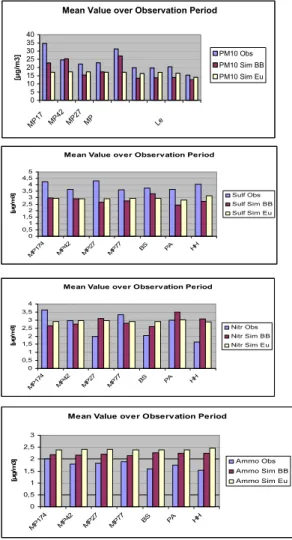
In this section, simulated annual averages for PM10, sulphate, nitrate, ammonium, EC and OC are compared to observations from the HOVERT campaign. For inorganic ions, differences in the annual averages are below ±30% for the majority of sites and always
20
within a factor of two (Fig. 2). Results are similar for the nested simulations with 4 km horizontal resolution and for the continental scale simulations with about 25 to 30 km resolution. Apparently, processes within the urban area do not much affect SIA, which is also apparent from the similar concentrations at different sites in the simulations and to a lesser extent in the observations. For sulphate, nested simulations systematically
25
ACPD
6, 7285–7321, 2006Model evaluation with chemically specified PM observations M. Beekmann et al. Title Page Abstract Introduction Conclusions References Tables Figures J I J I Back Close
Full Screen / Esc
Printer-friendly Version Interactive Discussion
EGU
–26% to+86%. While for traffic, urban and suburban sites, no systematic tendencies appear, simulations show an overestimation for the two rural sites Paulinenaue and Hasenholz. For ammonium, differences range from +8% to +46%, with again more pronounced overestimation for the rural sites. Thus, especially for the urban sites, there is an opposite tendency for sulphate and ammonium, i.e. observed aerosols are
5
more acid than simulated ones. On the contrary, the sum of SIA (sulphate + nitrate + ammonium) averaged over all sites is very similar in simulations (8.0 µg/m3
) and observations (8.3 µg/m3).
EC is underestimated at the traffic sites Frankfurter Allee and Beusselstrasse (by –42 and –25%). This behaviour can be expected, because the model with a 4 km
horizon-10
tal resolution is not designed to resolve local EC emission sources in street canyons. On the contrary, at the urban background site Nansenstrasse, EC is overestimated (by +72%, always with the nested model). For the suburban sites, Schichauweg and Wilt-bergstr., there is no clear tendency, while for the three rural sites, EC is underestimated (between –45% and –69%). For EC, as for OC, differences between the large scale
15
and the nested simulations can be large: the nested simulations show larger values for traffic und urban sites, but smaller ones for rural sites.
For OC, a qualitatively similar behaviour as for EC is observed. OC is underestimated at traffic sites (–48 and –58%), overestimated at the urban background site (+29%), and underestimated at town edge and rural sites (between –5% and –69%). The similar
20
behaviour of OC and EC may be explained by the fact that about 60% of simulated OC at rural sites and over 80% at urban sites are of primary origin and that primary OC and EC have similar emission sources (combustion).
Simulated PM10 is underestimated for most of the HOVERT sites (from –34% to +3%), the strongest underestimation occurring as expected at the traffic site
Frank-25
furter Allee. These differences may reflect uncertainties in the quality of the emission data base. This is particularly true for PM10, because the uncertainties in the emis-sions estimates for particulates are larger than for the gaseous species. These uncer-tainties stem mainly from the emissions factors and from the differing size distributions
ACPD
6, 7285–7321, 2006Model evaluation with chemically specified PM observations M. Beekmann et al. Title Page Abstract Introduction Conclusions References Tables Figures J I J I Back Close
Full Screen / Esc
Printer-friendly Version Interactive Discussion
EGU
of particles emitted from different source groups. There are also particle sources known to exist but difficult to quantify. This includes biogenic sources (pollen, biogenic debris etc.), wind blown dust from agricultural sources, natural surfaces, or from construction work and re-suspension of road dust. In addition, the often unknown representative-ness and accuracy of measurements are additional sources of errors that have to be
5
kept in mind during model evaluation. In light of the various error sources affecting PM10, the only small average underestimation of PM10 by RCG is a very positive result.
4.2 Seasonal variation
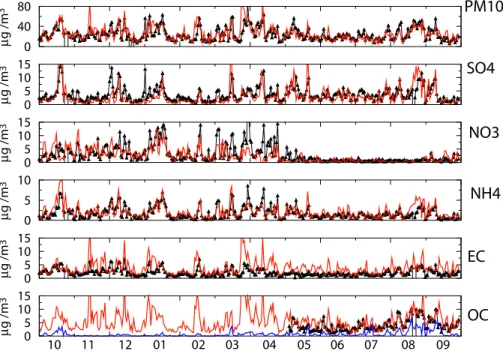
The seasonal variation for PM10, sulphate, nitrate, ammonium, EC and OC from
Oc-10
tober 2001 to September 2002 is depicted in Fig. 3 for the urban background site Nansensstrasse as an example. For PM10, a clear seasonal cycle appears neither in observations, nor in simulations, except somewhat lower values in June and July. For sulphate, most of the model underestimation seen in the annual mean is concentrated in the cold season (November to April). For nitrate, much larger levels are observed in
15
the cold season than in the summer season and this seasonal variation is well depicted by the model. The major reason is probably the smaller saturation pressure of NH4NO3 for colder winter temperatures. For ammonium, the seasonal variation is similar as for nitrate, but with a smaller amplitude. This seasonal variation is less clearly depicted in the simulations. A similar behaviour in the observed and simulated seasonal variation
20
is also apparent for the other HOVERT sites.
For EC at urban sites, the seasonal variation is not very clear, but a minimum ap-pears both in observations and simulations in late spring/early summer (May to July). Also for rural sites, no clear seasonal variation is observed and simulated. For OC, data are available only between May and September. Both in observations and
simu-25
lations, OC levels are larger in August and September. In the simulations, the higher concentrations are due to higher secondary OC concentrations.
es-ACPD
6, 7285–7321, 2006Model evaluation with chemically specified PM observations M. Beekmann et al. Title Page Abstract Introduction Conclusions References Tables Figures J I J I Back Close
Full Screen / Esc
Printer-friendly Version Interactive Discussion
EGU
pecially for nitrate, it is also depicted by the model. The largest discrepancy in the simulated seasonal variation is the sulphate model underestimation during winter.
4.3 Day to day variability
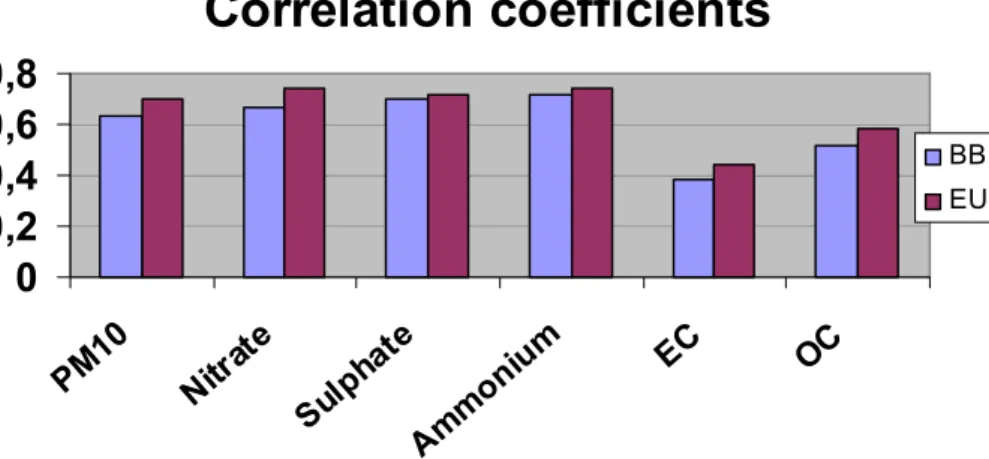
The correct representation of day-to-day variability of PM10 and its chemical compo-nents in RCG is evaluated from inspection of time series (Fig. 4), analysis of correlation
5
coefficients between daily means (Fig. 5) and normalised root mean square errors. The time series of simulated and observed PM10 at the urban background station Nansenstrasse shows good general agreement. Only few PM10 episodes are missed; however, several ones are overestimated, especially in the cold season. The annual correlation coefficient for this site is 0.63, the values for other HOVERT sites range
10
from 0.46 to 0.73. Correlation coefficients are in general about 0.1 larger during the warm season (taken here between May and September) than during the cold season (between October to April).
For sulphate and ammonium, inspection of time series (Figure 4b and d) also shows good agreement. Most of the peaks coincide, but several are also overestimated or
15
missing in simulations. Strong NH+4 peaks (and under-, overestimations) are in general linked to similar peaks of either SO2−4 or NO−3. Figure 5 shows average correlation coefficients for SO2−4 and NH+4 of respectively 0.70 and 0.72 for nested simulations and 0.72 and 0.74 for the large scale simulations. For sulphate, correlation coefficients are similar in the warm and cold season; for ammonium on the contrary, they are 0.1 to
20
0.15 larger in the cold season. Probably, the good correlation in these time series is driven by different transport regimes made evident by trajectory analysis and which seem to be well taken into account in the model (E. Reimer, personal communication): larger observed and simulated SO2−4 and NH+4 values in the Berlin region are related to transport form the east and south east sector under anti-cyclonic conditions while
25
lower values are more related to transport from the western sector under low pressure conditions.
ACPD
6, 7285–7321, 2006Model evaluation with chemically specified PM observations M. Beekmann et al. Title Page Abstract Introduction Conclusions References Tables Figures J I J I Back Close
Full Screen / Esc
Printer-friendly Version Interactive Discussion
EGU
For nitrate, the high annual correlation coefficient is driven by the strong seasonal variation. For each the cold and warm season alone, correlation coefficients are in the range 0.4 to 0.7 and 0.2 to 0.4. This lower correlation than for SO2−4 reflects the larger complexity for particulate nitrate formation, in particular the presence of an equilibrium between gaseous and aerosol phase as a function of total nitrate, ammonium and
5
sulphate availability and environmental parameters.
EC is consistently overestimated at the urban background station, in particular peak values during the cold season. Days with overestimated EC values often correspond to days with overestimated PM10, thus this overestimation probably concerns PM of primary origin in general and may be due either to too large emissions in the urban
10
area or to too small dilution. As seen before, this overestimation is specific only for the urban background site. The annual average over all correlation coefficients is 0.38 for the nested and 0.44 for the large scale model respectively, with no particular seasonal tendency.
OC measurements were available at the urban background site only from May on.
15
The correlation (R=0.5–0.6) for the nested version is mainly due to correlations be-tween simulated secondary OC and observed OC (R=∼0.6), while primary OC only poorly correlates with observed OC (R=0.1–0.4). Even if secondary OC only con-tributes to about 20% to the total simulated one for the urban and suburban sites and to about 40% for rural sites, its variability is much stronger than that of primary OC
20
(many days with near zero levels, episodic peaks, see Fig. 4f). As noted before, espe-cially the large OC values in the second half of August and first half of September are due to secondary OC formation and largely contribute to the good correlation. This pe-riod is also related to enhanced observed and simulated photooxidant levels (O3+NO2) pointing to an enhanced photochemical activity.
25
Normalised root mean square errors (NRMSE) both reflect errors in the day to day variability and systematic biases (for a definition, see for example (Schaap et al., 2004a; Hass et al., 2003). Typical values for HOVERT sites for a year period and nested simulations are about 50% for PM10, 60–70% for SO2−4 , 60–80% for NH+4, 80–
ACPD
6, 7285–7321, 2006Model evaluation with chemically specified PM observations M. Beekmann et al. Title Page Abstract Introduction Conclusions References Tables Figures J I J I Back Close
Full Screen / Esc
Printer-friendly Version Interactive Discussion
EGU
110% for NO−3, 60–140% for EC and 50–70% for OC.
In conclusion, correlation coefficients are satisfying (0.6–0.8) for PM10, SO2−4 , NH+4 and secondary OC, but less good for NO−3, prim. OC and EC. Good correlation seems to be driven by large scale transport patterns, as suggested by the consistently larger correlations obtained with the large scale simulations than with the nested ones.
5
5 Discussion
5.1 Inorganic ions
In this section, starting with inorganic ions, we compare the results from this work with those obtained in former comparison studies in light of model and measurement uncertainty. Average differences for sulphate (over a set of over 40 EMEP sites) were
10
in general within a range of ±20% in earlier evaluation studies for different European air quality models (Hass et al., 2003; Bessagnet et al., 2004; Schaap et al., 2004a), in accordance to our results for the HOVERT sites. However, average correlation is better in this work (0.72) than in previous studies (in the range 0.3–0.7). This may reflect the different set of sites studied, but also the refined formulation of the SO2 to
15
SO2−4 aqueous phase conversion in the RCG model, which takes into account relative humidity, O3 and H2O2 concentrations. Still, uncertainty in simulated SO2−4 is large, as it crucially depends on the cloud liquid water content, which is not available from the observed meteorological fields and which had to be estimated for typical low level clouds.
20
For nitrate, a significant part of differences could also stem from uncertainties in the measurements. Especially, filter techniques as used for this comparison are sub-ject to evaporation of nitrate (and ammonium) above about 20◦C (e.g. Schaap et al., 2004a). Thus, part of the overestimation at rural sites during HOVERT (Paulinenaue +17%, Hasenholz +86%) and part of the overestimation encountered in previous
ACPD
6, 7285–7321, 2006Model evaluation with chemically specified PM observations M. Beekmann et al. Title Page Abstract Introduction Conclusions References Tables Figures J I J I Back Close
Full Screen / Esc
Printer-friendly Version Interactive Discussion
EGU
ies (Hass et al., 2004) could be explained by measurement uncertainty. Besides, sim-ulated nitrate concentrations depend of a variety of aerosol component or gaseous species concentrations with their own uncertainty, like sulphate, total nitrate (HNO3+ NO−3), on total ammonium (NH+4+NH3); it also depends on the equilibrium between particulate NH4NO3 and gaseous precursors calculated by ISORROPIA as a function
5
of humidity and temperature. This large number of error sources is reflected in the lower correlation coefficients, in the range of 0.2–0.4 in the warm season, and 0.4–0.7 in the cold season, in line with results from previous evaluations (Hass et al., 2003; Bessagnet et al., 2004; Schaap et al., 2004a).
The ammonium overestimation of ten to several ten % may again be partly explained
10
by NH4NO3evaporation from the filter. Besides, it depends on the model uncertainties already noted for SO2−4 and NO−3. These average deviations are smaller than those in the EUROTRAC evaluation ranging from –45% to+87% (Hass et al., 2003). Also, as already for sulphate, the average annual correlation coefficient is better in this work (R=0.72 average over all HOVERT sites) than in previous work (r=0.4–0.6) (Hass et
15
al., 2003; Bessagnet et al., 2004; Schaap et al., 2004a). 5.2 Elemental carbon
The average differences between EC simulations and observations are not larger than about ±70% for different sites. This can be judged as a positive result in the light of the large uncertainties affecting the comparisons including emissions (1), model
20
transport and dispersion (2), removal processes (3), measurement accuracy (4) and representativity of measurement sites (5). To constrain the possible influence of these different uncertainty sources, we separately discuss the results for urban/traffic and rural sites.
For the urban site Nansenstrasse and the traffic site Frankfurter Allee, simultaneous
25
EC and NOx measurements allow normalising out effects of transport and the repre-sentativity of measurement sites. Indeed, simulated daily EC and NOx averages are highly correlated at both sites (r∼0.9), which indicates that emissions of both species
ACPD
6, 7285–7321, 2006Model evaluation with chemically specified PM observations M. Beekmann et al. Title Page Abstract Introduction Conclusions References Tables Figures J I J I Back Close
Full Screen / Esc
Printer-friendly Version Interactive Discussion
EGU
show similar spatial and temporal patterns. In addition, removal processes are not important for these near source locations. In practice, normalised simulated daily EC averages (ECsim,norm) are obtained by multiplying the originally simulated EC average ECsimby the ratio of observed to simulated daily average NOx :
ECsim,norm=ECsim× NOx obs/NOx sim (2)
5
The ratio of the annual averages in ECsim,norm and ECobs and the slope in their scatter plot (not shown) are indicated in Table 3. Note that the slope refers here to a fitting line minimizing the square of distances to the data points. For the urban background site, the effect of the normalisation is only small. At the traffic site Frankfurter Allee, the normalization procedure increases EC because simulated NOx is underestimated (as
10
the specific high emission environment of a street cannot be taken into account in a urban-scale model application). For Beusselstr., the other traffic site, NOxdata are un-fortunately not available, and the method can not be applied. Both ratios and slopes in Table 3 indicate a strong overestimation of simulated EC with respect to NOx, between a factor 1.4 and 2.0. This overestimation might even be larger, if one takes into
ac-15
count a possible positive bias in our EC measurements performed after the VDI 2564/2 method (see Sect. 3) for which a positive bias has been made evident in intercompari-son campaigns (Schmid et al., 2001; ten Brink et al., 2004). If assuming unbiased NOx measurements and emissions, these results would point to an overestimation in urban EC emissions. As described in Sect. 2, EC emissions have been derived in an
indi-20
rect manner from PM emissions by using EC/PM partition coefficients for each SNAP sector. Thus, uncertainty in EC emissions includes that in PM emissions and that in EC/PM emission ratios. Moreover, these ratios reflect average European conditions and thus may not be suitable for the specific Berlin conditions. Indeed, a specific EC (and OC) emission inventory for the Berlin area would be highly desirable, but is not
25
available yet.
In contrast to the urban sites, EC simulations are underestimated for rural sites by about a factor of two.
ACPD
6, 7285–7321, 2006Model evaluation with chemically specified PM observations M. Beekmann et al. Title Page Abstract Introduction Conclusions References Tables Figures J I J I Back Close
Full Screen / Esc
Printer-friendly Version Interactive Discussion
EGU
To our knowledge, no other systematic comparison with a dense network of mea-surements sites providing daily EC samples for a whole year has been performed so far. Preliminary comparisons of simulations with the EMEP model in 2002 and 2003 with measurements for 14 mainly rural sites during July 2002 to April 2003 (one sam-ple per week) show a model underestimation between a factor of 1.5 to 3 for rural
5
sites (Tørseth et al., 2004; Yttri et al., 2005). Schaap et al. (2004b) also find an EC underestimation with the LOTUS model by a factor of two and more for rural sites, us-ing climatological observations (generally not taken at the same time as simulations). These underestimations are qualitatively in line with results from our study also show-ing a model underestimation for rural sites. Comparisons of simulations with the EPA
10
CMAQ model show differences with observations obtained at various US sites during the IMPROVE campaign mainly between factors of ±2 (Yu et al., 2004). Interestingly, as in our study, overestimations are more common for urban sites, and underestima-tions for rural sites.
Uncertainties in measurements could explain this difference given the large
differ-15
ences in EC measurement techniques (up to a factor of 4) made evident for measure-ments at rural locations (ten Brink et al., 2004) (and which are stronger than uncertain-ties at urban sites).
On the model side, both Schaap et al. (2004) and Tørseth et al. (2004) propose an underestimation of European wide EC emissions as a possible explanation. Clearly,
20
other error sources are also possible, for example a too strong dilution in the LOTUS model with only one layer covering the whole mixing layer. Besides, removal processes of EC might be overestimated, due to the fact that EC (as OC) is considered to be mixed with other more hydrophilic components within individual particles (external mixing). In fact, isolation of a single error source among the different uncertainties stated above is
25
ACPD
6, 7285–7321, 2006Model evaluation with chemically specified PM observations M. Beekmann et al. Title Page Abstract Introduction Conclusions References Tables Figures J I J I Back Close
Full Screen / Esc
Printer-friendly Version Interactive Discussion
EGU
5.3 Organic carbon
Organic carbon consists both of a primary and a secondary part, which are not dis-cerned by measurements. Simulated secondary organic carbon correlates better with measurements than does the primary one (r=∼0.6 versus r=0.1 to 0.4), even it ac-counts only for about 20–40% of total simulated OC. Attempts have been made in the
5
literature to derive primary OC to EC ratios from observations by sorting out measure-ments containing secondary OC using a criterion on photochemical activity (Russel and Allen, 2004) or by considering only a fraction of data with the lowest ratios (Yu et al., 2004). Such methods were tentatively employed here, but did not to give sta-ble enough results for the purpose of a quantitative model evaluation, i.e. the derived
10
OCprim/EC ratio significantly varied for different sub-sets of data.
Alternatively, we use again scaling with other compounds to get information about the different error sources affecting primary and secondary OC simulations. Provided that spatial and temporal patterns of EC and OC emissions and removal processes are similar, scaling of simulated primary OC with the ratio of observed to simulated
15
EC allows to normalise out several error sources: errors in absolute emissions (but not in the ratio in OC/EC emissions), in transport and dispersion, in removal (as far as independent of aerosol type) and in the representativity of sites located close to sources:
OCsim,norm=OCprimsim × ECobs/ECsim+ OCsecsim (3)
20
Results in Table 4 indicate a significant improvement in correlation (by 0.1 to 0.3) due to the scaling procedure; correlation coefficients between OCsim,normand OCsobsrange now between 0.72 and 0.82, slopes are near unity (between 0.86 and 1.14, note that slope again refers to a fitting line minimizing squares of distances with data points). This is attributed to “correction” of the above mentioned error sources. Error sources
25
which have not been subject to normalising (OC/EC emission ratio, the simulation of secondary OC, and measurement errors of OC and EC) thus lead only to a small bias, but as a matter of evidence, error compensation can not be excluded. If the OC/EC
ACPD
6, 7285–7321, 2006Model evaluation with chemically specified PM observations M. Beekmann et al. Title Page Abstract Introduction Conclusions References Tables Figures J I J I Back Close
Full Screen / Esc
Printer-friendly Version Interactive Discussion
EGU
emission ratio was correct, then urban OC emissions (like EC) would appear to be overestimated.
The simulated OCprim/EC ratio obtained in our study can be qualitatively compared to “pseudo” observations from other studies. Our values between 1.2 and 1.4 are well within the range of values reported at several urban and rural sites, between 1.1 and
5
1.9, with one outlier at 4.6 (Yu et al., 2004).
From the OC/EC scaling procedure, no particular bias for SOA could be inferred. Correlation between simulated SOA and total observed OC of about 0.6 also indicate that the simulated SOA variability partly reflects reality. These results are satisfying in light of the uncertainties related to SOA modelling including VOC and in particular
10
terpene emissions, saturation pressure of VOC oxidation products, the problems of SOA aging, the polymerisation of SOA compounds (e.g. Kalberer et al. 2004), SOA dependence on pre-existing aerosols, SOA wet and dry removal, and many more.
6 Conclusion and perspectives
During the HOVERT campaign (from September 2001 to September 2002), a unique
15
data base of the particulate matter chemical speciation has been gathered at several sites in the Berlin-Brandenburg area in Germany. These observations are used for a thorough evaluation of the aerosol part in the REM-CALGRID (RCG) model developed at the Free University of Berlin. For inorganic ions (sulphate, nitrate and ammonium), simulated annual averages agree to observations within ±30% for more than half of the
20
sites, and always within a factor of two. Averaged over all HOVERT sites, the model shows a tendency for a too large nitrate to sulphate ratio, but the sum of sulphate, nitrate and ammonium agrees within 5% to observations. These results are satisfy-ing; they are in the order of previous comparison exercises. The seasonal variations are, when present, in general well depicted, with the exception of a SO2−4 deficiency
25
in winter/spring time simulations. Correlation coefficients are larger for SO2−4 and NH+4 (>0.7) than in previous model evaluation studies. This is ascribed to a good model
ACPD
6, 7285–7321, 2006Model evaluation with chemically specified PM observations M. Beekmann et al. Title Page Abstract Introduction Conclusions References Tables Figures J I J I Back Close
Full Screen / Esc
Printer-friendly Version Interactive Discussion
EGU
representation of the transport patterns into the Berlin urban area, leading to large transport values from the south-east sector (Poland, Saxonia), and lower values from the western sector. It may also reflect progress in the parameterization of the SO2 to SO2−4 conversion, although model uncertainties are still large, especially in regard of the estimation of cloud water content from relative humidity and the removal processes.
5
For nitrate, correlation is lower, which is ascribed to additional uncertainty in the ther-modynamic equilibrium calculation between NH4NO3and its gaseous precursors.
To our knowledge, this is one of the first comparisons of air quality model simulated elemental carbon (EC) with daily observations at several sites and over a time span of up to one year. It suggests an overestimation of EC emissions in the Berlin area
10
(through a scaling technique with NOx, and under the assumption that NOx emissions are correct). The underestimation of EC at rural sites could be due either to an under-estimation in background EC emissions, a too fast EC removal and/or a positive bias in observations.
Organic carbon (OC) shows a similar picture as EC, with a probable urban emission
15
overestimation, and an underestimation at rural sites. Scaling of OC with EC shows that there is no significant bias in the combination of three error sources: OC/EC emission ratios, secondary organic aerosol (SOA) formation during VOC oxidation, and mea-surement errors in the OC/EC ratio. Although error compensation cannot be excluded, these results give some credit to the crude description of OC/EC emission ratios in
20
the model and to the correctness of the SORGAM SOA formation scheme. Also the correlation coefficients around 0.6 between SOA and measured OC indicate that the model depicts part of the variability in SOA formation.
The overestimation of urban EC and OC and the rural underestimation together may lead to a “local” bias of the model in the Berlin area, i.e. differences between urban and
25
regional background levels are overestimated by the model. This local bias may have an effect also on PM10 levels: for days with a significant EC overestimation at the urban background site, also PM10 is overestimated. These considerations are important to be taken in mind when using the model for budget studies (see Kerschbaumer et al.,
ACPD
6, 7285–7321, 2006Model evaluation with chemically specified PM observations M. Beekmann et al. Title Page Abstract Introduction Conclusions References Tables Figures J I J I Back Close
Full Screen / Esc
Printer-friendly Version Interactive Discussion
EGU
2006).
As an overall conclusion, this evaluation study has helped to gain increasing confi-dence in simulations of chemical constituents of particulate matter with the RCG model. It also has made evident some model and input data deficiencies: sulphate underes-timation during winter/spring time, nitrate overesunderes-timation at rural sites, an EC and OC
5
underestimation at rural sites, an indication for EC and OC emission overestimation in the Berlin area. As a next step, it would be interesting to use this very detailed HOVERT data set for a broader evaluation exercise including other European air quality models.
Acknowledgements. The HOVERT project was supported by the AFO-2000 program set-up
by the German Federal Ministery of Research and Technology (BMFT). An additional
obser-10
vational site (Beusselstr.) was run with the support of the Senat Berlin. The development of the REM-CALGRID model was supported by the German Federal Environmental Agency (Umweltbundesamt) within the R&D-projects 298 41 252 and 299 43 246. M. Beekmann was on sabbatical leave at Freie Universit ¨at Berlin during September 2002 to August 2003 and was supported by CNRS (France).
15
References
Bessagnet, B., Hodzic, A., Vautard, R., Beekmann, M., Cheinet, S., Honor ´e, C., Liousse, C., and Rouil, L.: Aerosol modelling with CHIMERE – preliminary evaluation at the continental scale, Atmos. Environ., 38, 2803–2817, 2004.
Bond, T. C., Streets, D. G., Yarber, K. F., Nelson, S. M., Woo, J. H., and Klimont, Z.: A
20
technology-based global inventory of Black and Organic Carbon emissions from Combus-tion, J. Geophys. Res., 109, D14203, doi:10.1029/2003JD003697, 2004.
Builtjes, P. J. H.: Aerosols over Europe, Focus on Black carbon, TNO report R2003/146, Febru-ary 2003.
Carter, W.: Condensed atmospheric photooxidation mechanisms for isoprene, Atmos. Environ.,
25
30, 4275–4290, 1996.
Claiborn, C., Lamb, B., Miller, A., Beseda, J., Clode, B., Vaughan, J., Kang, L., and Nevine, C.: Regional measurements and modeling of windblown agricultural dust: The Columbia Plateau PM10 Program, J. Geophys. Res., 103(D16), 19 753–19 767, 1998.
ACPD
6, 7285–7321, 2006Model evaluation with chemically specified PM observations M. Beekmann et al. Title Page Abstract Introduction Conclusions References Tables Figures J I J I Back Close
Full Screen / Esc
Printer-friendly Version Interactive Discussion
EGU
Erisman, J. and Van Pul, A.: Parameterization of surface resistance for the quantification of atmospheric deposition of acidifying pollutants and ozone, Atmos. Environ., 28, 2595–2607, 1994.
Gery, M., Witten, G., and Killus, J.: A photochemical kinetics mechanism for urban scale and regional scale computer modelling, J. Geophys. Res., 100(D5), 8873–8892, 1989.
5
Gong, S. L., Barrie, L. A., and Blanchet, J.-P.: Modelling sea-salt aerosols in the atmosphere. 1. Model development, J. Geophys. Res., 102, 3805–3818, 1997.
Guenther, A.: Isoprene and mono-terpene emission rate variability – model evaluation and sensitivity analysis, J. Geophys. Res., 98(D7), 12 609–12 617, 1993.
Hass, H., Bultjes, P. J. H., Simpson, D., and Stern, R.: Comparison of model results obtained
10
with several European regional air quality models, Atmos. Environ., 31, 3259–3279, 1997. Hass, H., Van Loon, M., Kessler, C., Stern, R., Matthijsen, J., Sauter, F., Zlatev, Z., Langner, J.,
Foltescu, V., and Schaap, M.: Aerosol modelling: results and intercomparison from European regional scale modelling systems, EUROTRAC-2 special report, GSF, Munich, Germany, 2003.
15
Hodzic, A., Chepfer, H., Chazette, P., Beekmann, M., Bessagnet, B., Drobinski, P., Goloub, P., Haeffelin, M., Morille, Y., and Vautard, R.: Comparison of aerosol chemistry transport simulations with lidar and sun-photometer observations at a site near Paris, J. Geophys. Res., D23201, doi:10.1029/2004JD004735, 2004.
Kalberer, M., Paulsen, D., Sax, M. Steinbacher, M., Dommen, J., Prevot, A. S. H., Fisseha, R.,
20
Weingartner, E., Frankevich, V., Zenobi, R., and Baltensperger, U.: Identification of Polymers as Major Components of Atmospheric Organic Aerosols, Science, 303, 1659–1662, 2004. Kanakidou, M., Seinfeld, J. H., Pandis, S. N., Barnes, I., Dentener, F. J., Facchini, M. C., Van
Dingenen, R., Ervens, B., Nenes, A., Nielsen, C. J., Swietlicki, E., Putaud, J. P., Balkanski, Y., Fuzzi, S., Horth, J., Moortgat, G. K., Winterhalter, R., Myhre, C. E. L., Tsigaridis, K.,
25
Vignati, E., Stephanou, E. G., and Wilson, J.: Organic aerosol and global climate modelling: a review, Atmos. Chem. Phys., 5, 1053–1123, 2005.
Kerschbaumer, A. and Reimer, R.: Erstellung meteorologischer Eingangsdaten f ¨ur das REM/CALGRID Modell: Modellregion Berlin-Brandenburg, Berichte zum UBA Forschungsvorhaben 299 43 246, Freie Universit ¨at Berlin, Institut f ¨ur Meteorologie, 2003.
30
Kerschbaumer, A., Beekmann, M., and Reimer, E.: Aerosol Mass Budget Analysis over Berlin City Area by means of the CTM REM CALGRID, 28th ITM on Air Pollution Modelling and its Application, Leipzig, Germany, May 15–19, 2006.
ACPD
6, 7285–7321, 2006Model evaluation with chemically specified PM observations M. Beekmann et al. Title Page Abstract Introduction Conclusions References Tables Figures J I J I Back Close
Full Screen / Esc
Printer-friendly Version Interactive Discussion
EGU
Limbeck, A., Rend, J., Heimburger, G., Kranabetter, A., and Puxbaum, H.: Seasonal variation of palladium, elemental carbon and aerosol mass concentrations in airborne particulate matter, Atmos. Environ., 38, 1979–1987, 2004.
Loosemore, G. A. and Hunt, J. R. : Dust resuspension without saltation, J. Geophys. Res., 105(D16), 20 663–20 671, 2000.
5
Nenes, A., Pilinis, C., and Pandis, S. N.: Continued development and testing of a new ther-modynamic aerosol module for urban and regional air quality models, Atmos. Environ., 33, 1553–1560, 1999.
Odum, J. R., Hoffmann, T., Bowman, F., Collins, D., Flagan, R. C., and Seinfeld, J. H.: Gas/Particle partitioning and secondary organic aerosol yields, Environ. Sci. Technol., 30,
10
2580–2585, 1996.
Prado, J.: Seasonal contrasts of modelled and observed dry deposition velocities of O3, NO2 and SO2over three surfaces, Atmos. Environ., 27, 807–814, 1993.
Reimer, E. und Scherer, B.: An operational meteorological diagnostic system for regional air pollution analysis and long term modeling, in: Air Pollution Modelling and its Application IX,
15
edited by: v. Dop, H. und Kallos, G., NATO Challenges of Modern Society, Kluwer Aca-demic/Plenum Publisher, New York, 1992.
R ¨omer, M., Beekmann, M., Bergstr ¨om, R., Boersen, G., Feldmann, H., Flatøy, F., Honore, C., Langner, J., Jonson, J. E., Matthijsen, J., Memmesheimer, M., Simpson, D., Smeets, P., Solberg, S., Stern, R., Stevenson, D., Zandveld, P., and Zlatev, Z.: Ozone trends according
20
to ten dispersion models, EUROTRAC-2 special report, GSF, Munich, Germany, 2003. Russel, M. and Allen, D. T.: Seasonal and spatial trends in primary and secondary organic
aerosol carbon concentrations in southeast Texas, Atmos. Environ., 38, 3225–3239, 2004. Schmid, H., Laskus, L., Abraham, H. J., Baltensberger, U., Lavanchy, V., Bizjak, M., Burba,
P., Cachier, H., Crow, D., Chow, J., Gnauk, T., Even, A., ten Brink, H. M., Giesen, K. P.,
25
Hitzenberger, R., Yueglin, C. H., Maenhut, W., Pio, C., Carvalho, A., Putaud, J. P., Toom-Sauntry, D., and Puxbaum, H.: Results of the “carbon conference” international carbon round robin test stage I, Atmos. Environ., 35, 2111–2121, 2001.
Schaap, M., van Loon, M., ten Brink, H. M., Dentener, F. J., and Builtjes, P. J. H.: Secondary in-organic aerosol simulations for Europe with special attention to nitrate, Atmos. Chem. Phys.,
30
4, 857–874, 2004a.
Schaap, M., Van Der Gon, H. A. C. D., Visschedijk, A. J. H., Van Loon, M., ten Brink, H. M., Dentener, F. J., Putaud, J.-P., Guillaume, B., Liousse, C., and Builtjes, P. J. H.: Anthropogenic
ACPD
6, 7285–7321, 2006Model evaluation with chemically specified PM observations M. Beekmann et al. Title Page Abstract Introduction Conclusions References Tables Figures J I J I Back Close
Full Screen / Esc
Printer-friendly Version Interactive Discussion
EGU
Black Carbon and Fine Aerosol Distribution over Europe, J. Geophys. Res., 109, D18207, doi:10.1029/2003JD004330, 2004b.
Schell, B., Ackermann, I. J., Hass, H., Binkowski, F., and Ebel, A.: Modelling the formation of secondary organic aerosol within a comprehensive air quality model system, J. Geophys. Res., 106(D22), 28 275–28 293, 2001.
5
Seinfeld, J. and Pandis, S. N.: Atmospheric Chemistry and Physics, John Wiley and Sons, 1998.
Stern, R.: Entwicklung und Anwendung eines dreidimensionalen photochemischen Ausbre-itungsmodells, Meteorologische Abhandlungen Serie A, Band 8, Institut f ¨ur Meteorologie der FU-Berlin, 1994.
10
Stern, R.: Entwicklung und Anwendung des chemischen Transportmodells REM/CALGRID, Berichte zum UBA Forschungsvorhaben 298 41 252, Freie Universit ¨at Berlin, Institut f ¨ur Meteorologie, 2003.
Stern, R., Yamartino, R., and Graff, A.: Dispersion modelling within the European Community’s Air Quality Directives: long term modelling of O3, PM10 and NO2, 26th ITM on Air Pollution
15
Modelling and its Application, May 26–30, 2003, Istanbul, Turkey, 2003.
Simpson, D., Guenther, A., Hewitt, C. N., and Steinbrecher, R.: Biogenic emissions in Europe, 1, Estimates and uncertainties, J. Geophys. Res., 100(D11), 22 875–22 890, 1995.
Simpson, D., Winiwarter, W., B ¨orjesson, G., Cinderby, S., Ferreiro, A., Guenther, A., Hewitt, C. N., Janson, R., Khalil, M. A. K., Owen, S., Pierce, T. E., Puxbaum, H., Shearer, M., Skiba,
20
U., Steinbrecher, R., Tarras ´on, L., and ¨Oquist, M. G.: Inventorying emissions from nature in Europe, J. Geophys. Res., 104(D7), 8113–8152, 1999.
ten Brink, H., Maenhaut, W., Hitzenberger, R., Gnauk, T., Spindler, G., Even, A., Chi, X., Bauer, H., Puxbaum, H., Putaud, J. P., Tursic, J., and Berner, A.: INTERCOMP2000: the comparability of methods in use in Europe for measuring the carbon content of aerosol,
25
Atmos. Environ., 38, 3259–3279, 2004.
Tilmes, S., Brandt, J., Flatøy, F., Bergstr ¨om, R., Flemming, J., Langner, J., Christensen, J. H., Frohn, L. M., Hov, Ø., Jacobsen, I., Reimer, E., Stern, R., and Zimmermann, J.: Compar-ison of five eulerian air pollution systems for the summer 1999 using the German ozone monitoring data, J. Atmos. Chem., 42, 91–121, 2002.
30
Tørseth, K. (Ed.): Transboundary particulate matter in Europe, EMEP status report August 2004.
ACPD
6, 7285–7321, 2006Model evaluation with chemically specified PM observations M. Beekmann et al. Title Page Abstract Introduction Conclusions References Tables Figures J I J I Back Close
Full Screen / Esc
Printer-friendly Version Interactive Discussion
EGU
J., Brandt, J., Fagerli, H., Tarrason, L., Rodgers, I., Teasdale, I., Stern, R., Bergstr ¨om, R., Langner, J., and Foltescu, V.: Model intercomparison in the framework of the review of the Unified EMEP model. TNO-report R2004/282, 53 pp. Available at http://www.mep.tno.nl., 2004.
Vestreng, V.: Review and revision of emissions reported to CLRTAP, EMEP status report July,
5
2003.
Walcek, C. J.: Minor flux adjustment near mixing ratio extremes for simplified yet highly accurate monotonic calculation of tracer advection, J. Geophys. Res., 105(D7), 9335–9348, 2000. Yamartino, R. J., Scire, J. S, Charmichael, G. R., and Chang, Y. S.: The CALGRID mesoscale
photochemical grid model-I. Model formulation, Atmos. Environ., 26A, 1493–1512, 1992.
10
Yttri, K. E. and Tørseth, K. (Ed.): Transboundary particulate matter in Europe, EMEP status report August, 2004.
Yu, S., Dennis, R. L., Bhave, P. V., and Eder, B. K.: Primary and secondary organic aerosol over the United States: estimates on the basis of observed organic carbon (OC) and elemental carbon (EC), and air quality modeled primary OC/EC ratios, Atmos. Environ., 38, 5257–5268,
15
ACPD
6, 7285–7321, 2006Model evaluation with chemically specified PM observations M. Beekmann et al. Title Page Abstract Introduction Conclusions References Tables Figures J I J I Back Close
Full Screen / Esc
Printer-friendly Version Interactive Discussion
EGU
Table 1. EC emission ratios of PM2.5 emissions for different SNAP sectors from (Builtjes et al.,
2003).
Sector EC fraction of PM2.5-Emissions (fE C)
Power generation 0.12 Residential, commercial and other combustion 0.2 Industrial combustion 0.13 Industrial processes 0 Extraction, distribution fossil fuels 0.79 Road transport 0.47 Other mobile sources 0.49 Waste treatment and disposal 0.004
ACPD
6, 7285–7321, 2006Model evaluation with chemically specified PM observations M. Beekmann et al. Title Page Abstract Introduction Conclusions References Tables Figures J I J I Back Close
Full Screen / Esc
Printer-friendly Version Interactive Discussion
EGU
Table 2. Characteristics of measurement sites relevant for this study.
Name of the site Acronym Location Type Measurement periods1 Frankfurter Allee MP 174 Berlin urban area Traffic OC > May 2002 Beusselstrasse BS Berlin urban area Traffic All > July 2002 Nansenstrasse MP42 Berlin urban area Urban background OC > May 2002 Schichauweg MP27 Edge of urban area – north Suburban OC > May 2002 Wiltbergstrasse MP77 Edge of urban area – south Suburban OC > May 2002
Paulinenaue PA Brandenburg Rural All > Jan., OC > Feb. 2002 Hasenholz HH Brandenburg Rural All > Feb. 2002
Lebus LB Brandenburg Rural Only weekly PM10+ EC Neuglobsow NG Brandenburg Rural Only PM10
Notes:
(1) measurement periods: by default observations from October 2001 to September 2002 are used;
ACPD
6, 7285–7321, 2006Model evaluation with chemically specified PM observations M. Beekmann et al. Title Page Abstract Introduction Conclusions References Tables Figures J I J I Back Close
Full Screen / Esc
Printer-friendly Version Interactive Discussion
EGU
Table 3. Observed and simulated EC and NOxannual averages for urban and traffic sites and
derived quantities.
ECobs ECsim NOx obs NOx sim ECsim,norm. Slope
(µg/m3) (µg/m3) (µg/m3) (µg/m3) ECobs
Frankfurter Allee 4.28 2.57 64.2 27.7 1.39 1.68