HAL Id: insu-02774158
https://hal-insu.archives-ouvertes.fr/insu-02774158
Submitted on 4 Jun 2020HAL is a multi-disciplinary open access archive for the deposit and dissemination of sci-entific research documents, whether they are pub-lished or not. The documents may come from teaching and research institutions in France or abroad, or from public or private research centers.
L’archive ouverte pluridisciplinaire HAL, est destinée au dépôt et à la diffusion de documents scientifiques de niveau recherche, publiés ou non, émanant des établissements d’enseignement et de recherche français ou étrangers, des laboratoires publics ou privés.
Calibration of the distance scale from galactic Cepheids
I. Calibration based on the GFG sample
Georges Paturel, Gilles Theureau, P. Fouque, J N Therry, I. Musella, Tobias
Ekholm
To cite this version:
Georges Paturel, Gilles Theureau, P. Fouque, J N Therry, I. Musella, et al.. Calibration of the distance scale from galactic Cepheids I. Calibration based on the GFG sample. Astronomy and Astrophysics -A&A, EDP Sciences, 2002, 383 (2), pp.398-409. �10.1051/0004-6361:20011786�. �insu-02774158�
DOI: 10.1051/0004-6361:20011786 c
ESO 2002
Astrophysics
&
Calibration of the distance scale from galactic Cepheids
I. Calibration based on the GFG sample
?G. Paturel1, G. Theureau4, P. Fouqu´e2, J. N. Terry1, I. Musella3, and T. Ekholm1
1
CRAL-Observatoire de Lyon, avenue Charles-Andr´e, 69561 Saint-Genis Laval Cedex, France
2
European Southern Observatory, Casilla 19001, 19 Santiago, Chile
3 Osservatorio Astronomico di Capodimonte, via Moiariello 16, 80131 Napoli, Italy 4
Laboratoire de Physique et de Chimie de l’Environnement, 3A avenue de la Recherche scientifique, 45071 Orleans Cedex 02, France
Received 6 March 2001 / Accepted 28 November 2001
Abstract. New estimates of the distances of 36 nearby galaxies are presented based on accurate distances of
galactic Cepheids obtained by Gieren et al. (1998) from the geometrical Barnes-Evans method. The concept of “sosie” is applied to extend the distance determination to extragalactic Cepheids without assuming the linearity of the PL relation. Doing so, the distance moduli are obtained in a straightforward way. The correction for extinction is made using two photometric bands (V and I) according to the principles introduced by Freedman & Madore (1990). Finally, the statistical bias due to the incompleteness of the sample is corrected according to the precepts introduced by Teerikorpi (1987) without introducing any free parameters (except the distance modulus itself in an iterative scheme). The final distance moduli depend on the adopted extinction ratio RV/RI and on
the limiting apparent magnitude of the sample. A comparison with the distance moduli recently published by the Hubble Space Telescope Key Project (HSTKP) team reveals a fair agreement when the same ratio RV/RI is
used but shows a small discrepancy at large distance. In order to bypass the uncertainty due to the metallicity effect it is suggested to consider only galaxies having nearly the same metallicity as the calibrating Cepheids (i.e. Solar metallicity). The internal uncertainty of the distances is about 0.1 mag but the total uncertainty may reach 0.3 mag.
Key words. galaxies: distances and redshift – galaxies: stellar content – cosmology: distance scale
1. Introduction: Discussion of the problems related to Cepheids
As an extension of our study of the kinematics of the lo-cal universe (KLUN+) we need an accurate value for the global Hubble constant and accurate distances of individ-ual galaxies. The calibration of the distance scale is thus a fundamental step in this process. The aim of this work was to calibrate the distance scale from nearby galactic Cepheids for which the HIPPARCOS satellite measured geometrical parallaxes. This should avoid the step of cal-ibrating the distance scale by assuming a given distance to the Large Magellanic Cloud (LMC). Unfortunatelly, it turns out that these measurements are very difficult to use due to a statistical bias (Lutz & Kelker 1973). The diffi-culties can be solved by proper treatment, like the one
Send offprint requests to: G. Paturel, e-mail: patu@obs.univ-lyon1.fr
? The table of the Appendix and Table 3 are
avail-able in electronic form at CDS via anonymous ftp to cdsarc.u-strasbg.fr (130.79.128.5) or via
http://cdsweb.u-strasbg.fr/cgi-bin/qcat?J/A+A/383/398, and on our anonymous ftp-server www-obs.univ-lyon1.fr (pub/base/CEPHEIDES.tar.gz).
proposed by Feast & Catchpole (1997). It has been shown that this leads to unbiased results (Pont et al. 1997; Lanoix et al. 1999).
On the other hand, individual measurements of Cepheids from HIPPARCOS are relatively inaccurate be-cause of the distance of galactic Cepheids. Excluding
α UMi which does not pulsate in the fundamental mode,
the best geometrical parallax of an individual Cepheid obtained from HIPPARCOS is 3.32± 0.58 marcsec for
δ Cephee. This leads to an uncertainty in the distance
modulus of 0.38 mag. In comparison, the quasi-geometrical method of Barnes-Evans applied to Cepheids (Gieren et al. 1998; hereafter GFG), gives distance moduli with a typi-cal uncertainty less than 0.1 mag (the external error can be estimated to about 0.2 mag according to Table 7 in GFG). We call this method quasi-geometrical because it requires only a few assumptions. The method is indepen-dent of any determination of the LMC distance and has a relatively small systematic error (about 0.2 mag). Thus,
we decided to calibrate the distance scale using the work done by Gieren et al. (1998).
Nevertheless, other difficulties appear. The slope of the Period-Luminosity relation (hereafter, PL relation)
Article published by EDP Sciences and available at http://www.aanda.org or http://dx.doi.org/10.1051/0004-6361:20011786
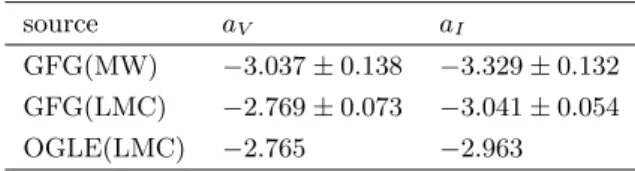
Table 1. Slopes of the PL relation.
source aV aI
GFG(MW) −3.037 ± 0.138 −3.329 ± 0.132 GFG(LMC) −2.769 ± 0.073 −3.041 ± 0.054
OGLE(LMC) −2.765 −2.963
determined from the adopted calibrating galactic Cepheids differs from the slope obtained for the LMC by the same authors (GFG) (Table 1). For the LMC, the slopes in V and I bands are now confirmed by the OGLE survey (Udalski et al. 1999). What slope should we adopt? The true physical relation is actually a Period-Luminosity-Color (hereafter, PLC) relation written as
M = α log P +βCo+γ, where M is the absolute magnitude
and Co the intrinsic color. The PL relation is simply the
projection of the PLC onto the P–L plane. In the PLC re-lation the slope ∂M/∂ log P is constant. However, the ob-served slope of the PL relation depends on the distribution of observed Cepheids in the PLC plane (i.e., on the color distribution of the sample). Hence, the slope in a given photometric band may partially depend on the metallicity, because it affects the intrinsic color. Linear non-adiabatic models do predict that the slope is constant when one uses bolometric magnitudes (Baraffe et al., private communi-cation), whereas non-linear models predict that the slope depends on the metallicity also for the bolometric magni-tudes (Bono et al. 2000 and references therein) and predict that the slope in a given band depends on the metallicity. Because the metallicity of the LMC differs from the metal-licity in the Solar neighbourhood, the choice of slopes in different bands is difficult. In order to avoid this dilemma
we decided to apply the method of “sosie” (Paturel 1984) because it does not require knowledge of the slope and zero point of the PL relation1.
The correction for extinction produced by interstellar matter is another difficulty. It can be solved by assuming that the extinction law is universal. We will thus assume that the extinction on an apparent magnitude is propor-tional to the color excess (Aλ = Rλ(C− Co), where C is
the reddened color). The factor of proportionality Rλ is taken from tabulations (e.g., Cardelli et al. 1989; Caldwell & Coulson 1987; Laney & Stobie 1993). It depends on both the considered band and color. With such an assumption it is possible to use the Freedman & Madore (1990) precepts of de-reddening. Two bands are needed in order to calcu-late a color. Because most extragalactic Cepheids are mea-sured in V - and I-band from The Hubble Space Telescope (hereafter, HST), we will use these two bands. Thus, the
Freedman & Madore (1990) de-reddening method will be adapted to the sosie method, used in V and I photometric bands.
Finally, an ultimate difficulty comes from the in-completeness bias. This bias was first studied by 1 This method was first introduced to solve the same kind of
problems for the Tully-Fisher relation (1977).
Teerikorpi (1987) for application to galaxy clusters (Bottinelli et al. 1987). It was first denounced by Sandage (1988) in application to the PL relation and re-discussed later by Lanoix et al. (1999a). The sample to which we are applying the PL relation must be statistically repre-sentative of the calibrators themselves. Indeed, due to the intrinsic scatter of the PL relation, there is a given dis-tribution of absolute magnitudes at a given period. At increasing distances the fainter end of this distribution is progressively missed and the distribution of the actual sample changes. Restricting the sample to Cepheids with a period larger than a given limiting period reduces this bias. The limiting period depends on a first estimate of the distance, on the apparent limiting magnitude and on the characteristics of the PL relation (dispersion, slope and zero-point). In fact, the full theory of Teerikorpi is applicable. The method is much more complete than the rough rule of thumb used as a quick approach in an ap-plication in which a detailed treatment was not needed. However, we want to derive final distance moduli and the precise bias correction must be used. Note that the slope and zero point of the PL relation are needed but only as second order terms and thus, the uncertainties mentioned about their choice do not present any significant difficulty (this will be confirmed in Sect. 4.3). The incompleteness
bias will be corrected using the precepts given by Teerikorpi (1987).
In Sect. 2 we will describe the material used for this study: the calibrating sample by GFG and our extragalac-tic Cepheid database (Lanoix et al. 1999b).
In Sect. 3 we describe the “sosie” method and give the basic equation for the calculation of the distance modulus of an extragalactic Cepheid.
In Sect. 4 we give the results obtained for 1840 Cepheids belonging to 36 nearby galaxies described in the previous section. We also discuss these results and compare them with those recently published by Freedman et al. (2001).
2. Observational material
The guideline in the constitution of the observational ma-terial is the selection of the most secure observations. This leads us to reject some data, as explained below, both galactic and extragalactic.
2.1. The list of galactic Cepheids
The starting point of our study is the choice of the galac-tic Cepheids used for the calibration. We adopt the list given in Gieren et al. (Table 3 in GFG) but we rejected three Cepheids (EV Sct, SZ Tau and QZ Nor) because they do not pulsate in the fundamental mode (they are overtone Cepheids). They correspond to the three lowest periods of the list. Because we use only the V and I pho-tometric bands, three Cepheids are also rejected (CS Vel, GY Sge and S Vul) because they do not have I-band mag-nitude. Thus, 28 Cepheids remain. Their distance moduli
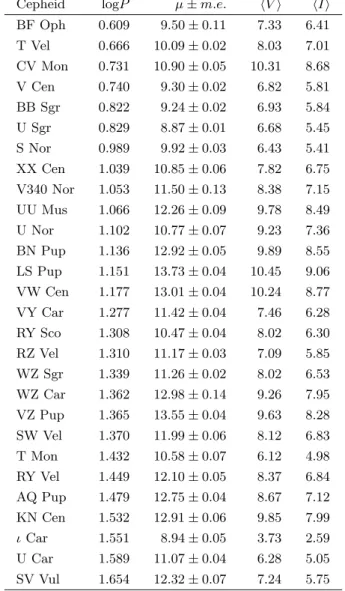
Table 2. Adopted calibrating sample of galactic Cepheids.
Column 1: Name of the galactic Cepheid; Col. 2: log of the period (P in days); Col. 3: adopted distance modulus and its mean error according to Gieren et al. (1998); Col. 4: Mean V -band apparent magnitude; Col. 5: Mean I-band apparent magnitude.
Cepheid logP µ± m.e. hV i hIi BF Oph 0.609 9.50± 0.11 7.33 6.41 T Vel 0.666 10.09± 0.02 8.03 7.01 CV Mon 0.731 10.90± 0.05 10.31 8.68 V Cen 0.740 9.30± 0.02 6.82 5.81 BB Sgr 0.822 9.24± 0.02 6.93 5.84 U Sgr 0.829 8.87± 0.01 6.68 5.45 S Nor 0.989 9.92± 0.03 6.43 5.41 XX Cen 1.039 10.85± 0.06 7.82 6.75 V340 Nor 1.053 11.50± 0.13 8.38 7.15 UU Mus 1.066 12.26± 0.09 9.78 8.49 U Nor 1.102 10.77± 0.07 9.23 7.36 BN Pup 1.136 12.92± 0.05 9.89 8.55 LS Pup 1.151 13.73± 0.04 10.45 9.06 VW Cen 1.177 13.01± 0.04 10.24 8.77 VY Car 1.277 11.42± 0.04 7.46 6.28 RY Sco 1.308 10.47± 0.04 8.02 6.30 RZ Vel 1.310 11.17± 0.03 7.09 5.85 WZ Sgr 1.339 11.26± 0.02 8.02 6.53 WZ Car 1.362 12.98± 0.14 9.26 7.95 VZ Pup 1.365 13.55± 0.04 9.63 8.28 SW Vel 1.370 11.99± 0.06 8.12 6.83 T Mon 1.432 10.58± 0.07 6.12 4.98 RY Vel 1.449 12.10± 0.05 8.37 6.84 AQ Pup 1.479 12.75± 0.04 8.67 7.12 KN Cen 1.532 12.91± 0.06 9.85 7.99 ι Car 1.551 8.94± 0.05 3.73 2.59 U Car 1.589 11.07± 0.04 6.28 5.05 SV Vul 1.654 12.32± 0.07 7.24 5.75
are adopted directly from Table 5 given by GFG. Only three Cepheids have a mean error in their distance mod-ulus larger than 0.1 mag. We give in Table 2 the adopted calibrating sample of galactic Cepheids.
2.2. The list of extragalactic Cepheids
In 1999 we have constructed an Extragalactic Cepheid database (Lanoix et al. 1999b) by collecting 3031 pho-tometric measurements of 1061 Cepheids located in 33 galaxies. This list has been updated. Especially, the V and I band measurements by Udalski et al. (OGLE sur-vey, 1999) were added for the LMC from the data available through [astroph/9908317]. The new database contains 6685 measurements for 2449 Cepheids in 46 galaxies. In order to make this compilation available, the full contents
of the extragalactic part will be published in electronic form for the A&A archives at CDS. A description is given in the Annex.
In this database, each light curve has been inspected in order to describe the main features. In the present study only light curves considered as “Normal” are used2. We
reject all peculiar light curves including light curves clas-sified as “low amplitude” because they are often associated with overtone Cepheids.
Only the mean V and I band magnitudes are kept. When several magnitudes are averaged from different sources we keep the mean only if the mean error is less than 0.05 mag. It is to be noted that HST measurements of seven galaxies3have been analyzed by two independent
groups. This leads to two different sets of magnitudes. Independent treatment of both sets shows that the dis-tance modulus differs by less than 0.1 mag, except for IC4182 for which the difference is 0.28 mag (Lanoix, pri-vate communication). Because we have no means to decide which set is the best we decided to keep them both.
The final catalogue (Table 3) results in 1840 extra-galactic Cepheids. They belong to 36 galaxies, 27 of which come from HST observations and 9 from ground-based ob-servations. The full Table is available in electronic form in the A&A archives at CDS.
3. Method of sosie
The method of “sosie” was introduced (Paturel 1984) to avoid the problem encountered in the practical use of the Tully-Fisher relation (Tully & Fisher 1977), a linear rela-tion between the absolute magnitude of a galaxy and its 21-cm line width. Here we are in similar conditions with a linear relationship between the absolute magnitude and an observable parameter, the logarithm of the period. In French, the word “sosie” refers to someone who looks very similar to someone else without being necessarily genet-ically related. Here two Cepheids will be considered as “sosie” if their light curves have the same shape and if they have the same period (within a given error). Because of the selection based on the shape of the light curve we will consider that all Cepheids of our sample pulsate in the fundamental mode. They all obey the same P–L relation. We write the distance modulus of a calibrating Cepheid and of an extragalactic Cepheid through a uni-versal PL relation. The calibrating Cepheid is identified with subscripts “c” and no subscript for the extragalactic one. Presently, we assume thatboth stars have the same
2
Lanoix et al. give eight classes of light curves: “Normal”, “Symetrical”, “Bumpy”, “Scattered”, “Overtone”, “Low am-plitude”, “Peculiar”, “No curve”. A “Normal” light curve is characterized by a non-symetrical variation: a fast increase and a slower decrease.
3 IC 4182, NGC 3368, NGC 3627, NGC 4496A, NGC 4536,
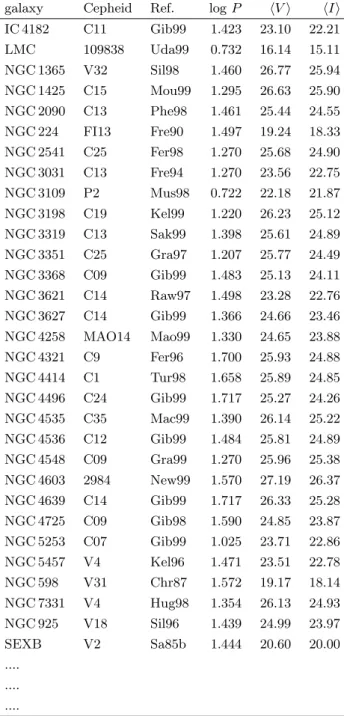
Table 3. Sample of extragalactic Cepheids. Column 1: Name
of the host galaxy; Col. 2: Name of the Cepheid according to the following reference; Col. 3: Reference (coded) from which the Cepheid name is taken; Col. 4: log of the period (P in days); Col. 5: Mean V -band apparent magnitude; Col. 6: Mean I-band apparent magnitude. Only a part of the table is given. The rest is available in electronic form.
galaxy Cepheid Ref. log P hV i hIi IC 4182 C11 Gib99 1.423 23.10 22.21 LMC 109838 Uda99 0.732 16.14 15.11 NGC 1365 V32 Sil98 1.460 26.77 25.94 NGC 1425 C15 Mou99 1.295 26.63 25.90 NGC 2090 C13 Phe98 1.461 25.44 24.55 NGC 224 FI13 Fre90 1.497 19.24 18.33 NGC 2541 C25 Fer98 1.270 25.68 24.90 NGC 3031 C13 Fre94 1.270 23.56 22.75 NGC 3109 P2 Mus98 0.722 22.18 21.87 NGC 3198 C19 Kel99 1.220 26.23 25.12 NGC 3319 C13 Sak99 1.398 25.61 24.89 NGC 3351 C25 Gra97 1.207 25.77 24.49 NGC 3368 C09 Gib99 1.483 25.13 24.11 NGC 3621 C14 Raw97 1.498 23.28 22.76 NGC 3627 C14 Gib99 1.366 24.66 23.46 NGC 4258 MAO14 Mao99 1.330 24.65 23.88 NGC 4321 C9 Fer96 1.700 25.93 24.88 NGC 4414 C1 Tur98 1.658 25.89 24.85 NGC 4496 C24 Gib99 1.717 25.27 24.26 NGC 4535 C35 Mac99 1.390 26.14 25.22 NGC 4536 C12 Gib99 1.484 25.81 24.89 NGC 4548 C09 Gra99 1.270 25.96 25.38 NGC 4603 2984 New99 1.570 27.19 26.37 NGC 4639 C14 Gib99 1.717 26.33 25.28 NGC 4725 C09 Gib98 1.590 24.85 23.87 NGC 5253 C07 Gib99 1.025 23.71 22.86 NGC 5457 V4 Kel96 1.471 23.51 22.78 NGC 598 V31 Chr87 1.572 19.17 18.14 NGC 7331 V4 Hug98 1.354 26.13 24.93 NGC 925 V18 Sil96 1.439 24.99 23.97 SEXB V2 Sa85b 1.444 20.60 20.00 .... .... ....
metallicity and the same intrinsic color. We will see how to bypass this problem, later.
µc = moc− a log Pc− b, (1)
µ = mo− a log P − b (2)
mois the apparent mean magnitude in a given band. The
superscript “o” means “corrected for extinction”. If one selects an extragalactic Cepheid having the same period
as the calibrating one, i.e., log P = log Pc, the distance
modulus of the extragalactic Cepheid is then
µ = µc+ mo− moc. (3)
The distance modulus of the extragalactic Cepheid is de-duced without having to know the slope and zero-point of the PL relation.
In order to correct for extinction we apply the previous equation to two different bands and express the extinction term as a function of the color excess E = E(B− V ). In order to make the notations clearer we note the apparent magnitudes V and I for the two considered bands. From Eq. (3) one has:
µ = µc+ V − RVE− Vc+ RVEc (4) µ = µc+ I− RIE− Ic+ RIEc (5)
which can be written as
µ = µc+ V − Vc− RV(E− Ec) (6) µ = µc+ I− Ic− RI(E− Ec). (7)
Then, eliminating E− Ec between the two previous
equa-tions we obtain: µ = µc+ (V − Vc)−RRVI(I− Ic) 1−RV RI · (8)
This is the desired equation. It can be written in a more el-egant manner by using the reddening-free Wesenheit func-tion (Van den Bergh 1968):
W = V − (RV/RI).I
1− (RV/RI)
(9)
µ = µc+ W − Wc. (10)
In practice, the intrinsic color is not known and this equa-tion is valid only for Cepheids of the same intrinsic color and metallicity. Thus, for a true sample, we will write it as (see the discussion below):
hµi = µc+hW − Wci· (11)
W is an observable quantity. Then, the mean distance
modulus of a sample of Cepheids which have the same pe-riod of pulsation as a calibrating Cepheid can be obtained directly from Eq. (11).
The physical relationship in this result is a Period-Luminosity-Color relation. This means that we should search for sosie of calibrators by considering both their similarity in log P and intrinsic color Co. But the intrinsic
color is not observable. Thus, Eq. (11) must be considered as a statistical relation exactly as the PL relation. Because of the statistical relation between Coand log P , the
selec-tion in log P will guarantee that a calibrator Cepheid and its sosies have, on average, the same intrinsic color. So, the problem of the intrinsic color is partially bypassed. For the metallicity problem, the solution is to consider that the method is valid only for galaxies having nearly the same metallicity as the calibrating Cepheids. In the
Fig. 1. Comparison of standard distance moduli with those
calculated from the method of sosie. The solid line corresponds to a slope of one and a zero-point of zero. Open circles represent the points for which there is only one determination and then no standard deviation.
present paper this means that, stricto sensu, only galaxies with a nearly Solar metallicity can be considered as valid. In practice, we applied the method to different kinds of galaxies without noting strong metallicity dependence.
As a test, we apply the method to the calibrating sample itself. Indeed, some galaxies of the sample can be considered as sosie of another. Note that each calibrating Cepheid has at least itself as a sosie. Obviously, we will not consider this special case. We will accept two Cepheids as sosie when the difference of their log P is smaller than 0.07. With a PL slope of≈−3, this will give an uncertainty
≈0.2 mag. in the distance modulus. We adopt the ratio RV/RI = 1.69 because it corresponds to the most widely accepted one (it corresponds to a ratio of total-to-selective absorption AV/(AV − AI) = RV/(RV − RI) = 2.45).
In Table 4 we give the distance moduli obtained with Eq. (11) for 23 Cepheids which are sosie of another cali-brator. In Fig. 1 the comparison of the calculated distance moduli with the calibrating ones is given.
From a direct regression we find that the slope is not different from one (1.00± 0.03). The observed mean difference between the calculated distance modulus and its standard value is obtained together with its standard deviation:
hµsosie− µstandardi = −0.00 ± 0.24. (12)
The method does not introduce any systematic shift in the zero point. This means that the calibrating Cepheids
constitute a coherent system (at least for the 28 Cepheids
Table 4. Distance moduli we obtain with Eq. (11) for
28 Cepheids which are sosie of another calibrator. Column 1: Name of the galactic Cepheid; Col. 3: Distance modulus culated from Eq. (11); Col. 3: Standard deviation on the cal-culated distance modulus; Col. 4: Number of sosies (excluding its own case).
Cepheid µ std.dev. No.
T Vel 10.03 0.08 2 BF Oph 9.63 - 1 CV Mon 11.07 0.20 2 V Cen 8.93 - 1 U Sgr 8.65 - 1 BB Sgr 9.46 - 1 XX Cen 11.17 0.20 4 V340 Nor 11.22 0.21 4 S Nor 9.82 0.24 2 UU Mus 12.59 0.22 3 U Nor 10.73 0.40 5 BN Pup 13.00 0.23 3 LS Pup 13.31 0.11 3 VW Cen 13.14 0.19 2 RY Sco 10.81 0.13 6 RZ Vel 10.98 0.17 6 WZ Sgr 11.34 0.18 6 VY Car 11.46 0.19 3 WZ Car 13.04 0.20 5 VZ Pup 13.30 0.19 6 SW Vel 11.97 0.21 6 T Mon 10.73 0.32 4 RY Vel 12.19 0.31 2 AQ Pup 12.32 0.15 3 KN Cen 13.19 0.08 3 ι Car 8.65 0.09 2 U Car 11.38 0.46 3 SV Vul 11.39 - 1
used in the test). The observed standard deviation (0.24) is in agrement with the expected standard deviation 0.2. 4. Application to extragalactic Cepheids
4.1. Preliminary determination of extragalactic distance moduli
The method is applied to the 1840 Cepheids of Table 3. To accept two Cepheids as sosie, we still adopt the cri-terion | log P − log Pc| < 0.07 which guarantees that the
standard deviation is about 0.2 mag, assuming a PL slope of −3. We adopt the ratio RV/RI = 1.69 which corre-sponds to the first order terms proposed by Caldwell & Coulson (1987) and Laney & Stobie (1993). This is also the value adopted by Freedman et al. (2001), following Cardelli et al. (1987), for their HST key project about
Cepheids4. For each of the 36 host galaxies we plot the
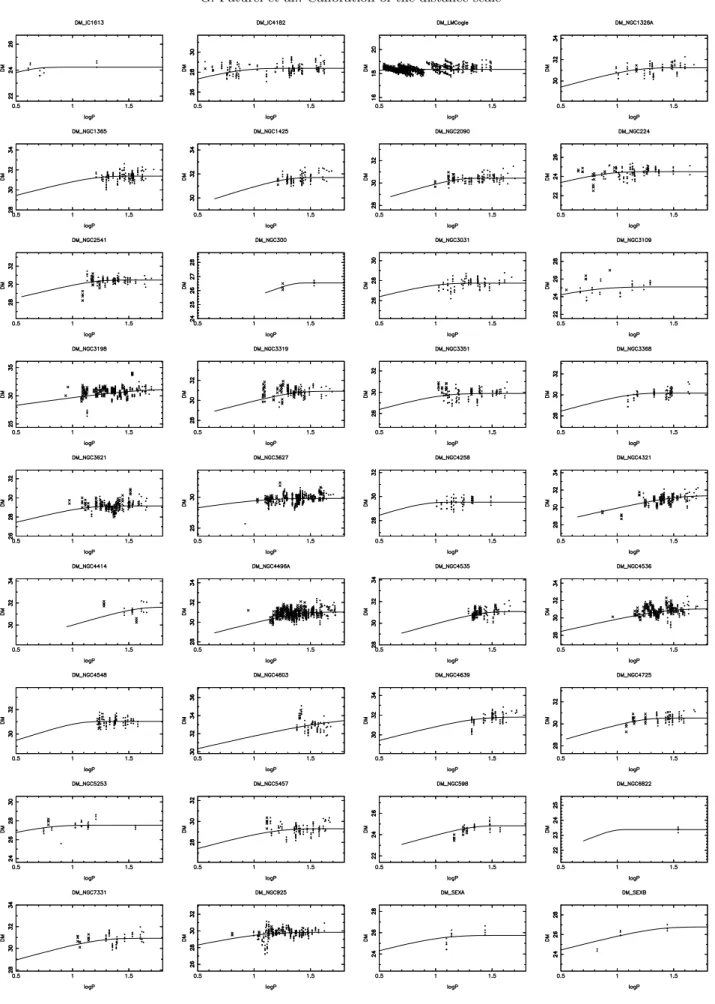
different distance moduli given by Eq. (11) as a function of log P . This result appears in Fig. 3.
The most important feature to point out is a signif-icant trend leading to higher distance moduli for long period Cepheids. This trend is visible for almost all the host galaxies. This is visible even for nearby galaxies if short periods are observed. For distant galaxies the trend is visible also at long periods. This was expected from the incompleteness bias we discussed elsewhere (e.g., Lanoix et al. 1999a). Another signature of the bias comes from the fact that only nearby galaxies (IC 1613, IC 4182, LMC, NGC 224, NGC 3109; NGC 5253) have Cepheids with short periods. This clearly depends on the limiting magnitude of the considered host galaxy. This important question is discussed in the following subsection.
4.2. Correction for the incompleteness bias
In order to get the proper distance moduli we have to correct for the incompleteness bias. In a previous paper (Lanoix et al. 1999a) we suggested using a rule of thumb to avoid this bias. The rule consists of using only log P values larger than a given limit log Pl. This limit is expressed as:
log Pl=
Vlim− µ − b − 2σ
a · (13)
Unfortunatelly, this method does not take into account the pieces of information contained in smaller periods. The detailed theory of this incompleteness bias was given by Teerikorpi (1987) in the study of galaxy clusters. The bias for extragalactic Cepheids is of the same nature because the Cepheids of a given galaxy are all at the same distance from us, like the galaxies of a cluster. Assuming that the dispersion σ at a given log P is constant, the basic equa-tions adapted to the problem of extragalactic Cepheids are the following (for the sake of simplicity we will consider only the V band):
The observed distance modulus µ will appear smaller than the true one. The bias ∆µ at a given log P is: ∆µ =−σ r 2 π e−A2 1 + erf (A) (14) where A = Vlim− µ − avlog P − bv σ√2 (15) and erf (x) = √2 π Z x 0 e−t2dt. (16)
In these equations avand bvare the slope and zero point of
the PL relation. We adopt the values found by GFG from their galactic sample, i.e., av =−3.037 and bv =−1.0215.
4
This value corresponds to a ratio of total-to-selective ab-sorption AV/(AV − AI) = RV/(RV − RI) = 2.45.
5 GFG give b
v=−4.058 because they consider the zero-point
at log P = 1.
Note that this requirement seems to reduce the interest of the sosie method because the slope and zero-point are needed anyway. In fact, the slope and zero-point appear only as parameters in a second order correction.
Two additional quantities are required to apply these equations:
– the limiting magnitude Vlim;
– the standard deviation σ of the PL relation at a con-stant log P .
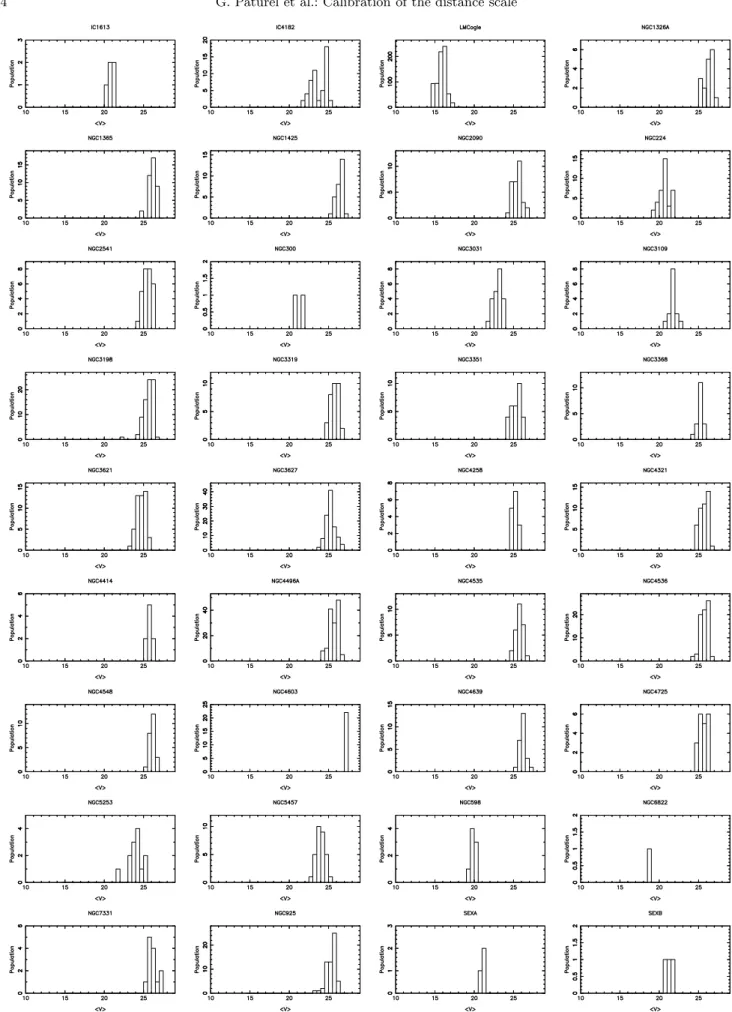
The first quantity is derived from the histograms ofhV i presented in Fig. 2 for each galaxy. We adopt for Vlim
the fainter edge of the most populated class. In a few cases where the histogram has no dominant class, we move the value by±0.5 mag. Vlimvalues do not change
signifi-cantly when one changes the binning size. Only one galaxy (NGC 5457) changed by more than the binning size, but its histogram shows two classes with almost the same pop-ulation. Nevertheless, the global influence of a change in
Vlim is discussed in Sect. 4.3 (Table 5) and we show its
influence on each individual galaxy in Table 6. The sec-ond quantity (σ) is derived by a direct linear regression on each plot of Fig. 3. The adopted quantities Vlimand σ
are listed in Cols. 2 and 3 of Table 6.
These parameters being fixed, there is no free param-eter to adjust the bias curve to the plot of Fig. 3 except the distance modulus µ itself which is then determined through an iterative process. The final bias curves are plot-ted in Fig. 3 for each host galaxy. In Col. 9 of Table 6 we give the number of remaining sosies after the cut-off at
Vlim. In Fig. 3 the points which are rejected by the cut-off
are represented by crosses.
4.3. Analysis of the results
Freedman et al. (2001) recently published their final study of their HST keyproject (HSTKP). They publish distance moduli calculated differently to those used here. They calibrate the PL relation with the LMC distance mod-ulus, assumed to be µ(LMC) = 18.5. They, adopt the
V - and I-band PL relations and an extinction law giving RV/RI= 1.69. In order to avoid bias, they cut their sam-ple at a given limiting period log Pl as explained above
and they apply a small (but still uncertain) correction for metallicity effect.
The comparisons between the HSTKP results and our solution is shown in Fig. 4 for 31 galaxies in common. There is a fair agreement. A direct regression between HSTKP distance moduli and ours leads to a slope which is not significantly different from one (1.017± 0.010) and a zero point difference which is not significantly different from zero (−0.11 ± 0.16). Assuming both determinations carry the same uncertainty, this means that our distances are good within 0.16/√2 = 0.1 mag. This is the internal uncertainty.
From a detailed check of Fig. 4 one sees a slight de-parture from a slope of one at large distances. The effect
Fig. 2. Histograms of apparenthV i magnitudes for each host galaxy. On the x-axis we give hV i. On the y-axis we give the
Fig. 3. Distance moduli (y-axis) from the method of sosie vs. log P (x-axis) for each host galaxy. Each point corresponds to an
extragalactic Cepheid which is sosie of a calibrating Cepheid. The solid curves correspond to the adopted bias curves (Sect. 4). The points rejected by the cut-off at Vlim are represented with crosses.
is, on average, 0.17 mag for µ larger than 30 mag. Two possibilities can explain this discrepancy:
– The PL relation of the GFG sample shows a departure from linearity for large log P . This effect is visible (see for instance Fig. 4 in GFG) even when one excludes the three overtone Cepheids (log P < 0.6). Judging by the error bars of individual points, this non-linearity seems real.
– The distance moduli of Freedman et al. may suffer from a small residual incompleteness bias. Using a simula-tion we have shown that it is difficult to remove the bias just by cutting the sample at a given log Pl. If
we refer to our Fig. 7 in Lanoix et al. (1999a), one can see that at large distances (µ > 32) the bias may reach 0.17 mag after the log P cutoff. At intermedi-ate distances (29 < µ < 32) the bias may still reach 0.08 mag.
Three external sources of uncertainty come from: (i) the adopted ratio RV/RI, (ii) the adopted limiting magnitude Vlimand (iii) from the adopted PL relation used for second
order bias correction. In order to check the stability of the solution, we repeated the previous calculations with an-other PL relation (the one found by GFG for LMC), with a variation of RV/RI by±0.2 and a variation of Vlim by ±0.5 mag. The results are summarized in Table 5, where
we give the mean shift between distance moduli from dif-ferent solutions and the adopted mean distance moduli (reference solution). One can see that the choice of the PL relation has no actual influence on the result. However, a change of RV/RI by±0.1 may change the mean distance modulus by nearly 0.2 mag and a change of Vlimby 0.5 mag
may produce similar change. The influence of Vlimdepends
clearly on the actual distribution of magnitudes. For some galaxies the effect is negligible while it is large for some others. In order to give a better judgement of the stability of the distance modulus with respect to the adopted Vlim,
we give the changes ∆µ− when Vlimis reduced by 0.5 mag
(respectively, ∆µ+ when V
limis augmented by 0.5 mag).
The actual uncertainty (internal plus external) can thus reach 0.3 mag and may be more if our actual sources of uncertainty act in the same sense.
5. Conclusion
The distance scale can be calibrated using galactic Cepheids. LMC provides us with numerous Cepheids lo-cated at the same distance. This gives a way to derive an accurate slope for the Cepheid PL relation. But its low metallicity (with respect to most of the galaxies of the sample) is a cause of suspicion; we are not sure that this slope can be applied to all kinds of metallicity.
So, we preferred, in a first step, to calibrate the distance scale by using accurate distances of galactic Cepheids published by Gieren et al. (1998). These dis-tances are based on the geometrical Barnes-Evans method.
Table 5. Test of the stability of the results. We give the
depar-ture from our reference solution for: 1) a different PL relation (note that this PL relation is used only for the second order bias correction 2) several RV/RI ratios.
∆Vlim RV/RI av bv µ− µref 0.0 1.69 −2.769 −4.063 +0.03± 0.05 0.0 1.89 −3.037 −4.058 −0.22 ± 0.10 0.0 1.79 −3.037 −4.058 −0.12 ± 0.06 0.0 1.69 −3.037 −4.058 0 0.0 1.59 −3.037 −4.058 +0.17± 0.09 0.0 1.49 −3.037 −4.058 +0.45± 0.21 −0.50 1.69 −3.037 −4.058 +0.20± 0.27 −0.25 1.69 −3.037 −4.058 +0.09± 0.12 +0.25 1.69 −3.037 −4.058 −0.05 ± 0.08 +0.50 1.69 −3.037 −4.058 −0.08 ± 0.10
Fig. 4. Comparison of the distance moduli from Freedman
et al. (2001) and those from this paper. The general agree-ment is satisfactory but at large distances our distances become larger.
Further, we applied the concept of “sosie” (Paturel 1984) to extend distance determinations to extragalactic Cepheids without having to know either the slope or the zero-point of the PL relation. The distance moduli are ob-tained in a straightforward way. For the calibrating galac-tic Cepheids we checked the internal coherence from the same method.
The correction for the extinction is made by using two bands (V and I) according to the principles introduced by Freedman & Madore (1990). There is no need for color excess estimation.
Finally, the incompleteness bias is corrected according to the precepts introduced by Teerikorpi (1987). Without any free parameters (except the distance modulus itself), the bias curve calculated for each individual host galaxy fits very well the observed distance moduli. This gives us confidence in our final distance moduli. Nevertheless, the small departure from the measurements published recently by Freedman et al. (2001) at distances larger than 10 Mpc (µ = 30) must be clarified.
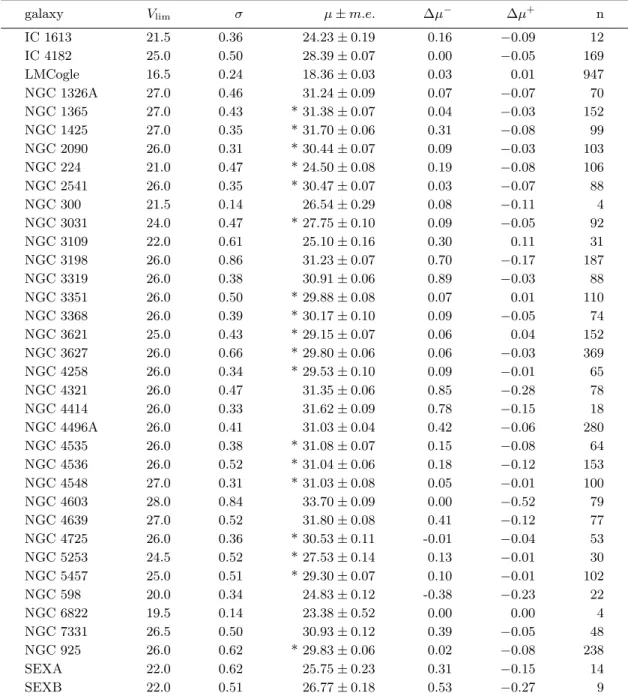
Table 6. Distance moduli calculated from this paper using the ratio RV/RI = 1.69. Column 1: Name of the host galaxy.
Column 2: The adopted limiting magnitude Vlim. Column 3: Standard deviation σ. Column 4: The adopted distance modulus
and its mean error. An asterisk marks the distance moduli of galaxies having nearly a Solar metallicity. Column 5: The change ∆µ− of the distance modulus when Vlim is reduced by 0.5 mag (i.e., a brighter limit). Column 6: The change ∆µ+ of the
distance modulus when Vlimis augmented by 0.5 mag (i.e., a fainter limit). Column 7: The number of sosie Cepheids after the
Vlimcut-off.
galaxy Vlim σ µ± m.e. ∆µ− ∆µ+ n
IC 1613 21.5 0.36 24.23± 0.19 0.16 −0.09 12 IC 4182 25.0 0.50 28.39± 0.07 0.00 −0.05 169 LMCogle 16.5 0.24 18.36± 0.03 0.03 0.01 947 NGC 1326A 27.0 0.46 31.24± 0.09 0.07 −0.07 70 NGC 1365 27.0 0.43 * 31.38± 0.07 0.04 −0.03 152 NGC 1425 27.0 0.35 * 31.70± 0.06 0.31 −0.08 99 NGC 2090 26.0 0.31 * 30.44± 0.07 0.09 −0.03 103 NGC 224 21.0 0.47 * 24.50± 0.08 0.19 −0.08 106 NGC 2541 26.0 0.35 * 30.47± 0.07 0.03 −0.07 88 NGC 300 21.5 0.14 26.54± 0.29 0.08 −0.11 4 NGC 3031 24.0 0.47 * 27.75± 0.10 0.09 −0.05 92 NGC 3109 22.0 0.61 25.10± 0.16 0.30 0.11 31 NGC 3198 26.0 0.86 31.23± 0.07 0.70 −0.17 187 NGC 3319 26.0 0.38 30.91± 0.06 0.89 −0.03 88 NGC 3351 26.0 0.50 * 29.88± 0.08 0.07 0.01 110 NGC 3368 26.0 0.39 * 30.17± 0.10 0.09 −0.05 74 NGC 3621 25.0 0.43 * 29.15± 0.07 0.06 0.04 152 NGC 3627 26.0 0.66 * 29.80± 0.06 0.06 −0.03 369 NGC 4258 26.0 0.34 * 29.53± 0.10 0.09 −0.01 65 NGC 4321 26.0 0.47 31.35± 0.06 0.85 −0.28 78 NGC 4414 26.0 0.33 31.62± 0.09 0.78 −0.15 18 NGC 4496A 26.0 0.41 31.03± 0.04 0.42 −0.06 280 NGC 4535 26.0 0.38 * 31.08± 0.07 0.15 −0.08 64 NGC 4536 26.0 0.52 * 31.04± 0.06 0.18 −0.12 153 NGC 4548 27.0 0.31 * 31.03± 0.08 0.05 −0.01 100 NGC 4603 28.0 0.84 33.70± 0.09 0.00 −0.52 79 NGC 4639 27.0 0.52 31.80± 0.08 0.41 −0.12 77 NGC 4725 26.0 0.36 * 30.53± 0.11 -0.01 −0.04 53 NGC 5253 24.5 0.52 * 27.53± 0.14 0.13 −0.01 30 NGC 5457 25.0 0.51 * 29.30± 0.07 0.10 −0.01 102 NGC 598 20.0 0.34 24.83± 0.12 -0.38 −0.23 22 NGC 6822 19.5 0.14 23.38± 0.52 0.00 0.00 4 NGC 7331 26.5 0.50 30.93± 0.12 0.39 −0.05 48 NGC 925 26.0 0.62 * 29.83± 0.06 0.02 −0.08 238 SEXA 22.0 0.62 25.75± 0.23 0.31 −0.15 14 SEXB 22.0 0.51 26.77± 0.18 0.53 −0.27 9
In order to bypass the uncertainty due to metallicity ef-fects it is suggested to consider only galaxies having nearly the same metallicity as the calibrating Cepheids (i.e. Solar metallicity). In Table 6 the distance moduli that can be considered as more secure are noted with an asterisk (∗). Galaxies with ∆µ larger than≈0.3 mag. or with small n do not receive this flag. For a given ratio RV/RI, the un-certainty of the distances is about 0.1 mag but the total uncertainty may be about 0.3 mag. The choice of a given
RV/RI ratio is a first source of uncertainty. The actual ratio depends on the extinction law in our Galaxy, on the
extinction law in the host galaxy and on the color of the considered Cepheid. For the future it would be interesting to search for a clue allowing us to decide which value is the best in a given direction for a Cepheid in a given host galaxy. The proper determination of the limiting magni-tude of the sample is a second source of uncertainty. It can be accurately determined only when a large number of Cepheids is available to provide us with good statistics. Presently, the calibration of the distance scale can barely be better than σµ = 0.3 mag. Thus, the uncertainty
on the Hubble constant, σ(H)≈ σµH/5 log e, cannot be better than about 10 km s−1Mpc−1.
Acknowledgements. We thank the HST teams for making their data available in the literature prior to the end of the project. We thank R. Garnier, J. Rousseau and P. Lanoix for having participated to the maintenance of our Cepheid database. We thank P. Teerikorpi for his comments and the anonymous ref-eree for very constructive remarks.
Appendix A: The extragalactic Cepheid database The description of this database was given by Lanoix et al. (1999b). Because the database is no longer available on the world-wide-web the present data are published in elec-tronic form in the A&A archives at CDS. All the data are made available, even when they are not used in the present paper, where only Normal Cepheids in V and I-bands are considered. Additional measurements were collected in-cluding the LMC ones by Udalski et al. (1999)6and those
by Gibson et al. (1998, 1999). Data are now available for 2449 Cepheids of 46 galaxies (instead of 1061 Cepheids of 33 galaxies).
The identification of a Cepheid is given on a first line as follows:
– the name of the host galaxy,
– the name of the Cepheid and the bibliographic code from where this name is taken,
– the adopted period (in log),
– The classification of the shape of the light curve, fol-lowing Lanoix et al. (1999b).
On this first line we also give the number of measurements attached to this Cepheid. Note that the Cepheid name for LMC is simply the Cepheid number from Udalski et al., without the field number (SC), that was not needed here (only three Cepheids appear with the same number in dif-ferent fields: 1, 16 and 19, but they are not in our list). We tried to keep the Cepheid name of the first discov-ery. This was not always done, e.g., the names given by Graham (1984) are referenced as Mad87 because of the renumbering adopted by Madore (1987).
On the following lines, individual measurements are given:
– the magnitude;
– the type of magnitude (mean, maximum, minimum, average) coded according to Lanoix et al.;
– the photometric bands (B, V , R, I ...) coded according to Lanoix et al. (1999b);
– the reference code. The full reference and the associ-ated code appears in the references.
A sample is given below to show how the data are organized.
6 Note that we kept 720 normal Cepheids among the 1182
available with log P > 0.5.
IC1613 V1 Fr88a 0.7480 N 8 21.36 mea B Fr88a 20.79 mea V Fr88a 20.36 mea R Fr88a 20.14 mea I Fr88a 20.50 max B Sa88a 22.03 min B Sa88a 21.27 ave B Sa88a 21.39 mea B Sa88a IC1613 V20 Fr88a 1.6220 B 5 16.66 H Ala84 18.98 max B Sa88a 20.71 min B Sa88a 19.85 ave B Sa88a 19.90 mea B Sa88a IC1613 V22 Fr88a 2.1650 S 9 15.47 H Ala84 19.10 mea B Fr88a 17.75 mea V Fr88a 17.14 mea R Fr88a 16.62 mea I Fr88a 17.74 max B Sa88a 20.44 min B Sa88a 19.09 ave B Sa88a 19.09 mea B Sa88a IC1613 V25 Fr88a 0.9600 B+ 5 18.62 H Ala84 20.10 max B Sa88a 21.84 min B Sa88a 20.97 ave B Sa88a 20.87 mea B Sa88a IC1613 V53 Fr88a 0.5900 O 3 21.13 max B Car90 21.70 min B Car90 21.46 mea B Car90 ... ... ... References
Alves, D. R., & Cook K. H. 1995, AJ, 110, 192 (Alv95) Bono, G., Castellani, V., & Marconi, M. 2000, ApJ, 529, 293 Bottinelli, L., Fouqu´e, P., Gouguenheim, L., et al. 1987, A&A,
181, 1
Caldwell, J. A. R., & Coulson, I. M. 1987, AJ, 93, 1090 Capaccioli, M., Piotto, G., & Bresolin, F. 1992, AJ, 103, 1151
(Cap92)
Cardelli, J. A., Clayton, G. C., & Mathis, J. S. 1989, ApJ, 345, 245
Carlson, G., & Sandage, A. 1990, ApJ, 352, 587 (Car90) Christian, C. A., & Schommer, R. A. 1987, AJ, 93, 557 (Chr87) Cook, K. H., & Aaronson, M. 1986, ApJ, 301, L45 (Coo86) Feast, M. W., & Catchpole, R. M. 1997, MNRAS, 286, L1 Ferrarese, L., Freedman, W. L. Hill, R. J., et al. 1996, ApJ,
464, 568 (Fer96)
Ferrarese, L., Bresdin, F., Kennicutt, R. C. Jr., et al. 1998, ApJ, 507, 655 (Fer98)
Freedman, W. L., Hughes, S. M., Madore, B. F., et al. 1994, ApJ, 427, 628 (Fre94)
Freedman, W. L., & Madore B. F. 1988, ApJ, 332, L63 (Fr88b) Freedman, W. L., & Madore, B. F. 1990, ApJ, 365, 186 (Fre90) Freedman, W. L., Madore, B. F., Gibson, B. K., et al. 2001,
ApJ, 553, 47
Freedman, W. L., Madore, B. F., Hawley, S. L., et al. 1992, ApJ, 396, 80 (Fre92)
Freedman, W. L., Wilson, C. D., & Madore, B. F. 1991, ApJ, 372, 455 (Fre91)
Freedman, W. L. 1988, ApJ, 326, 691 (Fr88a)
Gallart, C., Aparicio, A., & Vichez, J. M. 1996, AJ, 112, 1928 (Gal96)
Gibson, B. K., et al. 1998, [astro-ph981003] (unpublished) (Gib98)
Gibson, B. K., Hughes, S. M. G., Stetson, P. B., et al. 1999, ApJ, 512, 48 (Gib99)
Gieren, W., Fouqu´e, P., & Gomez, M. 1998, ApJ, 496, 17 (GFG)
Graham, J. A., Phelps, R. L., Freedman, W. L., et al. 1997, ApJ, 477, 535 (Gra97)
Graham, J. A. 1984, AJ, 89, 1332 (Gra84)
Graham, J. A., Ferrarese, L., Freedman, W. L., et al. 1999, ApJ, 516, 626 (Gra99)
Hoessel, J. G., Abbott, J., Saha, A., et al. 1990, AJ, 100, 1151 (Hoe90)
Hoessel, J. G., Saha, A., & Danielson, G. E. 1998, AJ, 115, 573 (Hoe98)
Hoessel, J. G., Saha, A., Krist, J., et al. 1994, AJ, 108, 645 (Hoe94)
Hughes, S. M. G., Han, M., Hoessel, J., et al. 1998, ApJ, 501, 32 (Hug98)
Kayser, S. E. 1967, AJ, 72, 134 (Kay67)
Kelson, D. D., Illingworth, G. D., Freedman, W. F., et al. 1996, ApJ, 463, 26 (Kel96)
Kelson, D. D., Illingworth, G. D., Saha, A., et al. 1999, ApJ, 514, 614, (Kel99)
Kinman, T. D., Mould, J. R., & Wood, P. R. 1987, AJ, 93, 833 (Kin87)
Laney, C. D., & Stobie, R. S. 1994, MNRAS, 266, 441 Lanoix, P., Paturel, G., & Garnier, R. 1999, MNRAS, 308, 969 Lanoix, P., Paturel, G., Garnier, R., et al. 1999a, ApJ, 517,
188
Lanoix, P., Paturel, G., Garnier, R., et al. 1999b, Astron. Nach., 320, 1
Lutz, T. E., & Kelker, D. H. 1973, PASP, 85, 573
Macri, L. M., Huchra, J. P., Stetson, P. B., et al. 1999, ApJ, 521, 155 (Mac99)
Madore, B. F., Mc Alary, C. W., Mc Laren, R. A., et al. 1985, ApJ, 294, 560 (Mad85)
Madore, B. F., Welch, D. L., Mc Alary, C. W., et al. 1987, ApJ, 320, 26 (Mad87)
Maoz, E., Newman, J. A., Ferrarese, L., et al. 1999, Nature, 401, 351 (Mao99)
Mc Alary, C. W., Madore, B. F., McGonegal, R., McLaren, R. A. & Welch, D. L. 1983, ApJ, 273, 539 (Ala83) Mc Alary, C. W., & Madore, B. F. 1984, ApJ, 282, 101
(McA84)
Mc Alary, C. W., Madore, B. F., & Davis, L. E. 1984, ApJ, 276, 487 (Ala84)
Mould, J. R., Hughes, S. M. G., Stetson, P. B., et al. 2000, ApJ, 528, 655 (Mou99)
Mould, J. R. 1987, PASP., 99, 1127 (Mou87)
Musella, I., Piotto, G., & Capaccioli, M. 1997, AJ, 114, 976 (Mus98)
Newman, J. A., Zepf, E., Davis, M., et al. 1999, ApJ, 523, 506 (New99)
Paturel, G. 1984, ApJ, 282, 382
Phelps, R. L., Sakai, S., Freedman, W. L., et al. 1998, ApJ, 500, 763 (Phe98)
Piotto, G., Capaccioli, M., & Pellegrini, C. 1994, A&A, 287, 371 (Pio94)
Pont, F., Charbonnel, C., Lebreton, Y., Mayor, M., & Turon, C. 1997, ESA Symp. Hipparcos – Venice’97, ESA SP-402 (ESA Noordwijk), 699
Prosser, C. F., Kennicutt, R. C. Jr, Bresolin, F., et al. 1999, ApJ, 525, 80 (Pro99)
Rawson, D. M., Macri, L. M., Mould, J. R., et al. 1997, ApJ, 490, 517 (Raw97)
Saha, A., Hoessel, J. G., Krist, J., et al. 1996, AJ, 111, 197 (Sh96b)
Saha, A., Labhardt, L., Schwengeler, H., et al. 1994, ApJ, 425, 14 (Sah94)
Saha, A., Sandage, A., Labhardt, L., et al. 1995, ApJ, 438, 8 (Sah95)
Saha, A., Sandage, A., Labhardt, L., et al. 1996, ApJ, 466, 55 (Sh96a)
Saha, A., Sandage, A., Labhardt, L., et al. 1996, ApJS, 107, 693 (Sh96c)
Saha, A., Sandage, A., Tamann, G. A., et al. 1999, ApJ, 522, 802 (Sah99)
Saha, A., Sandage, A., Labhardt, L., et al. 1997, ApJ, 486, 1 (Sah97)
Sakai, S., Ferrarese, L., Kennicutt, R. C., et al. 1999, ApJ, 523, 540 (Sak99)
Sandage, A., & Carlson, G. 1985a, AJ, 90, 1464 (Sa85a) Sandage, A., & Carlson, G. 1985b, AJ, 90, 1019 (Sa85b) Sandage, A. 1988, PASP, 100, 935 (Sa88a)
Sandage, A., & Carlson, G. 1988, AJ, 96, 1599 (Sa88b) Sandage, A. 1988, PASP, 100,935
Silbermann, N. A., Harding, P., Madore, B. F., et al. 1996, ApJ, 470, 1 (Sil96)
Silbermann, N. A., Harding, P., Ferrarese, L., et al. 1999, ApJ, 515, 1 (Sil98)
Tamman, G., & Sandage, A. 1968, ApJ, 151, 825 (Tam68) Tanvir, N. R., Shanks, T., Ferguson, H. C., et al. 1995, Nature,
337, 27 (Tan95)
Teerikorpi, P. 1987, A&A, 173, 39
Tolstoy, E., Saha, A., Hoessel, J. G., et al. 1995, AJ, 109, 579 (To95a)
Tolstoy, E., Saha, A., Hoessel, J. G., et al. 1995, AJ, 110, 1604 (To95b)
Tully, R. B., & Fisher, J. R. 1977, A&A, 54, 661
Turner, A., Ferrarese, L., Saha, A., et al. 1998, ApJ, 505, 207 (Tur98)
Udalski, A., Szymanski, M., Kubiak, M., et al. 1999, Acta Astron., 49, 201 [astro/ph9908317] (Uda99)
Van den Bergh, S. 1968, R. A. S. C. Jour., 62, 145 Visvanathan, N. 1989, ApJ, 346, 629 (Vis89) Walker, A. R. 1988, PASP, 100, 949 (Wal88)
Welch, D. L., McAlary, C. W., Mclaren, R. A., et al. 1986, ApJ, 305, 583 (Wel86)