See discussions, stats, and author profiles for this publication at: https://www.researchgate.net/publication/281629865
Which Causal Relationships Can Reject or Accept the Significant Optimum
Distribution Ratios Phases in the Triple Jump
Article · January 2015 DOI: 10.11648/j.ajss.20150304.12 CITATIONS 4 READS 490 7 authors, including:
Some of the authors of this publication are also working on these related projects:
study some biomechanical variables in the steps of supports of the triple jump and their relationship with the digital levelView project
footballView project Mohammed Zerf
Université Abdelhamid Ibn Badis Mostaganem
95PUBLICATIONS 68CITATIONS
SEE PROFILE
Mokkedes Moulay Idriss
instiut d'éducation physique et sport.
16PUBLICATIONS 13CITATIONS SEE PROFILE Bengoua Ali Mostaganem University 36PUBLICATIONS 27CITATIONS SEE PROFILE
Bendahmane Mohammed Nasreddine Nasreddine
Université Abdelhamid Ibn Badis Mostaganem
7PUBLICATIONS 10CITATIONS
SEE PROFILE
All content following this page was uploaded by Mohammed Zerf on 10 September 2015.
doi: 10.11648/j.ajss.20150304.12
ISSN: 2330-8559 (Print); ISSN: 2330-8540 (Online)
Which Causal Relationships Can Reject or Accept the
Significant Optimum Distribution Ratios Phases in the
Triple Jump
Zerf Mohammed, Mokkedes Moulay Idris, Bengoua Ali, Bendahmane Med Nasreddin
Physical and Sports Education Institute Mostaganem, Sports Training department, Laboratory Optimization of Programs in Eps, University Abdel Hamid Ibn Badis Mostaganem, Mostaganem, Algeria
Email address:
biomeca.zerf@outlook.com (Z. Mohammed), mi_mokkedes@hotmail.com (M. M. Idris), bengoua67@yahoo.fr (B. Ali), bendahmane_m@yahoo.fr (B. M. Nasreddin)
To cite this article:
Zerf Mohammed, Mokkedes Moulay Idris, Bengoua Ali, Bendahmane Med Nasreddin. Which Causal Relationships CanReject or Accept the Significant Optimum Distribution Ratios Phases in the Triple Jump. American Journal of Sports Science. Vol. 3, No. 4, 2015, pp. 73-78. doi: 10.11648/j.ajss.20150304.12
Abstract:
The objectives of this study were to detect some causal relationships in significant differences optimumdistribution ratios phases that the most sources agree that it varies from athlete to the other. Our subjects were the finalists (2009-2011) with Hop-dominated technique, 17 meter as minimum performance and the best performance in the world triple Jump with Jump-dominated technique, 18 meter as minimum performance in other comparison. In the absence of technological means in Algeria, our study explores the reports (IAAF) in order to answer: Which causal relationship explained or dismissed the Optimum distribution ratios phases in the two-practiced dominant technique (Hop and Jump) to achieve results? For this, we chose the analysis of the Regression to be compared, the impact phase distributions (hop, step and jump) charged with the results achieved in their test. Our goal for this research is: Improve search through the Optimum use of data results champions. Find a causal relationship between dominant technique and results as research topic in Optimum ratios phases. The most important results obtained: Optimum distribution ratios phases in the hop-dominated technique varies from athlete to other because the respect of the model theories Russian requires the Stride length of the three phases typically to (39%: 30%: 31%).Optimum distribution ratios phases in the jump-dominated technique should be us as optimum phase ratio in condition that the Stride length of the three phases typically to (34%29%37%).
Keywords: Dominated Technique, Distribution Phases, Prediction in Triple Jump
1. Introduction
The triple Jump is composed of three take-off phases (Hop, Step, and Jump), each plays an important role, as they require the jumper to tolerate extremely high forces of impact and to maintain a high level of horizontal velocity. (Abeer Eissa, 2014) That the Biomechanical Studies have been conducted to identify the factors affecting the performance of the triple jump in an attempt to determine the optimum techniques for individual athletes (Bing Yu, PhD, 1982).
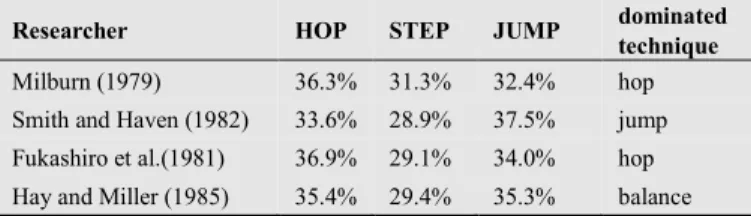
Below is a list of researchers and the means of the percent phase contributions they found for elite male triple jumpers as modality of their technique practiced.
Table 1. The mean contribution of the phase distances reports in the similar studies.
Researcher HOP STEP JUMP dominated
technique
Milburn (1979) 36.3% 31.3% 32.4% hop
Smith and Haven (1982) 33.6% 28.9% 37.5% jump Fukashiro et al.(1981) 36.9% 29.1% 34.0% hop Hay and Miller (1985) 35.4% 29.4% 35.3% balance
(Clifford Larkins) said that the findings listed above, the mean contribution of the phase distances varied with each study and Hay& Miller's (1985) confirm that optimal phase ratio is different from athlete to other, (Bing Yu, PhD, 1982) for that the Velocity conversion coefficient is the determinant
74 Zerf Mohammed et al.: Which Causal Relationships Can Reject or Accept the Significant Optimum Distribution Ratios Phases in the Triple Jump
of optimum phase ratio. (Paul Brice) The hop is the first phase of the triple jump and objective in it is to achieve horizontal vertical velocity because the hop leg would-be used for two other phases. Moreover, for our research, we agree with (Hui Liu, 2012) Phase ratio is a measure of effort distribution in the triple jump. Hop-dominant, balanced, and jump-dominant techniques were three triple jump techniques defined based on phase ratio and confirmation of (Ed Jacoby, 2009)that the transition of phases neither any errors are related to other thing that defeat technique modality who is related to the causal relationships in the rejection or acceptance significant optimum distribution ratios phases in the triple jump.
In conclusion, our purpose of this modest study:
Is there any causal relationship that can be used to rejection or acceptance significant optimum distribution ratios phasesin the hop-dominated technique?
Is there any causal relationship that can be used to rejection or acceptance significant optimum distribution ratios phasesin the jump-dominated technique?
For that, we have chosen the Kinematics assessment in order to obtain some objective information, based in the technique theory distributions ratios. (MIHAI IlIE, 2009)
2. Methods and Means Population
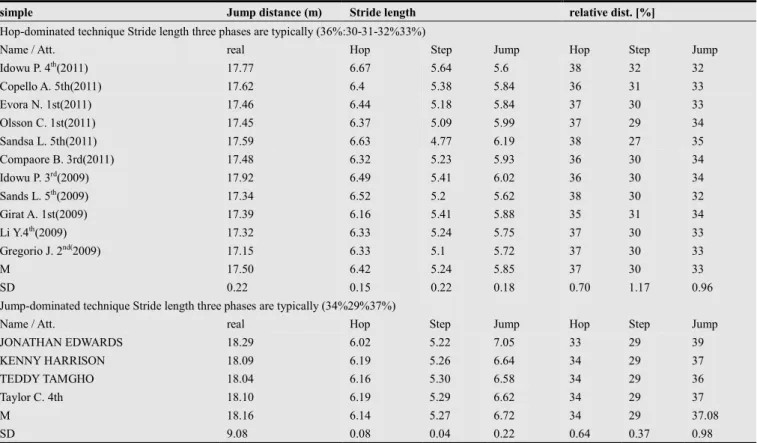
Table 2. Showsthe results (IAAF, 2011) performances of our samples.simple Jump distance (m) Stride length relative dist. [%]
Hop-dominated technique Stride length three phases are typically (36%:30-31-32%33%)
Name / Att. real Hop Step Jump Hop Step Jump
Idowu P. 4th(2011) 17.77 6.67 5.64 5.6 38 32 32 Copello A. 5th(2011) 17.62 6.4 5.38 5.84 36 31 33 Evora N. 1st(2011) 17.46 6.44 5.18 5.84 37 30 33 Olsson C. 1st(2011) 17.45 6.37 5.09 5.99 37 29 34 Sandsa L. 5th(2011) 17.59 6.63 4.77 6.19 38 27 35 Compaore B. 3rd(2011) 17.48 6.32 5.23 5.93 36 30 34 Idowu P. 3rd(2009) 17.92 6.49 5.41 6.02 36 30 34 Sands L. 5th(2009) 17.34 6.52 5.2 5.62 38 30 32 Girat A. 1st(2009) 17.39 6.16 5.41 5.88 35 31 34 Li Y.4th(2009) 17.32 6.33 5.24 5.75 37 30 33 Gregorio J. 2nd(2009) 17.15 6.33 5.1 5.72 37 30 33 M 17.50 6.42 5.24 5.85 37 30 33 SD 0.22 0.15 0.22 0.18 0.70 1.17 0.96
Jump-dominated technique Stride length three phases are typically (34%29%37%)
Name / Att. real Hop Step Jump Hop Step Jump
JONATHAN EDWARDS 18.29 6.02 5.22 7.05 33 29 39 KENNY HARRISON 18.09 6.19 5.26 6.64 34 29 37 TEDDY TAMGHO 18.04 6.16 5.30 6.58 34 29 36 Taylor C. 4th 18.10 6.19 5.29 6.62 34 29 37 M 18.16 6.14 5.27 6.72 34 29 37.08 SD 9.08 0.08 0.04 0.22 0.64 0.37 0.98
From the table 2 through the results of the mean of Stride length we can judge two dominated technique hop (best in the performances (2009-2011) and Jump (best in the world performances triple Jump)
3. Research Tools
Explore the literature on everything related to the subject of our research.
Explore the reports, quantitative analysis of our sample Explore the reports, qualitative in similar studies Explore the biomechanical analysis using in the similar
studies
Explore the statistical analysis using in the similar studies.
4. Results and Discussion
Is there any causal relationship that can be used to rejection or acceptance significant optimum distribution ratios phases in the hop-dominated technique?
We have chosen Regression as model statically Table 3. (a): Variables Entered/Removeda.
Model Variables Entered Variables Removed Method
1
Distance phase Jump, distance phase step, distance phase hopb
. Enter
a. Dependent Variable: Jump distance b. All requested variables entered.
which is, used in a manner model 1 is the Enter where the program has shown the introduce of all the independent variables in the equation of multiple linear regression.
Table 3. (b): Model Summaryb.
Model R R Square Adjusted R
Square
Std. Error of the Estimate
1 .991a .981 .973 .0335
a. Predictors: (Constant), distance phase jump, distance phase step, distance phase hop
b. Dependent Variable: Jump distance
Table 3 (b), we note that the three values of the simple correlation and the coefficient(R Square- Adjusted R Square), are significant in the Predictorsused in Model 1. Form that we confirmed the independent explanatory variables phases (distance jump, distance step, distance hop), was able to explain the changes in the Dependent Variable Jump distance in practiced technique hop dominate phase required and the rest (0.03) is attributable to other factors.
Table 3. (c): ANOVAa. Model Sum of Squares df Mean Square F Sig. Regression .460 3 .153 121.235 .000b Residual .009 8 .001 Total .469 11
a. Dependent Variable: Jump distance
b. Predictors: (Constant), distance phase jump, distance phase step, distance phase hop
As it noted in Table 3 (c) of the variables Predictors includes in analysis to defined the explanatory power of the model 1 based by the calculi of F.
As can be seen from the High explanatory power of multiple linear regression model from a statistical point the F test High moral (P <0.001), from that we confirms the High moral explanatory power of the modelschosen of the multiple linear regression statistical.
Table 3. (d): Coefficientsa. Model Unstandardized Coefficients Standardized Coefficients t Sig. B Std. Error Beta 1 (Constant) 1.158 .864 1.340 .222 distance phase hop .904 .076 .617 11.851 .000 distance phase step .874 .060 .907 14.489 .000 distance phase jump 1.017 .076 .832 13.308 .000
a. Dependent Variable Jump distance
We conclude from the Table3 (d) that the independent variables were significant from a statistical point of these tests that we confirmed by t (at the moral level of P ≤ 0.001) in all comparisons, which it is the Reason to explanatory
power of the moral analysis of variance Regression. Form that our equation:
Regression line Jump distance = 1.16 +.90 distance phase hop+.87 distance phase step+1.02 distance phase jump
Figure 1. (a): Normal P-P Plot of Regression Standardized Residual Dependent Variable: Jump distance.
Diagram of the points that we find clustered around the line so the data (residuals) distributed according to the normal distribution of the variables expertise in our study
Figure 1. (b): Scatter plot Dependent: Jump distance as Regression linear condition.
Figure 1 (b) represents a spread of overstocks with expected values and it explains the lack of specific points of the pattern in Figure 1(b) this is consistent with linear condition
We conclude from the Table 3 (a-b-c-d) that the hop dominated techniquepracticed as distributions ratios is depended with the all participation of the independent variables enter in the equation. Were we cannot excludedany Variables to be significant from a statistical point of these tests that we confirmed that Dependent Variable: Jump distance, it is the average of the results of different phases,
76 Zerf Mohammed et al.: Which Causal Relationships Can Reject or Accept the Significant Optimum Distribution Ratios Phases in the Triple Jump
which varies with variables independent (hop step jump) of each athlete distributions to gain more distance.
(Clifford Larkins) who said that the findings listed explain think above, the mean contribution of the phases distances varied with each study and Hay & Miller's (1985) confirm that optimum phase ratio is different from athlete to other (Bing Yu, PhD, 1982).Which we observed in the confirmation of scientific (F.P. Beer, Ferdinand P. Beer, E.R., 2009) as advice attributes in the formation of an athlete require by coaches. As a driving tasks objectives are to achieve as much as the triple jump is an athletic event in which a current arriving athlete tries to jump as far as he can by performing a hop, step and a jump phases.
5. Discussion of the Hypothesis 1
From the comparisons in the table 3(a-b-c-d)and the consistent linear figures 1 (a-b) condition as the equation of Dependent Variable equal that it’s the average of the all participation of the independent variables enter in regression method: we accepted the hypothesis,
That Optimum distribution ratios phases varies from athlete to other, for this causal relationships (hop dominated technique)that we explain in the within of the objectivein the hop phase explains by (Paul Brice),as it’s the first phase the achieving of the horizontal vertical velocity is the gain in the leg will be used for the two other phases.(Abeer Eissa, 2014) confirms this thought the athlete aims to maximize the horizontal distance jumped. This jump is composed of 3 take-off phases (hop, step, and jump), each playing an important role, as they require the jumper to tolerate extremely high forces of impact and to maintain a high level of horizontal velocity in another (Bing Yu, PhD, 1982) confirms, for the Russian technique (hop dominated technique). The nearest that, any came to the 39%: 30%: 31% ratio. In addition, based on the results we explained the phenomenon by (Ed Jacoby, 2009) that succeed in triple Jump are in the transition of phases, neither any errors is relate to other. that we explain statistical in the difference ratios acquired between step phase and Jump phase that it does not respect the model 1% in the major findings listed in the studies similar(table 1) for that we ask the second question.
Is there any causal relationship that can be used to
rejection or acceptance significant Optimum
distribution ratios phases in the jump-dominated technique?
We have chosen Regression as model statically Table 4. (a): Variables Entered/Removeda.
Model Variables Entered Variables Removed Method 1 distance phase Jump .
Stepwise (Criteria: F-to-enter <= .050, Probability-of-F-to-remove >= .100).
a. Dependent Variable: Jump distance
From the table4 (a) we note that the regression method,
which is, used in a manner is the Stepwise where the program has shown that it introduces onlythe distance phase Jump as the independent variable in the equation of multiple linear regression.
Table 4. (b): Model Summaryb.
Mo del R R Squ are Adjus ted R Squar e Std. Error of the Estim ate Change Statistics R Squa re Cha nge F Cha nge df 1 df 2 Sig. F Cha nge 1 .98 9a .978 .966 .0201 7 .978 86.9 53 1 2 .011
a. Predictors: (Constant), distance phase Jump b. Dependent Variable: Jump distance
Table 4 (b), we note that the three values of the simple correlation and the coefficient(R Square- Adjusted R Square), are significant in the Predictors used in Model1. From that we confirmed the independent explanatory variables phases (distance phase Jump), was able to explain the changes in the Dependent Variable Jump distance in practiced technique Jump dominate phase required and the rest (0.03) is attributable to other factors.
Table 4. (c): ANOVAa. Model Sum of Squares df Mean Square F Sig. 1 Regression .035 1 .035 86.953 .011b Residual .001 2 .000 Total .036 3
a. Dependent Variable: Jump distance b. Predictors: (Constant), distance phase Jump
As it is noted in Table4 (c) of the variables Predictor include in analysis to define the explanatory power of the model 1 based by the value of F.
As can be seen from the High explanatory power of multiple linear regression model from a statistical point the F test High moral (P <0.01), from that we confirms the High moral explanatory power of the model chosen of the multiple linear regression statistical.
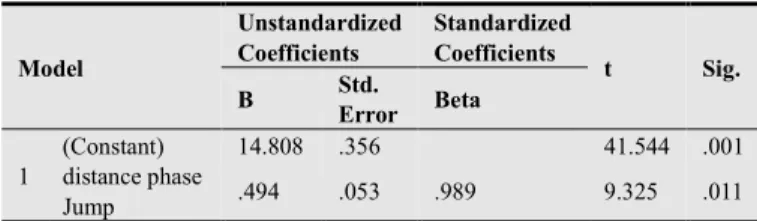
Table 4. (d): Coefficientsa. Model Unstandardized Coefficients Standardized Coefficients t Sig. B Std. Error Beta 1 (Constant) 14.808 .356 41.544 .001 distance phase Jump .494 .053 .989 9.325 .011
a. Dependent Variable: Jump distance
We conclude from the Table4 (d) that the independent variable were significant from a statistical point of these tests that we confirmed by t (at the moral level of P ≤ 0.001) in all comparisons, which it is the Reason, explanatory power of the moral analysis of variance Regression. From that our
equation
Regression line Jump distance = 14.808+.494 distance phase jump
Table 4. (e): Excluded Variablesa.
Model Beta In t Sig. Partial Correlation Collinearity Statistics Tolerance 1 Hop distance .427b 1.335 .409 .800 .079 Step distance -.051b -.131 .917 -.130 .148
a. Dependent Variable: Jump distance
b. Predictors in the Model: (Constant), phase Jump distance
We conclude from the Table 4 (e) that the independent variables (Hop distance and Step distance) were not significant from a statistical point of this tests that we confirmed by t (at the moral level of P ≤ 0.05) in all comparisons for that the Excluded Variables It did not affect the credibility of prediction
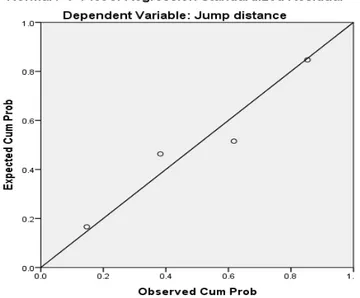
Figure 2. (a): Normal P-P Plot of Regression Standardized Residual Dependent Variable: Jump distance.
Figure 2. (b): Scatter plot Dependent: Jump distance as Regression linear condition.
Diagram of the points that we find clustered around the line so the data (residuals) distributed according to the normal distribution expertise of the variables in order to calculate the equation
Figure 2 (b) represents a spread of overstocks with expected values and it explains the lack of specific points of the pattern in Figure this is consistent with linear condition
We conclude from the Table 4 (a-b-c-d-e) that the Jump dominated technique practiced as distributions ratios is dependent with the particle of the independent distance of the phase Jump. Where any change in the distribution of the Jump phase, which must be the longest phase than (hop-step), can deficit distance globally. For that as a condition of the good application of the theoretical distribution Stride, length must be in the required of the smallest step phase and an area of 6.28 meters for the hop and 5.35 meters for the step, to be significant statistical point of these tests that we confirmed. In equation That Dependent Variable: Jump-dominated technique is the Optimum of hop and step as large hop and small step to exceed 6.83 meters in Jump phase as typically Stride length (34%29%37%).
6. Discussion of the Hypothesis 2
From the table 4(a-b-c-d-e) through the results of chosen Regression Jump-dominated technique is the Optimum ratios of hop 34-33% and step 29% as large hop and small step to exceed 6, 83 meters in Jump phase as typically Stride length 37% from the relative total distance
We conclude that the base on jump dominant techniques as length three phases typically practiced by our best champions is a criteria to distinguishing the effect of optimum phases’ ratio view the distribution ratios Register in their practical. Based on the results we can judge that the Stride length of the three phases typically to (34%29%37%) as mean observed in their results, should be as optimum phase ratio. This is not in conformity with the results of (Bing Yu, PhD, 1982) how confirms that the Optimum phase ratio is different from athlete to another. For our champions the Velocity conversion coefficient is one of demand for good practice of the identify factors affecting the performance of the triple jump. Ourstudy also confirms the vision of our results within the limits of good operating of the ideal technical which is confirmed by (Hui Liu, 2012) that the Phase ratio is a measure of effort distribution in the triple jump typically theory models distributed ratios. Hopdominant (39% 30% -31%), balanced (35%-30%-34%), and jump-dominant (34%29%37%). (McNab, T., 1968)or the table1 the mean contribution of the phase distances reports in the similar studies
7. General Conclusion
Our finding confirm the importance of distribution models to choose adopts practice technique Stride length typically phases appropriate for each theoretical model as a technical distribution ratio, because they offer the means to detect the
78 Zerf Mohammed et al.: Which Causal Relationships Can Reject or Accept the Significant Optimum Distribution Ratios Phases in the Triple Jump
errors practices in each phase. (ALLEN, and all, 2013)Confirms the description of the techniques used by elite triple jumpers consist the determine characteristics were significantly related to the officially recorded distance of the jump. To confirm, the Maximum errors in stride length that can be used to determine which strides are the major contributors to maximum error in toe-board distance. Our study confirm optimum phase ratio is different from athlete to another and the Velocity conversion coefficient is the determinant of optimum phase ratio on bases of ideal practice in dominate hop technique. Which confirms the vision of our results within the equation Regression liner that is limited by the good operating of the ideal technical Stride length typically phases that is not in accordance with the Russian model. Thing is confirmed by (Bing Yu, 1982) for the Russian technique. The nearest that, any came to the 39%: 30%: 31% ratio and (Hui Liu, 2012) the velocity conversion coefficient affected which technique achieved the longest actual distance for (James G. Hay, 1992)
The review itself considers each of the biomechanical factors identified in the models and selected characteristics of triple jumping techniques. In another case, we can judge that the Stride length of the three phases typically for our Bestperformance (34% 29% 37%) as mean observed in the results champions with 18 meter. Could be used as optimum phase ratio, thing that is compatible with equation Regression liner, which is the distance of the Jump phase and equal to over 37% of the overall jump distance. Thing confirmed by (S.J. Allen, & all, 2013) that the individual athletes have a linear relationship between the loss in horizontal velocity and the gain in vertical velocity during each phase that is not in conformity with the results of (Bing Yu, PhD, 1982) who confirms that the Optimum phase ratio is different from athlete to athlete. Based on the result for our modest study, we conclude that research on triple jump techniques has been focused on the differences on the performance, of the technique, which is natural; this avoids us to generate the results because of the mistakes in practice of the technique
That we observed in the table 1 (similar studies) and the table 2(performances of our samples) the hop dominant technique that shows above the mean issue of our research and has had little impact on practice individual athletes. The Identification of the individual attributes that determine the optimum ratio of the phase distances are subject seen as challenging topics of future research (James G. Hay, 1992).
8. Proposals
Nowadays, the disclosure of minute’s mistakes need from both coach and searcher development of a new means measuring instruments in planning and evaluation
1. Study the impact of relations of phase’s modality basis
in all tests practiced by the championships individual and in the group.
2. Study the problem posed in other similar studies. 3. Take advantage of this study in the assessment and
training triple jump.
References
[1] Abeer Eissa. (2014). Biomechanical Evaluation of the Phases of the Triple Jump Take-Off in a Top Female Athlete. Journal of Human Kinetics, 29–35.
[2] Bing Yu, PhD. (1982). BIOMECHANICS OF TRIPLE JUMP. usa: Center for Human Movement Science The University of North Carolina at Chapel Hill.
[3] Bouchard C, Rankinen T. (2001). Individual differences in response to regular phsycal exercise. Med.Sci.Sport exercise. [4] Clifford Larkins. (s.d.). THE OPTIMAL CONTRIBUTION
OF THE PHASE DISTANCES IN THE TRIPLE JUMP NOVICES VERSUS ELITES. The University of Michigan. [5] Ed Jacoby. (2009). Winning Jumps and Pole Vault. usa:
Human Kinetics.
[6] F.P. Beer, Ferdinand P. Beer, E.R. (2009). Mechanical engineer for vol.2: Dynamic. canada: De BoeckSupérieur Amazon France.
[7] Hui Liu. (2012). Effects of phase ratio and velocity conversion coefficient on the performance of the triple jump. Journal of Sports Sciences, Source: PubMed.
[8] IAAF. (2011, 08 18). Biomechanics Research Project in the IAAF World Championships Daegu 2011. International
Association of Athletics Federations: International
Cooperation Research Team (JAAF Biomechanics Team). [9] James G. Hay. (1992). the biomechanics of the triple jump: a
review. Journal of Sports Sciences, Source: PubMed.
[10] K. Dziewiecki, Z. Mazur, and W. Blajer. (2013). ASSESSMENT OF EXTERNAL AND INTERNAL LOADS IN THE TRIPLE JUMP VIA INVERSE DYNAMICS SIMULATION. Biol Sport., 103–109.
[11] McNab, T. (1968). Triple lump Amateur Athletic Association. London.
[12] MIHAI IlIE. (2009). RESEARCHES CONCERNING THE KINEMATIC ANALYSIS OF THE HOP IN THE MALE
TRIPLE EVENT. International Scientific Conference
Innovation and creation in the field of physical activity, sources of human performance Galati, 293 – 297.
[13] Paul Brice. (s.d.). Using Quintic Biomechanics to Calculate Centre of Mass,. Q4E Case Study, Sport Science (AS / A level /1st year Degree Level).
[14] S.J. Allen & all. (2013). Trade-offs between horizontal and vertical velocities during triple jumping and the effect on phase distances. Journal of Biomechanics, 979-983.
View publication stats View publication stats