HAL Id: hal-01949711
https://hal.archives-ouvertes.fr/hal-01949711
Submitted on 26 Dec 2020HAL is a multi-disciplinary open access
archive for the deposit and dissemination of sci-entific research documents, whether they are pub-lished or not. The documents may come from teaching and research institutions in France or abroad, or from public or private research centers.
L’archive ouverte pluridisciplinaire HAL, est destinée au dépôt et à la diffusion de documents scientifiques de niveau recherche, publiés ou non, émanant des établissements d’enseignement et de recherche français ou étrangers, des laboratoires publics ou privés.
Enhanced photoemission from laser-excited plasmonic
nano-objects in periodic arrays
N Fedorov, G. Geoffroy, G. Duchateau, L Štolcová, J Proška, F Novotný, M
Domonkos, H. Jouin, P. Martin, Michèle Raynaud
To cite this version:
N Fedorov, G. Geoffroy, G. Duchateau, L Štolcová, J Proška, et al.. Enhanced photoemission from laser-excited plasmonic nano-objects in periodic arrays. Journal of Physics: Condensed Matter, IOP Publishing, 2016, 28 (31), pp.315301. �10.1088/0953-8984/28/31/315301�. �hal-01949711�
This content has been downloaded from IOPscience. Please scroll down to see the full text.
Download details:
IP Address: 129.104.29.1
This content was downloaded on 15/06/2016 at 07:40
Please note that terms and conditions apply.
Enhanced photoemission from laser-excited plasmonic nano-objects in periodic arrays
View the table of contents for this issue, or go to the journal homepage for more 2016 J. Phys.: Condens. Matter 28 315301
(http://iopscience.iop.org/0953-8984/28/31/315301)
1. Introduction
Over the last decade, metallic nano-particles have attracted tremendous interest. This is due to their unique optical prop-erties which hold the promise of opening the way to control-ling light on the nanometer length scale and femtosecond time scale [1, 2]. In particular, the excitation of non-propagating surface plasmons (SP) in metallic nano-particules is of great interest [1, 3–5] as it has been observed to lead to a significant
enhancement of the absorption ( viz. more than 50%) when the excitation is triggered by an ultra-fast laser pulse. This may give rise to an enhancement of the local intensity and a sub-wavelength confinement of the optical field, due to the finite size of the objects [6–8]. This in turn leads to intense field dynamics whereby the multi-photon emission can be strongly enhanced [9–13]. The SP evanescent field penetrates the vacuum over a very short distance, such that a strong acceleration of the electrons may be observed [14–17] due
Journal of Physics: Condensed Matter
Enhanced photoemission from laser-excited
plasmonic nano-objects in periodic arrays
N Fedorov1, G Geoffroy1, G Duchateau1, L Štolcová2, J Proška2,
F Novotný2,3, M Domonkos4, H Jouin1, P Martin1 and M Raynaud5
1 Université de Bordeaux-CNRS-CEA, Centre Lasers Intenses et Applications, UMR 5107, 351 Cours de la Libération, 33405 Talence, France
2 FNSPE, Czech Technical University in Prague, Brehova 7, CR-11519 Prague, Czech Republic 3 Dept. Surg., University of Ostrava, University Hospital Ostrava, Ostrava, Czech Republic 4 Institute of Physics v.v.i. ASCR, Cukrovarnicka 10, CR-11519 Prague, Czech Republic 5 Laboratoire des Solides Irradiés, Ecole Polytechnique, CEA, CNRS, Université Paris-Saclay, 91128 Palaiseau cedex, France
E-mail: michele.raynaud-brun@polytechnique.edu
Received 23 February 2016, revised 2 May 2016 Accepted for publication 13 May 2016
Published 14 June 2016
Abstract
The process of photoelectron emission from gold surfaces covered with nano-objects that are organized in the form of a periodic array is addressed in the short laser pulse regime (⩽ 50 fs) at moderate intensities ∼ 1010 W cm−2 and for various laser wavelengths. The emission
spectrum from a gold single crystal measured under the same conditions is used for reference. The comparison of the photo-emission yield and the energy of the ejected electrons with their counterparts from the (more simple) reference system shows that the periodic conditions imposed on the target surface drastically enhance both quantities. In addition to the standard mechanism of Coulomb explosion, a second mechanism comes into play, driven by surface plasmon excitation. This can be clearly demonstrated by varying the laser wavelength. This interpretation of the experimental data is supported by predictions from model calculations that account both for the primary quantum electron emission and for the subsequent surface-plasmon-driven acceleration in the vacuum. Despite the fact that the incident laser intensity is as low as ∼ ×5 1010 W cm−2, such a structured target permits generating electrons
with energies as high as 300 eV. Experiments with two incident laser beams of different wavelengths with an adjustable delay, have also been carried out. The results show that there exist various channels for the decay of the photo-emission signal, depending on the target type. These observations are shedding light on the various relaxation mechanisms that take place on different timescales.
Keywords: photoemission, laser excitation, surface plasmon, plasmonics (Some figures may appear in colour only in the online journal)
N Fedorov et al
Enhanced photoemission from laser-excited plasmonic nano-objects in periodic arrays Printed in the UK 315301 JCOMEL © 2016 IOP Publishing Ltd 2016 28
J. Phys.: Condens. Matter
CM
0953-8984
10.1088/0953-8984/28/31/315301
Paper
31
Journal of Physics: Condensed Matter
doi:10.1088/0953-8984/28/31/315301
to the ponderomotive force within the local, induced field. Such a mechanism was first reported in grating targets where propagative surface plasmons might/can be excited [18–27]. Electrons with energies as high as tens of eV could be obtained for laser intensities as low as ∼ 1010 W cm−2. With the recent
development of CEP-stabilized few-cycle laser pulses, it has become possible to obtain higher energy cut-offs (hundreds of eV) in the photoelectron spectra of metallic nanoparticles [15, 28, 29]. This point is of considerable interest for the pro-cesses and devices that exploit hot-electron emission, e.g. in photo-catalysis, photovoltaïc devices and optoelectronics.
For a single nanoparticle, the SP strongly depends on the particle shape [30], on its dielectric properties, and on the nature of the surrounding medium. When—as in most exper-imental situations—a set of nanoparticles is considered, the SP is further influenced by the electromagnetic interactions between the particles [31]. For example, the use of periodic arrays has emerged recently as a promising tool for plas-monic and photonic applications in optics [32–35]. In order to improve the electron sources in terms of emissivity, energy and beam spread, one can also take advantage of metallic nan-oparticles organized within a network to enhance the overall plasmon resonance of the system [16, 17, 36–39]. Actually the precise mechanism for the energy transfer and relaxation that leads to the drastic enhancement of the photo-emission prop-erties during the interaction of the laser with the nano-particle array is still not well understood in the short-pulse regime. There can thus be no doubt that in order to optimize new high-emission devices, an improved knowledge of the relevant mechanism of electron transfer and relaxation is required.
In the present work we have studied the photoelectron emission obtained by short-pulse (∼ 25 fs) laser excitation of a regular two-dimensional array of gold-coated nano-scale objects (N-O) within a range of moderate laser intensities ∼ 1010 W cm−2. The goal is to obtain a target with an
effi-cient plasmon structure and to understand the role played by the excitation, whose wavelength matches that of the laser. The radius of the nano-scale objects is about 215 nm and from now on we will call these targets N-O array targets. Their properties have been studied as a function of the laser wave-length (which was varied between 800 and 266 nm), with laser intensities ranging from 108 to 5×10¹⁰ W cm−2. The
elec-tron relaxation and heat diffusion of the N-O array target have been also investigated in this work as it might be important for applications in electron tunneling devices. It is well-known that a laser photon cannot couple to the surface plasmon wave of a flat surface (unless in some special excitation geometries such as the one reported by Kretschmann [40, 41]). This is the reason why we will compare the results on the N-O array target with those obtained with a gold single-crystal sample, which should be devoid of surface plasmon effects. This gold single crystal will thus be used as a reference sample.
In our study we observe a large increase in both the pho-toemission yield and the photoelectron energy of the N-O array targets in comparison with the gold single crystal. Due to the presence of the 2D array of nano-particles on the surface, the former exhibits a periodic roughness which triggers the excitation of a propagative surface plasmon. Consequently,
the photoemission yield depends on the laser incidence. This situation is quite different from those encountered in previous studies on isolated nano-particles that were deposited onto a support. Two different interaction regimes are analyzed here: at a laser wavelength of 266 nm (which is of the order of the size of the N-O), and at 800 nm (with the aim of investigating the dipolar regime wherein higher local-field enhancements are expected). In particular, it is shown that the use of N-O array targets permits accelerating electrons to kinetic energies which are as high as roughly 300 eV, even when only mod-erate laser intensities (of the order of 5×10¹⁰ W cm−2) are
applied. Two-color pump–pump experiments whereby the laser pulse duration is much shorter than the time scale on which the energies are redistributed by the electron–electron and electron-lattice interactions are now commonly used tech-niques. They are efficient to study the energy redistribution during the laser-solid interaction [42, 43]. Such experiments have also been performed here in order to investigate the dif-ferences between the electronic relaxation dynamics in the N-O array targets and in the gold single crystal. For all exper-imental observations, we will provide qualitative interpreta-tions that shed light on the underlying physical processes that may be taking place.
The paper is organized as follows: first, the N-O array target synthesis and the framework of the photoemission experiments are presented in section 2. Next, the experimental results are detailed and discussed for both types of targets, i.e. the single-crystal and the N-O array targets. This happens in section 3, where we first investigate the possibility of exciting a propagative surface plasmon on the structured target (sec-tion 3.1) with a laser. Then we compare the electron emission obtained at low laser intensities from the gold single-crystal sample (section 3.2.1) and the N-O array target (section 3.2.2) with those derived from a scenario wherein the mechanism for electron acceleration is based on space charge effects, i.e. Coulomb repulsion. In order to back our interpretations of the experimental data on the wavelength dependence of the photo-emission process, we present in section 3.3 predictions obtained from model calculations that account for both the primary quantum electron emission and the subsequent sur-face plasmon-driven acceleration in the vacuum. The response observed for the two types of targets in the regime of relatively high laser intensity is reported in section 3.4. Finally, we also present pump–pump experiments in section 3.5, as they offer the opportunity to highlight the differences between the elec-tronic relaxation dynamics in the two sample types in a novel way. Further consequences for possible applications are given in the concluding section 4.
2. Experimental configuration 2.1. Targets preparation
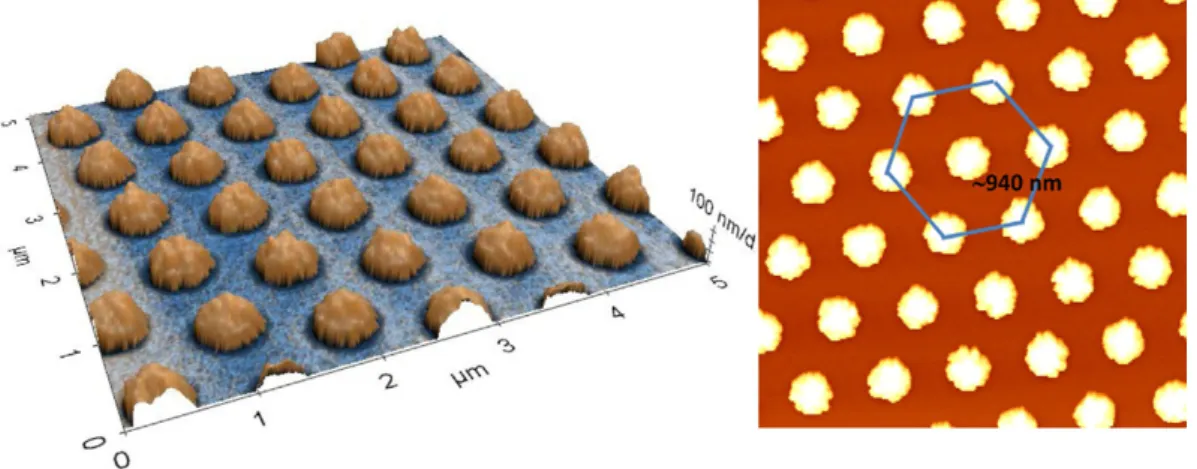
A monolayer of polystyrene microspheres of 940 nm diam-eter (microParticles, GmbH, Berlin, Germany) in the form of an hexagonal lattice with close-packed order was prepared by self-assembly at the water/air interface (following a tech-nique described in [44]). It was subsequently deposited onto
a cleaned glass substrate. After drying, the size of the micro-spheres was decreased by dry etching in a reactive ion etching plasma system (Phantom III/Phantom LT RIE System, Trion Technology) operated in a capacitative-coupling mode for 135 s. The total gas pressure was 90 mTorr, the RF power was 100 W, and the O2 flow rate was 50 sccm. A gold layer of
60 nm thickness was laid over the etched polystyrene spheres by magnetron sputtering in a high-resolution sputter coater (Cressington 208HR). The gold-coated nano-scale objects obtained by this procedure had maintained their periodicity, preserving the lattice parameter of the close-packed spheres and their main radius of 215 nm (see figure 1).
This sample will be referred to hereafter as the N-O array target. In order to compare the influence of the finite size of the objects on the dynamics of the electronic relaxation, a second N-O array target has been prepared in the same way. It consists of nano-objects of a smaller size (radius < 100 nm) and has been used in the pump–pump experiments. The latter sample will be referred to as the NO-100 array target.
2.2. Photoemission measurements
The experiments have been carried out by using the 1 kHz Ti:Sa Aurore laser system at CELIA (Centre Laser Intense et Applications), providing 8 mJ, 25 fs laser pulses at 800 nm. The output frequency is doubled and tripled using a BBO crystal to generate 266 nm light pulses. The duration of the 266 nm pulses has been estimated to be 50 fs. The photo-emitted spectra were recorded at the three laser wavelengths for laser intensities ranging from 0.3 to 50 GW cm−2. These
values have been deduced from a calorimetric measurement of the pulse energy (with shot-to-shot fluctuations of 5%) and from the autocorrelation determination of the pulse duration (with a 5% uncertainty). The laser beam is p-polarized and is impinging onto the target without focalization (the focal-spot diameter on the target equals ∼ 1.5 mm).
The sample is mounted within a magnetically shielded, high-vacuum (∼10−9 mbar) chamber and can be rotated
around its vertical axis to change the incidence angle of the laser beam with respect to its surface. The kinetic-energy distribution of the electrons is analyzed with a hemispherical
detector CLAM IV. The direction of detection was perpend-icular to the sample surface. When the electron emission is relatively large, the detection saturates at about 3500 counts s−1 due to electron losses during their transport in the CLAM.
This is of minor importance in the following analysis since we are mainly interested in the high-energy part of the photo-electron spectra. We determined the energy resolution of the electron spectrometer to be 0.1 meV for an electron with a kinetic energy of 50 eV.
The time-resolved two-color photoemission experiments have been performed using the fundamental of the Ti-Sa laser system (800 nm, 25 fs) as pump and the tripled-energy beam (266 nm, 50 fs) as the second pump. The two laser pulses are delayed with respect to each other by means of an optical-mirror device on a moving plate with a spatial resolution of
µ
1 m (corresponding to 6.6 fs). The two pulses have identical focal spot diameters and they are both p-polarized. Note that the noise in the spectra from N-O array targets is higher than that in the spectra from the single crystal, due to the roughness of the surface and the laser incidence angle of 45 . It is
pre-sumably due to some fluctuations in the spatial (and therefore temporal) overlapping of the two laser beams. Photoelectron spectra have also been recorded before and after the two-color pump–pump scans to ensure that the sample properties had not been altered during the scans.
All the measurements presented here have been collected well below the damage threshold of the targets, and at room temperature (close to 300 K).
3. Results and discussion
3.1. Angular dependence of the photoemission yield
It is well-known that the surface plasmon excitation strongly influences the photoemission from metallic nano-particles [13, 16, 17] and metallic gratings [18–27]. Since the target is covered with a lattice of quasi single-sized objects, the latter can act as a structured surface, in analogy with the situation encountered in a metal grating. It can therefore provide the incremental momentum required to fulfill the condition of momentum conservation in the excitation of the
Figure 1. Image of the N-O array target. The objects have a radius of about 215 nm and are arranged in the form of a hexagonal honeycomb lattice with a lattice parameter of ∼940 nm.
surface plasmon by the laser. In this case the photoemission is expected to reach a maximum for some optimal laser angle of incidence. This stands in marked contrast with the situation encountered in the case of a single nano-particle, and this fact has in return motivated the study of the angular dependence of the photoemission reported hereafter.
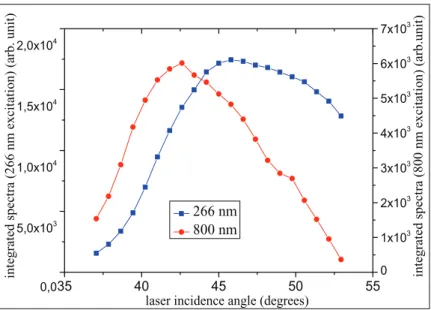
Figure 2 displays the integrated photoemission signal as a function of the angle of incidence of the laser beam for the N-O array target, at two laser wavelengths (of 800 and 266 nm) and a laser intensity of ∼ 0.3 GW cm−2. At 800 nm
(hν =1.55 eV), the photoemission signal reaches a maximum around the laser beam incidence angle of 42.5 and the signal
width is relatively large (∼10 at half the maximum). At
266 nm (hν =4.65 eV) the yield of the electron emission is higher than at 800 nm since the order of the multi-photon pro-cess is lower. The maximum of the photoemission signal is shifted towards an incident angle of 47 . Since we are not in
the dipolar regime (λ = 266L nm, which is of the the order of
the radius r0 215 nm of the objects), the resonance is larger (∼15 at half the maximum) and is not so well defined. At
res-onance, one expects that the surface plasmon excitations will produce a locally amplified electric field on the target surface, just like in the case of a grating surface. Also here this field is influenced by the roughness of the gold surface, the shape of the individual nano-objects, their mutual interactions, and their interactions with the substrate. Note also that we do not observe any dependence of the emission on the laser polari-zation. This can be explained as a consequence of the quasi-spherical shape of the nano-objects.
It has to be emphasized that changing the incident laser wavelength, λL, modifies the laser interaction regime. This is
bound to translate into an effect on both the collective and the local effects. As a matter of fact, at λ = 800L nm, we have
/λ
r0 L 1 such that we are in the dipolar regime. In this case, a high local-field amplification is expected (see section 3.2). This may induce a ponderomotive acceleration of the photo-emitted electrons [27]. On the contrary for λ = 266L nm,
/λ ∼
r0 L 1 such that retardation effects are no longer negligible. Moreover, hν is above the threshold for the inter-band trans-ition in gold (2.3 eV [45]). This may lead to further damping of the surface plasmon resonances and a lower local-field amplification. This effect is not clearly seen in figure 2 as it is blunted by the enhancement of the photoemission probability at 266 nm due to the lower multi-photon order.
No angular dependence of the photoelectron emission yield is observed for the gold single-crystal target under the same conditions. This is as expected, as it is just impossible to excite surface plasmons in this case. The fact that we find an angular dependence in the photoemission from the N-O array target is evidence for the presence of a propagative surface plasmon excited by the laser. Therefore in the following, all spectra reported at 800 nm and 266 nm, have been recorded at an angle of incidence of 45 , both for the N-O array target
and for the single-crystal target. At this incidence angle the conditions for the excitation of a surface plasmon are fulfilled.
3.2. Photoemission spectra at low laser intensities
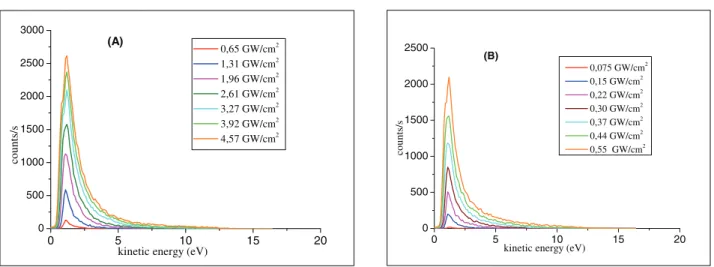
3.2.1. Gold single-crystal target. We start by analyzing the case of the gold single crystal as it must serve for further ref-erence. First we investigate the influence of the pulse duration in order to determine whether space charge effects may be sig-nificant or otherwise. With this goal in mind, the photo-emis-sion spectra at a wavelength of 800 nm are plotted in figure 3
for various laser intensities and two values of the pulse dura-tion (25 fs and 220 fs). Our procedure is such that the pulse duration is changed, resulting in energy variations from 0.5 µJ (∼ 0.65 GW cm−2 for 25 fs) to 3.5 µJ (∼ 4.57 GW cm−2 for
25 fs). It transpires that within this range of laser energies, increasing the pulse duration by a factor ∼ 8 while keeping the pulse energy constant does not affect the position of the energy for threshold emission nor the shape of the spectra. We thus conclude that space charge effects are negligible under these conditions [46]. The standard photoelectron spectrum is
Figure 2. Integrated photoemission signal of the N-O array target as a function of the laser incidence angle (measured with respect to the normal to the surface) at 800 nm, 25 fs (red filled circles) and 266 nm, 50 fs (blue filled squares) at ∼0.3 GW cm−2.
recovered from this target, which presents quite a low photo-emission yield. This is the result of a multi-photon absorption process that occurs at this laser wavelength. Using the law of conservation of energy, the position of the peak at low kinetic energy can be used to estimate the work function around 5 eV. It is in agreement with previously reported standard values for gold [47]. Note that this experiment is not designed to study the low-energy electrons and extract an accurate value of the metal work function in fine detail. The purpose is here rather to focus the attention onto the high-energy electrons.
The influence of the laser wavelength is illustrated by figure 4 which shows photo-emission spectra for the shortest available pulse duration (25 fs) at both 800 nm and 266 nm for two intensities: (A) 1.3 GW cm−2 and (B) 32 GW cm−2. We
remind that the detection saturates around 3500 counts s−1.
When we decrease the laser wavelength from 800 to 266 nm keeping a low laser intensity as reported in figure 4(A), we observe that the shorter the laser wavelength is: (a) the higher the density of the electrons emitted is, (b) and the higher the maximum of the electron kinetic energy is, while (c) the energy position of the main peak is slightly shifted to higher energies. This last point will be discussed in more details
in the modeling support section. When the laser intensity is increased from 1.3 GW cm−2 to 32 GW cm−2 a significant
modification of the spectral shape takes place in its high-energy part. Several physical mechanisms may explain this behavior. Firstly, the shorter the wavelength is, the smaller the order of the multi-photon process will be. Thus the probability of emission is increased and more electrons are produced, as observed in the experiment. Therefore, charge repulsion may take place inside the electron bunch under these conditions. This induces additional electron deceleration and accelera-tion [46]. Secondly, the production of a large electron density entails a larger number of electron collisions, and this leads to a faster relaxation of the electron gas. This could also be respon-sible for the particular shape of the spectra, which looks rather similar to a Fermi–Dirac distribution. The latter accounts for a non-independent electron gas that has reached equilibrium by relaxing via electron–electron collisions. Furthermore, at low electronic temperature, the chemical potential is of the order of the Fermi energy EF which varies as ne2 3/ where ne is the
produced electron density. The maximum value of the kinetic energy of the electrons may thus be related to the relaxation processes. Moreover, for decreasing wavelengths, the slope
Figure 3. Spectra of photo-emitted electrons from a gold single crystal irradiated with a 800 nm laser pulse for increasing laser intensities: (A) with a pulse duration of 25 fs; (B) with a pulse duration of 220 fs.
0 5 10 15 20 0 500 1000 1500 2000 2500 3000 counts/s
kinetic energy (eV)
0,65 GW/cm2 1,31 GW/cm2 1,96 GW/cm2 2,61 GW/cm2 3,27 GW/cm2 3,92 GW/cm2 4,57 GW/cm2 (A) 0 5 10 15 20 0 500 1000 1500 2000 2500 counts/s
kinetic energy (eV)
0,075 GW/cm2 0,15 GW/cm2 0,22 GW/cm2 0,30 GW/cm2 0,37 GW/cm2 0,44 GW/cm2 0,55 GW/cm2 (B)
Figure 4. (A) Spectra of photo-emitted electrons from a gold single crystal irradiated with a 800 nm (red filled circles), and 266 nm (blue filled squares) laser pulse at 1.3 GW cm−2. (B) the same for an intensity of 32 GW cm−2 (the detector saturation is about 3500 counts s−1 due to electron losses during their transport in the CLAM (see also text)).
0 5 10 15 0 500 1000 1500 2000 2500 3000 3500 counts/s
kinetic energy (eV)
266 nm 800 nm 1.3 GW/cm2 (A) 0 5 10 15 20 25 30 35 40 0 1000 2000 3000 4000 counts/ s
kinetic energy (eV)
266 nm 800 nm
32 GW/cm2
of the spectra increases in its high-energy part. When it can be assumed that the electron gas has reached equilibrium, the slope is directly related to the electron temperature: the higher the temperature, the smaller the slope of the distribu-tion (around the Fermi energy). The decrease in the slope of the distribution with increasing laser wavelengths suggests thus an increase in the electron temperature. This is in agree-ment with standard models of laser electron heating in metals [48]. Indeed, the transition rate for photon absorption by free electrons increases as a function of the wavelength.
To conclude this analysis, the photoemission behavior of the gold single-crystal can be rather well understood by con-sidering both space charge effects and laser heating of the electrons. The relative contributions of these two mechanisms depend both on the laser wavelength and intensity.
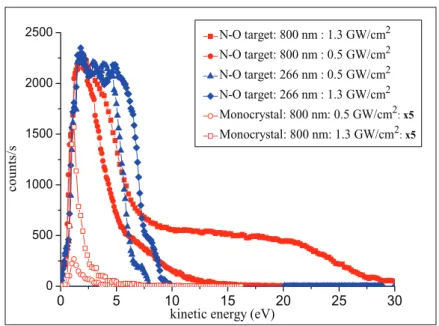
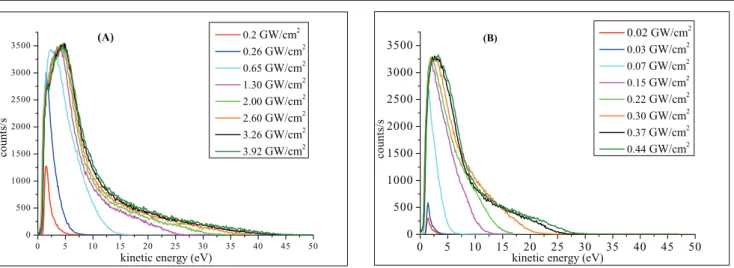
3.2.2. N-O target. Let us now consider the case of the N-O array target. The photoelectron spectra are reported in figure 5 at 800 nm for two laser intensities: 1.3 GW cm−2 and 0.5 GW cm−2.
For comparison, the spectrum of the gold single crystal is also displayed after multiplication by a factor of 5. The most salient feature here is the difference in the photo-emitted cur-rent between the two sample types. This curcur-rent is enhanced by a factor ∼ 50 in the N-O array target in comparison with the single-crystal target. Moreover, we note the presence in the spectra of electrons with an energy that is higher than can be expected based on the photoelectric balance: up to ∼ 15 eV and ∼ 30 eV at 0.5 GW cm−2 and 1.3 GW cm−2, respectively.
The evolutions observed may be interpreted in terms of two main mechanisms: the ponderomotive acceleration of the electrons in the high-frequency inhomogeneous local field induced by laser excitation of surface plasmons [18, 27] and a significant charge repulsion. The latter may take place in the emitted electron bunch.
Let us first discuss the mechanism of ponderomotive elec-tron acceleration. When the elecelec-trons are released from a metal that carries a SP excitation, they will be further subjected to the inhomogeneous high-frequency longitudinal SP field in the vacuum. Consequently, the total energy of an emitted elec-tron will be the result of two contributions: the kinetic energy gained after overcoming the metal work function and the pon-deromotive potential Up=ESP2 / ω4 20 in the oscillating SP field
ESP. Here ω0 is the angular frequency of the laser. This will
be correct provided the electrons are given enough time to explore the full SP field gradient. It is worth noting that the SP field amplitude is much higher than the amplitude of the laser field. It is this feature which is responsible for the high electron yields that are obtained when a SP excitation is pre-sent. The ponderomotive potential is then high even when the laser intensities are as low as those considered in the present work. The electrons will thus be significantly accelerated [18,
19]. Moreover, a part of the electrons may during their motion bounce back after their initial acceleration in the SP field. This is then due to the change of the sign of the field. The magni-tude of the time interval during which the electron is bouncing back is such that it acts as a kind of reset for the initial condi-tions of the particle. This way the electron can be accelerated once more in the next half-cycle of the high-frequency field [15, 17, 49, 50]. This effect further broadens the final energy distribution of the electrons towards higher values.
The electron acceleration observed may also be interpreted as a consequence of the strong charge repulsion that may pre-vail within the emitted electron bunch. This idea is partly sup-ported by a comparison of the photo-emission spectra shown in figure 6. Here the pulse duration has been increased by a factor ∼8 from 25 fs to 220 fs while keeping the pulse energy con-stant. Although no shift of the emission threshold is observed, the cut-off energy of the emitted electrons decreases when one
Figure 5. Spectra of the photo-emitted electrons from the N-O array target irradiated with a 800 nm, 25 fs laser pulse with a laser intensity of 0.5 GW cm−2 (red filled circles) and of 1.3 GW cm−2 (red filled squares) and with a 266 nm, 50 fs laser pulse with a laser intensity of 0.5 GW cm−2 (blue filled triangles) and of 1.3 GW cm−2 (blue filled diamonds). For comparison we display also the spectra of the electrons photo-emitted by a gold single crystal (multiplied by 5) irradiated with a 800 nm, 25 fs laser pulse at 0.5 GW cm−2 (red circles) and 1.3 GW cm−2 (red squares).
increases the duration of the pulse keeping the pulse energy constant. Indeed, at constant laser energy, longer pulses corre-spond to lower intensities, and these lead to smaller densities of the ejected electrons. The charge repulsion effects become thus less important when the pulse duration is increased. Note that the ponderomotive acceleration, which varies as Iλ2,
dif-fers from the acceleration due to the presence of space charge by its dependence on the duration of the laser pulses. In fact, increasing the laser pulse duration from 25 fs to 220 fs results in a more complete conversion of the ponderomotive energy. The energy gain of the electrons becomes higher at constant laser intensity [18]. This is clearly observed on the spectra shown in figure 6 when one compares the spectra reported at 25 fs for 0.15µJ (0.2 GW cm−2) with the spectrum reported at
220 fs for 3 µJ (0.44 GW cm−2).
With the N-O array target (see figure 5), the maximal kinetic energy of the electrons obtained with laser pulses of a wavelength of 266 nm is less than that obtained with pulses of a wavelength of 800 nm. This behavior is opposite to the behaviour previously reported for the single-crystal sample (see figure 4). It is consistent with the Iλ2 wavelength
depend-ence expected for the ponderomotive acceleration of electrons in vacuum due to the local induced SP field. And it is further reinforced by the fact that at this wavelength we are well above the threshold for inter-band transitions in gold [45] (2.3 eV). Thus, the surface plasmon is damped and the associated local field reduced. At 266 nm, another effect can be observed: the main peak, centered at an energy of roughly 3 eV, may split into two parts at its maximum. In fact, as previously men-tioned, for this wavelength the probability of photoemission is higher (two-photon process). Hence, a larger amount of photo-emitted electrons is released during the rather short duration of the laser pulse (50 fs). This may lead to charge repulsion within the emitted electron bunch and subsequently split the bunch. This in turn will further accelerate the elec-trons [46]. Increasing the laser intensity from 0.5 to 1.3 GW cm−2 increases the produced electron density, thus enhancing
the Coulomb repulsion and the splitting of the electron bunch. Such an enhancement is indeed observed in the experimental spectra. It should be noted however, that the acceleration due
to the Coulomb repulsion is smaller at 266 nm than at 800 nm, which shows that that the ponderomotive electron accelera-tion is the dominant mechanism for producing high-energy electrons.
Based on the previous observations and analysis it is pos-sible to propose the following as a likely physical scenario for the electron dynamics during the emission process when the SP is excited in the N-O array target. First of all, from the fact that the presence of a SP excitation enhances the electron emission, it can be concluded that both the Coulomb and pon-deromotive mechanisms (including half-cycle re-acceleration) play a role. The electrons are first emitted as a dense bunch wherein electron–electron collisions and Coulomb repulsion take place. During this step, the electron gas may partially relax, giving rise to a distribution that has reached equilibrium for the high-energy electrons, which are the ones that have undergone the largest number of collisions. At lower energies, the distribution broadens by a few eV due to the Coulomb repulsion. While the bunch expands, this Coulomb repulsion vanishes. The electrons then become independent one from another, and in a second step they can be further accelerated through the ponderomotive effect.
To conclude this part, we have shown that when the surface plasmon is laser excited (i) the N-O array targets have a higher photoemission yield than the gold single crystal while (ii) the energy of the electrons emitted is higher. This behavior can be qualitatively interpreted by considering both space charge effects and electron ponderomotive acceleration within the local induced surface plasmon field in vacuum, whereby the relative contributions depend on both the laser wavelength and intensity.
3.3. Modeling support
The aim of this section is to verify if the ponderomotive effect can contribute to the observed wavelength dependence of the high-energy part of photoemission spectra when the surface plasmon is excited. This part of the spectrum is different in the single-crystal sample and in the N-O array target on which the surface plasmon is excited. The problem addressed here is
Figure 6. Spectra of photo-emitted electrons from a gold N-O array target irradiated with 800 nm laser pulses for increasing laser energies: (A) with a pulse duration of 25 fs, (B) with a pulse duration of 220 fs.
0 5 10 15 20 25 30 35 40 45 50 0 500 1000 1500 2000 2500 3000 3500 counts/ s
kinetic energy (eV)
0.2GW/cm2 0.26GW/cm2 0.65GW/cm2 1.30GW/cm2 2.00GW/cm2 2.60GW/cm2 3.26GW/cm2 3.92GW/cm2 (A) 0 5 10 15 20 25 30 35 40 45 50 0 500 1000 1500 2000 2500 3000 3500 counts/s
kinetic energy (eV)
0.02 GW/cm2 0.03GW/cm2 0.07GW/cm2 0.15GW/cm2 0.22GW/cm2 0.30GW/cm2 0.37GW/cm2 0.44GW/cm2 (B)
quite remote from the one that underlies the description of an optical absorption spectrum [51, 52]. Therefore, we focus our attention onto the fact that it is the roughness of the surface of the N-O array target, that triggers the excitation of the SP wave. Hence we do not try to model explicitly the complicated electromagnetic field associated with the SP which is excited on the N-O array target, as has been done in [53]. We rather use the model developed in our previous work on a grating target [27] for a preliminary approach. In this model one first calcu-lates the quantum ionization probabilities in the presence of an external field by means of the Jellium–Volkov method. The external field can be either the laser field or the SP field. After that the final photoelectron spectrum is obtained by taking into account the motion in vacuum of the freed electrons within this
external field. We focus our attention here on the tails of the energy spectra. For the N-O array target, these spectra extend to higher energies when the laser wavelength increases from 266 nm to 800 nm (see figure 5). For the single crystal, the opposite behaviour is observed (see figure 4).
3.3.1. Case of the gold single cristal. In the case of the sin-gle-crystal target, the photons of the impinging laser beam cannot couple to a surface plasmon. Hence the external field in the model is the laser field and the single-crystal target goes into standard laser photo-emission in the low intensity-field of the laser used in the present study: 108 to 5×10¹⁰ W cm−2.
The quantum ionization probabilities are calculated as a func-tion of emitted electron energy, by means of the Jellium– Volkov (JV) method whose details can be found in [27] and [54]. In this perturbative method, whose use is justified by the low intensities we are considering here, the solid metal’s electronic structure is described as usually through the jellium model, using the values EF=5.5 eV for the Fermi energy and W = 5.1 eV for the work function [47]. This standard approach has been chosen as it is less time-consuming than non-perturbative approaches such as the solution of the TDSE (time dependent Schrödinger equation) [54, 55] or methods based on the more refined TDDFT (time dependent density functional theory).
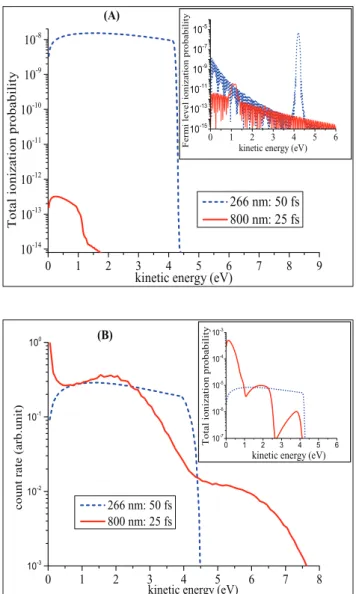
In figure 7(A) we display the total ionization probabilities obtained in the case of the gold single crystal (i.e. integrated over the whole conduction band) at the two wavelengths of 800 and 266 nm. In the inset we also present the ionization prob-ability corresponding to the Fermi level. These data will be used to analyze the results. The IR curve in the inset presents a peak at 1.1 eV, which corresponds to the absorption of four IR photons (800 nm, 1.55 eV) in agreement with the photoelectric balance. The UV spectrum in the inset presents a more rapidly decreasing background than the IR one and shows a strong peak at 4.2 eV which corresponds to the emission of electrons through the absorption of two UV photons (266 nm, 4.65 eV). As it can be seen in figure 7(A), these peaks are broadened after integration over the conduction band. In the IR case, the integration results in a weak peak extending up to 1.2 eV related to the four photons emission of a narrow (1.1 eV) band of states below the Fermi level. In the UV case, the integration leads to an intense and broad peak (up to 4.4 eV) resulting from the two UV photons emission of a large (4.2 eV) band of states below the Fermi level. These results are in qualita-tive agreement with the observed wavelength dependence in the gold single-crystal target. In particular, they provide an explanation for relative energy position of the main peaks. They are also in agreement with the previous discussion of the high-energy tail that is observed when the single crystal is excited by a UV laser pulse with an intensity of 1.3 GW cm−2.
At the higher intensity of 32 GW cm−2, the produced electron
density is expected to be significantly larger. The result of this is that the electron–electron collisions affect the energy dis-tribution of the ejected electrons. In order to take this point into account, it would be necessary to develop an improved model that takes into account the many-body effects, but this is beyond the scope of the present work.
Figure 7. Photoemission spectra as a function of electron ejection energy (in eV) for 800 nm, 25 fs, 1.3 GW cm−2 (full red line) and for 266 nm, 50 fs, 1.3 GW cm−2 (dashed blue line), (A) case of a gold single crystal calculated by means of the Jellium–Volkov method (the curves in the inset correspond to the ionization probability for the same laser parameters but at the Fermi level only); (B) case of a surface with SP (full red line: final spectrum obtained for 800 nm η =80 and δ =650 nm; dashed blue line: same for 266 nm, η =20 and δ =25 nm). In the inset, the corresponding primary spectra obtained with the JV method in the first step (see text) are displayed.
3.3.2. Case of surface plasmon excitation. In the N-O array target a propagative surface plasmon excitation is present. In the experiments (see figure 5) we observe then also an important extension of the electron spectrum towards higher energies. However it is important to note that in this case the excitation is due to the IR pulse, in sharp contrast with what happens within the single-crystal target. As previously men-tioned our experimental results reveal a dependence of the N-O array target photoemission on the laser angular incidence that is reminiscent of the data that can be obtained on a grat-ing. In this respect our situation differs markedly from other nano-particle excitation schemes whereby a non-propagative SP is excited in regime of very high laser intensities [28, 56].
In order to understand the behaviour of the N-O array target, we have thus performed calculations using the model of pho-toemission developed in [27]. This model takes into account the presence of an inhomogeneous surface plasmon electric field that occurs outside the solid and whose intensity is locally stronger than the field of the laser. This approach has been proved to describe fairly well the ponderomotive effects in the presence of SP waves. Its success is rooted in the fact that the electron acceleration is related to the amplitude of the pondero-motive potential rather than to the exact form of the local field when the electron can fully explore the spatial extension of the field. Since the analytical expressions for the electro magnetic field of the surface plasmon waves on the arrays considered are not known, we describe the surface plasmon in the present calculations in the same way as in [27]. For sure, such a pre-liminary description could be improved upon, e.g. by taking the numerical output fields obtained from standard electro-magnetic simulations [57] whereby the shape of our surface is taken into consideration. But such a refinement is beyond the scope of the present work, which merely focuses on the wave-length dependence of the electron energy gain (in the presence of an SP excitation or otherwise) and on the tendencies one may discern in its effects on the photoemission spectra.
In our model, the SP-stimulated electron emission process is treated as a two-step mechanism. The first step considers the electronic transitions from the metallic conduction band towards the solid continuum that are induced by the surface plasmon field. Just like in the single-crystal case it is described by means of the JV method. The corresponding primary spectra are reported in the inset of figure 7(B) for the same laser parameters as those of figure 5, and with an enhancement factor η of 80 in the 800 nm case. Here η = E ESP/ 0, where
ESP and E0 are the amplitudes of the Surface Plasmon field
and of the laser field, respectively. The choice of this value is consistent with the one obtained in [27] in the IR case. In the UV case we have taken η = 20 as it is known [58] that the enhancement factor is much less important in the UV case than in the IR case. This is in part due to the variations of the real and imaginary parts of the dielectric function of the metal as a function of the wavelength of the impinging photons (from [59] one has: ε(800 nm ) = −22.7+0.75i and
( ) = − +
ε 266 nm 1.2 4.4i). A further effect may be induced by the geometry, i.e. the roughness of the surface resulting from the large but finite size (∼ 215 nm) of the objects on the surface.
The primary spectra corresponding to the IR and UV cases reported in the inset of figure 7(B), have been obtained by con-sideration of a surface plasmon field intensity of 5.6 V nm−1
at 800 nm and 1.4 V nm−1 at 266 nm. The IR primary
spec-trum shows three peaks located around 0.5, 2 and 3.5 eV corresponding to the absorption of four, five and six photons, respectively. For the UV primary spectrum, one observe only one broad peak similar to the one reported in figure 7(A) and related to a two UV photons absorption process. These primary spectra have similar intensities in spite of the fact that the two UV photon absorption process is more probable than the higher order IR ones. This comes from the fact that the enhancement factor is more important in the IR case than in the UV one.
The second step of the model generates the final spectra of figure 7(B). It is based on a classical description of the motion of the freed electrons along the two spatial components of the inhomogeneous oscillating surface plasmon field in the region outside the target surface. During their motion these electrons gain more or less energy. This depends in fact on their initial conditions. The latter are provided by the quantum calculations of the first step in terms of the ejection energy, the emission angle and the instant of release. Note that the electron accel-eration, deceleration and re-acceleration which we discussed previously and which contribute to the broadening of the final electron energy distribution towards higher values [15, 17, 49,
50] is also taken into account in the present model. Again, due to the important variations of the dielectric function (of its real part in this case) with respect to the energy of the photon, the decay length δ of the SP field outside the solid in the IR case is δ800 594 nm and δ266 25 nm in the UV one. Therefore, the
electrons emitted by the IR pulse are gaining more energy out-side the metal than those ejected by the UV pulse, even though both types of pulses convey essentially the same initial energy to the electrons. The reason for the difference is the fact that the enhancement factor and the decay length are greater in the IR case than in the UV case. As can be seen in figure 7(B), this results in a weak shift towards higher energies in the final UV (266 nm) spectrum with respect to the corresponding primary spectrum, while the shift is large in the IR (800 nm) case. In the latter case, there is also a high-energy tail related to the five and six photons IR absorption process. This is consistent with the conclusions that can be drawn from the experimental data shown in figure 5 and with the variation of the electron ponderomotive acceleration within the local induced surface plasmon field which varies as Iλ2.
In conclusion, this preliminary model validates our inter-pretation of the experiments. It demonstrates the variation of the ponderomotive acceleration with the laser wavelength. As previously stated, this model does not take into account the electron–electron interactions inside the emitted bunch. This effect gets growing importance when the number of ejected electrons increases. This explain why the range of kinetic energy obtained in the figure 7(B) is significantly nar-rower than that shown in the experimental data of figure 5. In order to take this effect into account, it would be necessary to develop an improved model that takes into account the motion of the freed electron cloud outside the solid, but this is beyond the scope of the present work.
3.4. Regime of high laser intensities
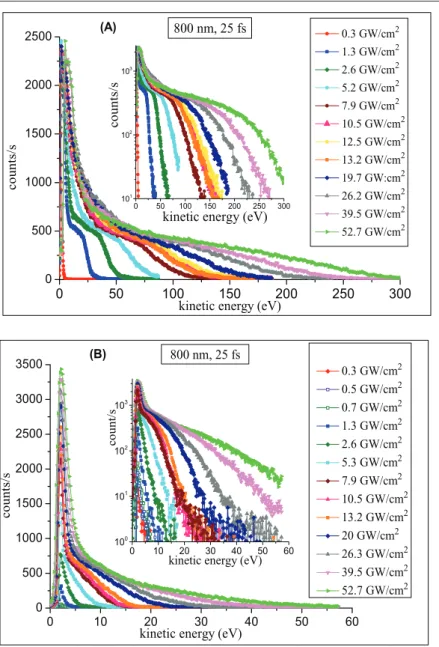
As previously shown in section 2.2 (see figure 5), increasing the laser intensity leads to the production of electrons with high kinetic energies in the N-O array target. In figure 8(A), we have reported the photo-emitted electron spectra of this target irradiated with a 800 nm laser pulse of 25 fs pulse dura-tion and a laser intensity ranging from: 0.3 GW cm−2 to 53
GW cm−2. These laser intensities are well below the damage
threshold of the targets.
It is worth noting that electrons with energies as high as 300 eV have been obtained for a laser intensity of only 53 GW cm−2. In the same range of laser intensities, the
elec-trons emitted from the gold single crystal acquire much less kinetic energy as shown by figure 8(B): at I = 26 GW cm−2, we
obtain electrons of 45 eV with the single crystal against 240 eV with the N-O array target. It also appears that the higher the intensity is, the smoother the distribution for the high-energy part of the spectra turns out to be. This behaviour is consistent
with the behaviour of an equilibrated electron gas, as previ-ously discussed. The slope of the distribution is related to the electron temperature. Indeed, the higher the intensity is, the more efficiently the electrons will be heated by the laser and the higher the temperature will be, thus leading to smoother energy distributions when the laser intensity increases.
To conclude this study of the N-O array targets, we have compared in figure 9 the maximum kinetic energy of the electrons as a function of the laser intensity for the two laser wavelengths of 800 nm and 266 nm. As observed previously, with the longer wavelength one obtains electrons of higher energies. Moreover, in the range of intensities studied there is no sign whatsoever of a saturation with laser intensity of the maximum energy the electrons can reach when the target is excited at 800 nm, while saturation effects do seem to occur at 266 nm. A fit of these data based on a power dependence pro-vides an exponent of roughly 0.61. Assuming that the electron gas is free, independent and in equilibrium at a temperature
Figure 8. Spectra of photo-emitted electrons from the N-O array target (A) and the gold single-crystal target (B) irradiated with a 800 nm laser pulse with the laser intensity ranging from: 0.3 GW cm−2 to 53 GW cm−2 (inset: same with a log scaling for the counts s−1). The laser pulse duration is 25 fs.
significantly smaller than the Fermi temperature, one finds that the maximum energy the electrons can reach lies close to the Fermi energy. This Fermi energy varies as ne2 3/ with the electron density ne. When the electron density is proportional
to the laser intensity, the maximum energy is observed to vary as I0.61, and thus as n
e
0.61. The exponent is close to 2/3, which
provides further support to the idea that the aforementioned relaxation processes are part of the mechanism that prevails during the emission.
The previous observations clearly highlight the interest of using longer wavelengths. By tailoring the geometry of the array of the nano-objects and concomitantly the geometry of the SP, one could obtain electron pulses of higher energies. This could open the way to new prospects in plasmon-driven electron sources and lightwave electronics. In particular, this
makes this type of target of special interest for processes that involve the emission of hot electrons and high currents.
3.5. Two-color pump–pump experiments
Two-color pump–pump experiments have also been per-formed. The aim of these experiments was to compare the electronic relaxation dynamics that take place in the N-O array target when the SP is excited with the dynamics that occur in the gold single-crystal sample. In these experiments a first pump is operated at a wavelength of 800 nm, an intensity of ∼ 5 GW cm−2, and an incidence angle of 45 . It is used
to excite the single-crystal target or the SP in the N-O array target. The energy of the photons is less than the threshold for inter-band transition in gold (2.3 eV [45]), such that the pump
Figure 9. Maximum kinetic energy of the electrons from the N-O array target irradiated with a 800 nm and a 266 nm laser pulse as a function of the laser intensity.
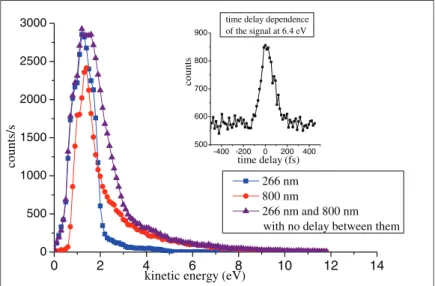
Figure 10. Spectra of photo-emitted electrons in the case of the gold single-crystal sample irradiated with the 800 nm beam alone at
5.5
∼ GW cm−2 (red filled circles), with the 266 nm beam alone at ∼0.13 GW cm−2 (blue filled squares) and with both laser beams when there is no-delay between them (violet filled triangles). The inset shows the delay time dependence of the signal at 6.4 eV.
0 2 4 6 8 10 12 14 0 500 1000 1500 2000 2500 3000 counts/s
kinetic energy (eV)
266 nm 800 nm
266 nm and 800 nm with no delay between them
-400 -200 0 200 400 500 600 700 800 900 count s time delay (fs)
time delay dependence of the signal at 6.4 eV
creates a transient non-equilibrium electron distribution. The second pump is operated at 266 nm with a lower intensity than that of the IR pulse. The aim of the set-up is to monitor the changes induced in the sample photoemission as a function of the delay between the two laser beams. The angle of incidence of the 266 nm laser beam is 30 . This choice is motivated by
our desire to stay far out of tune with the SP excitation when we study the N-O array target.
The spectra of the photo-emitted electrons obtained from the gold single-crystal sample are reported in figure 10. It shows the data obtained with: the 800 nm pump alone (red line), the 266 nm pump alone (blue line) and both laser beams simultaneously but without any delay between them (magenta line). The reference spectra (800 nm alone and 266 nm alone) show the undisturbed electron energy distributions obtained with each individual pump beam. The spectrum obtained with
the two-color beam in zero delay is also reported and exhibits a tail above 6 eV. This tail accounts for the changes induced within the gold single crystal. In the inset of figure 10, the evol ution of the signal (at 6.4 eV) as a function of the time delay between the two pulses is shown. A fit of the decrease of the signal intensity with an exponential function yields a char-acteristic time of τ = 78 fs (±5 fs). This value is in agreement with previous values reported for gold [60, 61] and accounts for the fast electron–electron relaxation dynamics towards a quasi-equilibrium distribution. This takes place on a timescale much shorter than that of a cooling mechanism based on an energy transfer to the lattice through electron–phonon col-lisions [62, 63].
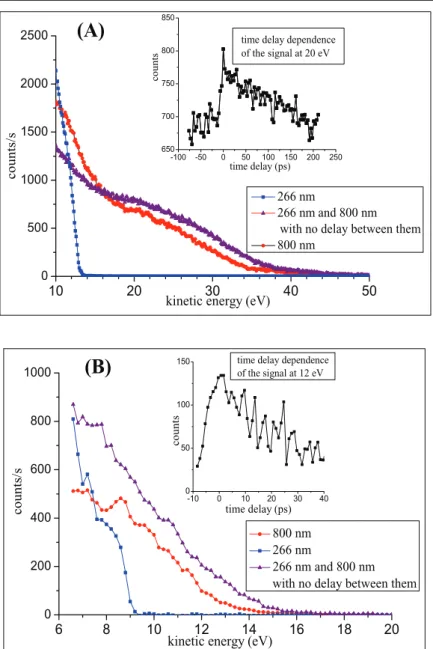
As figure 11(A) shows, the time dependence of the signal obtained with the N-O array target is quite different from that obtained with the single-crystal sample. On rough surfaces or
Figure 11. Spectra of photo-emitted electrons: (A) for the NO target (r∼215 nm) irradiated with the 800 nm beam alone at ∼1.8 GW cm−2) (red filled circles), the 266 nm beam alone at ∼1 GW cm−2 (blue filled squares) and with both beams when there is no-delay between the two laser beams (violet filled triangles), and (B) for the NO-100 target (r∼ <100 nm) irradiated with the 800 nm beam alone at ∼5 GW cm−2) (red filled circles), the 266 nm beam alone at ∼0.1 GW cm−2 (blue filled squares) and with both beams when there is no-delay between them (violet filled triangles). The inset gives the delay time dependence of the signal at 20 eV (A) and 12 eV (B).
in large nano-objects (that are deposited on some support), the relaxation dynamics of an electron distribution that has not yet reached its equilibrium can be influenced by thermal effects. These can be due to the finite size of the objects or to the shape of the roughness. Indeed, in the case of the gold single-crystal the interaction area is very large (in the mm scale). The time scales on which heat diffusion (which is here significant) and the evolution of the electron and lattice temperatures towards equilibrium take place are in the present experiment much longer than the time delay between the two pulses. There is thus no evolution of the photoemission signal to be expected in response to a variation of the temperature. The rough sur-face under study here, is constituted of finite-size objects that may increase the heat transfer significantly. This will lead to a fast decrease of the temperature, possibly on a timescale of the same order of magnitude as that of the delay time between the two laser pulses. The fastest dynamics are dominated by electron–electron and electron–phonon relaxation in the objects, which take place on a timescale of the order of hun-dred fs and some ps, respectively. After this intrinsic relaxa-tion has taken place, the heat diffusion within the substrate is expected to take place on a longer timescale, which is of the order of hundreds of ps. An influence on the temporal evol-ution of the photo-emission signal is thus expected [42]. The two following possible mechanisms can be suggested. First, since the electrons are initially distributed according to the Fermi–Dirac statistics [27], the higher the temperature is, the higher the initial energy of electrons will be. This modifica-tion in the initial condimodifica-tions for the energy should thus have an influence on the spectrum of the ejected electrons after their interaction with the laser has taken place. Second, just like in the one-color case, one may assume that heating mechanisms are also at work the bulk. They are due to the aforementioned electron–phonon–photon collisions, whose efficiency depends on the phonon population [48]. Since the latter evolves with the temperature of the material, such a mechanism is expected to have an influence on the final energy distribution of the ejected electrons. The inset of figure 11(A) shows the depend-ence of the signal on the delay time for an electron energy of 20 eV. As expected, its deconvolution now exhibits two charac-teristic decay times, τ ∼ 8301 fs (±50 fs) and τ ∼ 1172 ps (±5 ps).
They are both much longer than the decay time measured with the gold single-crystal.
In order to study the influence of the finite size of the objects, we have complemented this study with pump–pump experiments on a new target with nano-objects of smaller size (radius < 100 nm). This target will hereafter be called the NO-100 target. The inset of figure 11(B) shows the depend-ence of the signal from this target on the delay time for an electron energy of 12 eV. Its deconvolution yields two char-acteristic decay times, viz. τ = 11 ps (±50 fs) and τ = 362 ps
(±2 ps). The first decay time is due to the electron–phonon col lisions and its value is fairly close to the value found in the N-O array target where the radius of the nano-objects is larger. The observation that the characteristic time τ1 is nearly
constant is consistent with the fact that electron–phonon col-lisions are local processes that do not depend on the size of the region where they take place. Size effects can only be expected
when the size of the nano-particles is very small, i.e. in the range of a few nanometers [5]. Indeed for such small sizes, the phonon properties may change because the periodic boundary conditions are no longer valid. The electron–phonon interac-tions may therefore change as well. The second characteristic time τ2 accounts for the heat transfer from the nano-objects to
the substrate. Its value in the N-O array target with a smaller radius decreases to ∼ 36 ps (±2 ps). This observation is con-sistent with the mechanism proposed to take into account the influence of the heat transfer and the temporal evolution of the lattice temperature on the photoemission signal. Indeed, the characteristic length lc and time tc of a diffusion processes
are related according to the equation lc=2 Dtc where D is
the diffusion coefficient. Consequently, the smaller the radius of the object is, the shorter the relaxation time will be, and this is what we observe. In addition, the diffusion coefficient for bulk gold is D=1.27×10⁻⁴ m2 s−1, such that lengths in the
range of hundreds of nm correspond to timescales in the range of the hundreds of ps. These values are consistent with the present observations. Moreover, the square root dependence in the equation lc=2 Dtc is also satisfied, i.e. the ratio of
the sizes of the nano-objects is roughly the square root of the ratio of the characteristic times τ2. These considerations
sup-port thus the physical mechanism we have proposed to explain the influence of the lattice temperature on the photo-emission process.
4. Conclusion
We have presented a study in the short-(laser)pulse regime of the photo-emission properties of metallic regular 2D lattices in the presence of a surface plasmon excitation. The lattice consists of gold nano-objects. We have compared this photo-emission with the photo-photo-emission of a gold single crystal. The dependence of the emission on the laser intensity and wave-length has been addressed. The interpretations are supported by a model for the photoemission in the presence of surface plasmons.
We have shown that the use of a gold N-O array target, where the objects are well organized in an 2D array, permits the laser to excite a surface plasmon and modifies the emis-sion of the gold sample drastically. The yield of the electron current emitted from the N-O array target is enhanced by at least a factor of 50 with respect to the single-crystal sample. In these N-O array targets one observes also higher kinetic energies than can be expected based on the photoelectric balance. In addition, we have exhibited for the first time, the wavelength dependence of the photoemission from the N-O array target when the laser excites a surface plasmon. These results can be well interpreted by means of a model that describes the SP-stimulated electron emission process. A correlation has been established with the variation of the elec-tron ponderomotive acceleration in the local induced surface plasmon field, which varies as Iλ2. Finally, we demonstrate
that with increasing laser intensities, we can obtain electrons with kinetic energies as high as ∼ 300 eV at 50 GW cm−2
reached with the gold single crystal under similar irradiation conditions.
We have complemented this single-wavelength study with two-color pump–pump experiments performed in order to investigate the different types of electronic relaxation dynamics that prevail in the N-O array target and the gold single-crystal sample. The relaxation dynamics in the N-O array target are found to be much slower than in the single crystal. Two timescales for the relaxation are observed in the N-O array target. They depend on the size of the nano-objects and have been attributed to the influence of macroscopic effects such as the heat transfer. This work highlights the favorable role played by the electron ponderomotive acceleration in the local induced surface plasmon field. It opens new possibilities for tailoring the geometry of targets with nano-objects arranged in a network and for optimizing the laser excitation parameter to generate plasmonic electron sources.
Acknowledgments
This work was supported partially by the Czech Science Foundation grants No. P205/13/20110S and P108/12/G108 and the University of Ostrava project No. IRP201553. GD thanks B Chimier and L Barilleau for fruitful discussions.
References
[1] Kreibig U and Vollmer M 1995 Optical Properties of Metal
Clusters (Berlin: Springer)
[2] Vasa P, Ropers C, Pomraenke R and Lienau C 2009 Laser
Photonics Rev.3 483
[3] Mie G 1908 Ann. Phys. 25 377
[4] Klar T, Perner M, Grosse S, von Plessen G, Spirkl W and Feldmann J 1998 Phys. Rev. Lett. 80 4249
[5] Shahbazyan T V, Perakis I E and Bigot J Y 1998 Phys. Rev.
Lett.81 3120
[6] Varin C, Peltz C, Brabec T and Fennel T 2012 Phys. Rev. Lett.
108 175007
[7] Ciraci C, Hill R T, Mock J J, Urzhumov Y, Fernandez-Domínguez A I, Maier S A, Pendry J B,
Chilkoti A and Smith D R 2012 Science 337 1072
[8] Raza S, Bozhevolnyi S I, Wubs M and Mortensen N A 2015
J. Phys.: Condens. Matter27 183204
[9] Penn D R and Rendell R W 1981 Phys. Rev. Lett 47 1067
[10] Monchicourt P, Raynaud M, Saringar H and Kupersztych J 1997 J. Phys.: Condens. Matter 9 5765
[11] Lehmann J, Merschdorf M, Pfeiffer W, Thon A, Voll S and Gerber G 2000 Phys. Rev. Lett. 85 2921
[12] Kim S, Jin J, Kim Y J, Park I Y, Kim Y and Kim S W 2008
Nature435 757
[13] Baida H, Mongin D, Christofilos D, Bachelier G, Crut A, Maioli P, Del Fatti N and Vallée F 2011 Phys. Rev. Lett.
107 057402
[14] Bormann R, Gulde M, Weismann A, Yalunin S V and Ropers C 2010 Phys. Rev. Lett. 105 147601
[15] Herink G, Solli D R, Gulde M and Ropers C 2012 Nature
483 190
[16] Nagel P M, Robison J S, Hartenck B D, Pfeifer T, Abel M J, Prell J S, Neumark D M, Kaindl R A and Leone S R 2013
Chem. Phys.414 106
[17] Dombi P, Hörl A, Rácz P, Márton I, Trüger A, Krenn J R and Hohenester U 2013 Nano Lett. 13 674
[18] Kupersztych J, Monchicourt P and Raynaud M 2001
Phys. Rev. Lett.86 5180
[19] Zawadzka J et al 2001 Appl. Phys. Lett. 79 2130
[20] Irvine S E, Dechant A and Elezzabi A Y 2004 Phys. Rev. Lett.
93 184801
[21] Irvine S E and Elezzabi A Y 2006 Phys. Rev. A 73 013815
[22] Welsh G H, Hunt N T and Wynne K 2007 Phys. Rev. Lett.
98 026803
[23] Dombi P and Rácz P 2008 Opt. Express 16 2887
[24] Dombi P 2009 Adv. Imaging Electron Phys. 158 1 [25] Sussmann F and Kling M F 2011 Phys. Rev. B 84 121406
[26] Rácz P and Dombi P 2011 Phys. Rev. A 84 063844
[27] Jouin H, Raynaud M, Duchateau G, Geoffroy G, Sadou A and Martin P 2014 Phys. Rev. B 89 195136
[28] Zherebtsov S et al 2011 Nat. Phys. 7 656
[29] Foldi P, Marton I, Nemet N, Ayadi V and Dombi P 2015
Appl. Phys. Lett.106 013111
[30] Liu M, Guyot-Sionnest P, Lee T-W and Gray S K 2007
Phys. Rev. B 76 235428
[31] Chu P and Mills D L 2007 Phys. Rev. Lett. 99 127401
[32] Chu Y, Schonbrun E, Yang T and Crozier K B 2008
Appl. Phys. Lett.93 181108
[33] Kravets V G, Schedin F and Grigorenko A N 2008 Phys. Rev.
Lett.101 087403
[34] Conley G M, Burresi M, Pratesi F, Vynck K and Wiersma D S 2014 Phys. Rev. Lett. 112 143901
[35] Meinzer N, Barnes W and Hooper I R 2014 Nat. Photon.
8 889
[36] Lamprecht B, Schider G, Lechner R T, Ditlbacher H, Krenn J R, Leitner A and Assenegg F R 2000 Phys. Rev.
Lett.84 4721
[37] Hicks E M, Zou S, Schatz G C, Spears K G, van Duyne R P, Gunnarsson L, Rindzevicius T, Kasemo B and Kall M 2005
Nano Lett.5 1065
[38] Auguiè B and Barnes W L 2008 Phys. Rev. Lett. 101 143902
[39] Sung J, Hicks E M, Van Duyne R P and Spears K G 2008
J. Phys. Chem. C 112 4091
[40] Raether H 1988 Surface Plasmon on Smooth and Rought
Surfaces and on Gratings (Springer Tracts in Modern
Physics vol 111) (Berlin: Springer)
[41] Kretschmann E and Reather H 1968 Z. Nat.forsch. A 23 2135 [42] Pfeiffer W, Kennerknecht C and Merschdorf M 2004 Appl.
Phys. A 78 1011
[43] Ulstrup S et al 2015 J. Phys.: Condens. Matter 27 164206
[44] Kosiorek A, Kandulski W, Chudzinski P, Kempa K and Giersig M 2004 Nano Lett. 4 1359–63
[45] Cooper B R, Ehrenreich H and Philipp H R 1965 Phys. Rev.
138 494
[46] Petite G, Agostini P, Trainham R, Mevel E and Martin P 1992
Phys. Rev. B 45 12210
[47] Michaelson H B 1977 J. Appl. Phys. 48 4729
[48] Rethfeld B, Kaiser A, Vicanek M and Simon G 2002 Phys.
Rev. B 65 214303
[49] Kupersztych J, Raynaud M and Riconda C 2004 Phys.
Plasmas11 1669
[50] Riconda C, Raynaud M, Vialis T and Grech M 2015 Phys.
Plasmas22 073103
[51] Yannopapas V 2008 J. Phys.: Condens. Matter 20 325211
[52] Persechini L, Verre R, McAlinden N, Wang J J, Ranjan M, Facsko S, Shvets I V and McGilp J F 2014 J. Phys.:
Condens. Matter26 145302
[53] Negre C F A, Perassi E M, Coronado E A and Sanchez C G 2013 J. Phys.: Condens. Matter 25 125304
[54] Faraggi M N, Gravielle M S and Mitnik D M 2007 Phys. Rev. A 76 012903
[55] Lemell C, Tong X-M, Krausz F and Burgdörfer J 2003 Phys.
Rev. Lett.90 076403
[56] Fennel Th, Döppner T, Passig J, Schaal Ch, Tiggesbäumker J and Meiwes-Broer K H 2007 Phys. Rev. Lett. 98 143401
[57] Oskooi A F, Roundy D, Ibanescu M, Bermel P,
Joannopoulos J D and Johnson S G 2010 Comput. Phys.
Commun.181 687
Hohenester U and Trugler A 2012 Comput. Phys. Commun.
183 370
[58] Weber W H and Ford G W 1981 Opt. Lett. 6 122
[59] Lide D R 2003 Handbook of Chemistry and Physics 84th edn (New York: CRC Press)
[60] Cao J, Gao Y, Elsayed-Ali H E, Miller R J D and Mantel D A 1998 Phys. Rev. B 58 10948
[61] Aeschlimann M, Bauer M, Pawlik S, Knorre R, Bouzerar G and Bennemann K H 2000 Appl. Phys. A 71 485
[62] Schoenlein R W, Lin W Z, Fujimoto J G and Eesley G L 1987
Phys. Rev. Lett.58 1680
[63] Fann W S, Storz R, Tom H W K and Bokor J 1992 Phys. Rev.