HAL Id: hal-02366236
https://hal.archives-ouvertes.fr/hal-02366236
Submitted on 18 Nov 2020
HAL is a multi-disciplinary open access
archive for the deposit and dissemination of
sci-entific research documents, whether they are
pub-lished or not. The documents may come from
teaching and research institutions in France or
abroad, or from public or private research centers.
L’archive ouverte pluridisciplinaire HAL, est
destinée au dépôt et à la diffusion de documents
scientifiques de niveau recherche, publiés ou non,
émanant des établissements d’enseignement et de
recherche français ou étrangers, des laboratoires
publics ou privés.
Population-based meta-heuristic for active modules
identification
Leandro Corrêa, Denis Pallez, Laurent Tichit, Olivier Soriani, Claude Pasquier
To cite this version:
Leandro Corrêa, Denis Pallez, Laurent Tichit, Olivier Soriani, Claude Pasquier.
Population-based meta-heuristic for active modules identification.
10th International Conference on
Com-putational Systems-Biology and Bioinformatics (CSBio 2019), Dec 2019, Nice, France.
pp.1-8,
Population-based meta-heuristic for active modules
identification
Leandro Correa
[email protected] Université Côte d’Azur, CNRS, I3S,
France
Denis Pallez
[email protected] Université Côte d’Azur, CNRS, I3S,
France
Laurent Tichit
[email protected] Aix Marseille Univ, CNRS, Centrale
Marseille, I2M, France
Olivier Soriani
[email protected] Université Côte d’Azur, CNRS,
INSERM, iBV, France
Claude Pasquier
[email protected] Université Côte d’Azur, CNRS, I3S,
France
ABSTRACT
The identification of condition specific gene sets from transcrip-tomic experiments has important biological applications, ranging from the discovery of altered pathways between different phe-notypes to the selection of disease-related biomarkers. Statistical approaches using only gene expression data are based on an overly simplistic assumption that the genes with the most altered expres-sions are the most important in the process under study. However, a phenotype is rarely a direct consequence of the activity of a single gene, but rather reflects the interplay of several genes to perform certain molecular processes. Many methods have been proposed to analyze gene activity in the light of our knowledge about their molecular interactions. We propose, in this article, a population-based meta-heuristics population-based on new crossover and mutation op-erators. Our method achieves state of the art performance in an independent simulation experiment used in other studies. Applied to a public transcriptomic dataset of patients afflicted with Hepa-tocellular carcinoma, our method was able to identify significant modules of genes with meaningful biological relevance.
CCS CONCEPTS
• Theory of computation → Evolutionary algorithms; • Ap-plied computing → Computational transcriptomics; Biolog-ical networks.
KEYWORDS
active module identification, transcriptome analysis, protein-protein interaction, differential expression, NSGA-II
ACM Reference Format:
Leandro Correa, Denis Pallez, Laurent Tichit, Olivier Soriani, and Claude Pasquier. 2019. Population-based meta-heuristic for active modules identifi-cation. In 10th International Conference on Computational Systems-Biology
Permission to make digital or hard copies of all or part of this work for personal or classroom use is granted without fee provided that copies are not made or distributed for profit or commercial advantage and that copies bear this notice and the full citation on the first page. Copyrights for components of this work owned by others than ACM must be honored. Abstracting with credit is permitted. To copy otherwise, or republish, to post on servers or to redistribute to lists, requires prior specific permission and/or a fee. Request permissions from [email protected].
CSBio 2019, December 4–7, 2019, Nice, France © 2019 Association for Computing Machinery. ACM ISBN 978-1-4503-7215-2/19/12. . . $15.00 https://doi.org/10.1145/3365953.3365957
and Bioinformatics (CSBio 2019), December 4–7, 2019, Nice, France. ACM, New York, NY, USA, 8 pages. https://doi.org/10.1145/3365953.3365957
1
INTRODUCTION
High throughput technologies are now able to reliably quantify, on an organism-wide basis, molecular changes occurring in response to disturbances or diseases. Usually, in a first step, these experimen-tal results are analyzed using statistical or data mining methods to generate scores expressing the degree of involvement of each gene in the process under study. In a second step, one tries to identify active gene modules by testing whether genes known to co-operate in some biological process belong to high scoring genes. The draw-back of this two-step procedure is that it may not identify genes whose combined action is essential in the process under study but whose individual scores are too low.
Inspired by the seminal work from Ideker et al. [22], many meth-ods have been proposed to analyze gene activity in the light of our knowledge about their molecular interactions. These molecular interactions provide a convenient framework for understanding changes in gene expression and for integrating a wide variety of global state measurements. In the articles on this subject, these per-tinent sub-network are named "context-dependent active subnet-works" [20], "functional module" [5], "maximal scoring subgraph" [14] or "altered subnetworks" [34]. As pinpointed by Rapaport et al. [33], "a small but coherent difference in the expression of all the genes in a pathway should be more significant than a larger dif-ference occurring in unrelated genes". To identify these groups of genes considered relevant, it is therefore necessary to allow sensible trade-offs between the involvement of genes in the process and their proximity. The underlying idea of active module detection methods is to simultaneously take into account these two criteria: one based on a measurement of genes activity and the other one reflecting the proximity between genes composing the subnetwork. Ideker et al. [22] uses a simulated annealing approach that works by randomly selecting a subnetwork and then gradually modifying it by adding or removing nodes until a subnetwork that includes genes with a high activity level is reached. Inspired by this first study, other meta-heuristic approaches have been developed, using for example population-based approaches that maintain and im-prove multiple candidate solutions instead of a single one [26, 29], sometimes by integrating prior biological knowledge [9]. One of the major interest in using population-based meta-heuristics lie in
CSBio 2019, December 4–7, 2019, Nice, France Leandro Correa, Denis Pallez, Laurent Tichit, Olivier Soriani, and Claude Pasquier
the possibility to obtain several good solutions or, when dealing with multi-criteria, to approximate the Pareto front. Other meth-ods adopt the concepts of network propagation. They assume that the diffusion of information in a biological network is similar to the flow of fluid or heat in a pipeline network. Thus, in biological systems, values measuring gene activity flow outward along the network and accumulate in some regions. Regions that accumulate the maximum flow are then detected as active modules [4, 14, 36]. Somewhat similar approaches consist in performing random walks on the network (or more precisely biased walks to encourage visits to the most active nodes) with the idea that the walks are more likely to remain in subnetworks with high interactions between its members [19, 32]. Approaches based on greedy algorithms, start from clusters composed of a single node and gradually extend them with neighboring nodes in order to maximize the score of the spe-cific subnetwork [18, 28]. Finally, some methods treat the problem as a clustering problem [40] or a prize-collecting Steiner problems [41]. A very recent survey on active modules identification can be found in Nguyen et al. [30].
In this paper, we propose a population-based meta-heuristic based on NSGA-II [13] by integrating new genetic operators, i.e. specific crossover and mutation operators. The paper is organized as follows: next section formalizes active modules identification in a biological network; section 3 presents in detail how genetic operators of the Evolutionary Algorithm (EA) have been adapted for modules identification; section 4 tests our method called AMI-NSGAII (Active Modules Identification with NSGA-II ) on simulated data in order to have a fair comparison with other state-of-the-art methods. Finally, section 5 apply our framework on real expression data with biological interpretations of the results achieved.
2
PROBLEM DEFINITION
Contextualized protein-protein interaction (PPI) networks can be modeled as node-weighted undirected graphsG = (V, E, ω), where V = {v1,v2, ...,vn} is a set ofn nodes (genes) and E ⊆ V ×V is a set
ofm (undirected) edges between pairs of nodes {vi,vj} obtained from available interactome dataset.
Letω be a weighting function such that the set {ω(v),v ∈ V } contains values indicating the statistical significance of the expres-sion change of each genev in a specific condition relatively to other conditions [16]. In such a case: ∀v ∈ V , ω(v) ∈ [0, 1].
Our objective is to identify an induced subgraphG′= (V′, E′) such thatV′⊂V and E′= {E ∩ V′×V′} in such a way thatV′ contains nodes that are both close to each other on the graph and that are associated to weights significantly higher than the rest of the nodes. The notion of closeness as well as the way to quantify the importance of node weights will be more formally defined in the following section. Such set of nodes is called an active module in the subsequent parts of the document.
Quantifying the activity of a group of genes is not trivial and has been differently formalized by many works. In the literature, mea-sures such asZAscore [22], normalized variance [42], Hostelling’s T2[25] or the unbiased score function of Nikolayeva et al. [31] have
been proposed.
In this paper, we are considering two criteria: theZAscore as defined by Ideker et al. [22] and an aggregation of the essentiality of genes, as defined by Jiang et al. [23].
A gene is considered essential when loss of its function com-promises the viability or fitness of the system [3]. The measure of gene essentiality, proposed by Jiang et al. is computed as the sum of normalized expression level variation of its neighbors in the interactome network. Since our genetic operators are strongly linked to the neighborhood criterion, the essentiality of each gene in the neighborhood is a good indicator for the selection of candi-dates that bolster the generation of better offsprings. In order to determine the essentiality of genes based on p-values, we use in the formulae, the z-score associated to the p-valueω(v) (eq. 1).
If we considerN (v) = {n1, n2, ..., np} as the set of neighbors of
one genev ∈ V of graph G, the essentiality of v, E(v), is defined as: E(v) = |N (v)|1 Õ
ni∈N (v)
z(ni) (1)
wherez(v) is the z-score associated to the p-value ω(v). We compute z(v) as follows: z(v) = Φ−1(1 −ω(v)) where Φ−1 is the inverse
normal cumulative distribution function [22].
By usingE(v), our intention is to favor the choice of genes that are connected to many hot spots in the network. Thus, we define our first criteriaf1as the mean of genes’essentiality for all genes
included in the active module. It is formalized in eq. (2): f1(V′)= |V1′|
Õ
vi∈V′
E(vi) (2)
TheZAscore, as proposed by Ideker et al. [22] is defined in eq. (3): f2(V′)= za = 1 p|V′| Õ vi∈V′ z(vi) (3) Our objective is to simultaneously maximize both criteria (f1
andf2) without any priority on each of them for identifying groups
of genes with high activation. The problem of active modules iden-tification can finally be formalized by eq. (4):
maximize V′⊂V F (V ′)= {f 1(V′), f2(V′)} subject to |V′| ≥x1, |V′| ≤x2 (4)
wherex1andx2correspond to the expected size range for final
active modules. One way to find quasi-optimal solutions for this problem is to use evolutionary algorithms as NSGA-II [13]. The algorithm with specific genetic operators, which is the main contri-bution of this paper, is presented hereafter.
3
PROPOSED METHOD
In this section we describe the evolutionary algorithm (EA) built for the identification of active modules in biological networks. The search problem is formulated as a multi-objective optimization problem considering candidate solutions as sets of vertices (cf. sec-tion 2).
We use an elitist process based on NSGA-II [13] (see algorithm 1) for the implementation of non-dominated sorting approach and
an adaptive rejection threshold is used to eliminate ill-adapted solutions.
Algorithm 1: NSGA-II
In :sizepop, sizeproblem, pX Over, pmutation, F = (f1, f2)
Out : an approximated Pareto front
1 t ← 0; Qt ← ∅
2 Pt ← Initialize(sizepop, sizeproblem) 3 Evaluate(Pt, F )
4 while ¬StoppingConditions(t,Pt)do
5 Qt ← Offspring(Pt, pX Over, pmutation)
6 no unneeded package or option Evaluate(Qt, F ) 7 Rt ←Pt∪Qt
8 f ronts ← NonDominatedSorting(Rt) // fronts={p f1, p f2, . . . }
9 Pt +1← CrowdingDistanceSorting(f ronts, sizepop)
10 t ← t + 1 11 returnpt
Starting from a population of potential solutions (usually ran-dom) to the given problem, EA use the principles of evolution and natural selection to make these solutions evolve, with the aim of having better solutions at each generation. In the first step, several of these individuals are created and placed within a population (line 2 of algorithm 1). During the crossover step (line 5), these individuals are mated with each other to generate new offspring (the underlying idea being that some of the offsprings will be better solutions than their parents). Random changes are also introduced during the recombination process (line 5), ensuring the possibility to escape from local minima. After the recombination process, each individual is quantitatively evaluated using an objective function called fitness functionF that combines eqs. (2) and (3) (lines 3 & 6). Its goal is to guide the process towards optimal design solutions. Then, according to NSGA-II procedure, parents and offspring are joined (line 7) and an elitism procedure is applied (line 8) to give pri-ority to non-dominated solutions in the Pareto front, thus retaining them for the next generation. In the last step of the process (line 9), the algorithm applies a crowding distance sorting to favor spreaded solutions on the Pareto front. The process is repeated until a stop criterion is met (line 4).
In the next sections, we focus on different steps for adapting NSGA-II to our context: how to represent active modules, how to initialize them, how to cross and mutate them?
3.1
Active Modules Representation
In the context of active module detection, one solution is classically represented as a binary vector of lengthn (the total number of genes contained in the graphG) where the i − th element in the vector being 1 if the given gene is present in the active module; and 0 otherwise [26].
Since the size of the search space is 2n, this combinatorial opti-mization problem turns out to be NP-hard [22]: an exhaustive search for an optimal solution becomes computationally prohibitive when n is large.
In the identification of active modules, an important property to ensure (which is often omitted in papers) is the connectedness of the final subnetwork (i.e. the fact that the active module forms a single connected component). This detail is important because without ensuring this property, the identification of the most active module would be trivial, i.e it would come down to the set of iso-lated top-ranked nodes in the network, according to the statistical significance of their differential expression [24].
Conversely, finding active modules by considering a “strong” connectivity between its genes is not always relevant as biological networks do not contain every biological interaction that may occur in vivo (i.e. some interactions are missing). That is why we introduce in this paper a more ”relaxed” connectedness based on a given distanced.
Equation (5) defines thed-connectedness of subnetwork G′⊆G in the networkG: d−connected(G′, G) ⇐⇒ ∀v1∈G′, ∃v2∈G′:dG(v1,v2) ≤d and Ð i Pi ∪G ′is a connected component (5) wheredG(v1,v2) is the length of the shortest pathPibetweenv1
andv2inG. In our experiments (see sections 4 and 5), we consider
d = 2. Intuitively, this property leads to subnetworks that are composed of a set of connected componentsPi, where each one of these components isd edges (maximum) appart from each other.
This issue is taken into consideration throughout the algorithm, i.e. during the initialization, crossover and mutation processes. Ex-planations are given in the relevant sections below.
3.2
Initial Population
Traditionally, the initial population of solutions is randomly built. However, in order to avoid too sparse solutions (i.e. modules con-taining too many isolated nodes), we impose, as explained previ-ously, each module to be 2-connected.
We use the following random process for generating a given individual: one gene is randomly chosen as the seeded genes from the pool of genes contained in the biological networkG. Next, a random neighboring node is added. In order to narrow the search scope and to stay in the vicinity ofs, only neighbors of maximum distanced from s are taken into account. This process is iterative: neighboring nodes are added until the final size of the individual is reached.
We initialize our populationP by a set of individuals using pre-vious heuristic. The number of individuals in the initial population is user-defined. Similarly, the size of each individual is randomly defined within a range set by the user ([x1, x2] in eq. (4)).
3.3
Crossover operator
In order for thed-connectedness property to hold for every indi-vidual, we define a specific crossover operator that maintains this restriction during the whole evolution process. The goal of the crossover operator is to combine genetic features of two solutions extracted from a current populationP for generating offsprings. Offsprings are supposed to contain genetic features of both parents and are expected to represent better solutions than their parents.
CSBio 2019, December 4–7, 2019, Nice, France Leandro Correa, Denis Pallez, Laurent Tichit, Olivier Soriani, and Claude Pasquier
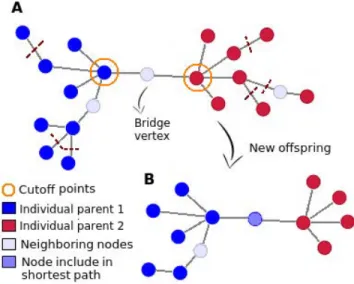
LetP1andP2be two parent solutions (represented in blue and red
in fig. 1) identified thanks to a tournament selection of sizeT on the populationP. In our experiments, we consider T = 4. By computing shortest paths1between every vertex ofP1and every vertex ofP2
in the networkG, we are able to identify two cutoff points c1andc2
(circled in orange in fig. 1). They represent crossover points of the two-point crossover [12] along which genetic features ofP1andP2
can be exchanged.
If the distance betweenc1andc2is greater thand (eq. (5)), the
in-dividualsP1andP2are too distant from each other to be considered
for breeding. If the distance betweenc1andc2is lower than or equal
tod, it means that both individuals P1andP2can be mated: the
union ofP1andP2will be used for the exchange of genetic material.
The setS of vertices belonging to the shortest path between c1and
c2will also be added to hold thed-connectedness property. But if
all of these vertices are kept, the size of the temporary solutions can increase very rapidly throughout the evolution process. To avoid this drawback, a certain ratior (r = 40−60 % in our experiments) of the vertices are discarded in offsprings in order for the individuals to keep a roughly constant size. Vertices to be deleted are taken from the set of vertices that have a distance greater thand with c1
andc2as it is presented in fig. 1.
Figure 1: A) Crossover between two candidate solutions (red and blue) ensuring thed-connectedness. Cutoff points are identified from shortest paths between two solutions. B) Pos-sible crossed solution containing genetic material of both parents plus vertices included in the shortest path (bridge vertex).
When computing the shortest paths betweenP1andP2, one can
argue that several pairs of (c1, c2) may be considered. In that case,
we randomly choose one pair of (c1, c2) such thatciis not a cut
ver-tex inPi(i ∈ [1, 2]). In graph theory, a cut vertex (circled in green in
fig. 2) is a vertex whose removal increases the number of connected
1Using Breadth-first search algorithm from the "igraph" R package,
https://cran.r-project.org/web/packages/igraph/igraph.pdf
components in the graph (by considering thed-connectedness in our case).
3.4
Mutation operator
The mutation operator aims to introduce bias in the genetic material of individuals so as to maintain a certain diversity in the current population of the EA.
Figure 2: A) Individual selected for mutation (in purple) and possibled-connected vertices in G (in gray). Mutation operators consists either in removing one vertex (crossed) or swaping a gene (marked ’−’) by another one in the d-neighborhood (marked ’+’). Mutation can not be applied on cut vertices (surrounded in green). (B) Mutated individual
To hold thed-connectedness in each individual, our mutation strategy is based on two processes: removal of one vertex in the con-sidered solution (associated to probabilitypr) and swaping of one vertex with another one in thed-neighborhood (with probability ps). Both processes are not applied on cut vertices to maintain the d-connectedness as shown in fig. 2. Moreover, they are exclusive: when the mutation strategy is decided, only one of them is applied with its corresponding probability. In our experiments (sections 4 and 5), we setpr = 0.08 and ps = 0.3.
4
EXPERIMENTS ON SIMULATED DATA
We consider the same simulation experiment used in MRF [36] method to evaluate our results. In addition to Knode [11] and Bionet [5] tools, originally used in the study, we add the results of CO-SINE tool [26] since COCO-SINE also uses a strategy based on EA for identification of active modules.
The experiment consists in a scale free network that follows the Barabasi-Albert model of preferential attachment [1] with 1000 vertices containing three clusters of vertices ‘hits’ resulting in a total of 30 ‘true hit’ vertices. The p-values for hit vertices were simulated from a truncated Gaussian distribution with a mean of 0.0 and a standard deviation of 0.05, while no-hit vertices have p-values simulated from a standard uniform distribution [36].
Some methods used as a comparison in the original study do not guarantee a maximum or minimum amount of genes for the activated module identified. For example, the Knode method results in a score for each gene contained in the network where the final list of genes is selected by the user based on the set of higher score genes obtained.
On the other hand, Bionet and COSINE output a list of genes which indicates the largest expressive active module identified. It is worth emphasizing that Bionet presents high variation in the number of genes identified and generally identifies a high number of false positives. However, even without accounting for the false positives, the true identifications are still generally worse than the other methods.
The authors apply the three selected methods (MRF, Bionet and Knode) over 1000 simulations and compare the top 30 genes identi-fied by Knode and MRF against the true positive genes identiidenti-fied by Bionet. The recall metric was used to measure the accuracy of the results, since the limitation of the size of the output in MRF and Knode can lead to a bias in the identification of false positives.
Given a setG of genes, let T P denote the number of correctly identified genes withinG and F N denote the number of falsely unidentified genes, the recall of the setG is defined as:
recall(G) =T P + FNT P (6) Due to a prohibitive execution time, we only selected 50 of these simulations and compared the results to our approach. We tried to identify 3 active modules composed of 10 to 30 genes. In addition to these results, we also added the results of COSINE, using for each execution a limit of 300 generations and a minimum number of modules equal to 30. The performance of our analysis was also evaluated using recall for comparison with the experiments used in the MRF tool2.
The algorithm was executed three times on each network. For each interaction, we extracted the best module and set each node that composes it with p-value equal to 1. The best modules are se-lected from the first Pareto front, based on the best values obtained from the fitness functionf2(since the fitness functionf1is only
meant to improve the evolutionary process). In order to compare with the other tools, we initially filter out from our first Pareto front modules that contain the smallest number of nodes (usually 10) to decrease the probability of gain from the false positives.
We have obtained significantly better results when compared to the tools: Knode, Bionet and COSINE, as one can see in the Figure 3. However, we found difficulties in comparing our results with the MRF tool due to the requirement of proprietary matlab libraries for its execution. Taking into account the results presented in the MRF paper, we have a similar performance considering the recall metric, reaching the best median and third quartile and losing on
2Script used to compare our results: https://github.com/hscleandro/ami-nsga2
Figure 3: Comparison of the ability of the 4 different meth-ods (our approach called AMI-NSGAII, knode, Bionet and COSINE) to identify activated modules on a single simulated network. Across 50 trials, our approach identified a greater proportion of the true hit nodes when they were distributed across 3 clusters of 10 size each one. The simulation model used in this analyse is the same one used by [36].
the minimum limit and the first quartile. Both approaches had a maximum limit close to 0.9.
5
APPLICATION ON BIOLOGICAL DATA
5.1
Gene expression data
We downloaded from Gene Expression Omnibus (GEO) [2] a dataset relative to a study conducted in 2010 by Roessler et al. [37]. This study aimed to identify the genes that are the most correlated with the survival of patients afflicted with Hepatocellular carcinoma (HCC). HCC is the most frequent malignant tumor in the liver and the third leading cause of cancer-related deaths worldwide. In this study (GSE14520), gene expression profiling of 22 tumor sam-ples and paired non-tumor tissues was carried out on Affymetrix GeneChip HG-U133A 2.0 arrays.
The values of log-transformed fold-change and p-values were performed from the comparison between pairs of normal versus diseased tissue using the limma R package [35], and each gene was mapped to its respective HGNC symbol [44].
CSBio 2019, December 4–7, 2019, Nice, France Leandro Correa, Denis Pallez, Laurent Tichit, Olivier Soriani, and Claude Pasquier
5.2
PPI network construction
To build our PPI interaction network we used the STRING database [43] (V10.5). Protein identifiers were also mapped to their HGNC identifiers using the biomaRt R package [15]. In order to deal with the presence of false positive protein-protein interactions [27], we used only interactions with a combined score greater than 700 (as in [29]) and with a coexpression score different from 0. After filtering the genes with "high confidence" score, we used the Breadth-First Search algorithm to extract the largest connected component of the network, resulting in a total of 5980 genes and 86338 connections. The node-weight of each gene was initialized to 0 and then set to its respective normalized value obtained from the gene expression data.
5.3
Discussion of the results
Figure 4: Venn diagram illustrating the overlapping and the content of the five identified modules.
In contrast to artificial datasets where the aim was to identify three active modules and for which the solutions on the Pareto front could correspond to different modules, here, we obtain 5 highly overlapping modules (fig. 4). The union of the modules represents a 2-connected subraph (Figure 5). All the genes belonging to the identified modules are down-regulated in HCC tumor samples.
Enrichment analysis performed with Gene Set Enrichment Anal-ysis method (GSEA) [39] on the 23 genes composing the module highlights numerous annotations, associated with very low (i.e. sig-nificant) false discovery rate (FDR), related to the metabolic process. And it is well known that alterations in cellular metabolism are hall-marks of cancer, and in particular alterations in lipid metabolism [6].
Gene Ontology (GO) annotations like "fatty acid metabolic pro-cess" (FDR=1.85 × 10⁻¹⁵), "lipid metabolic process" (FDR=5.02 ×
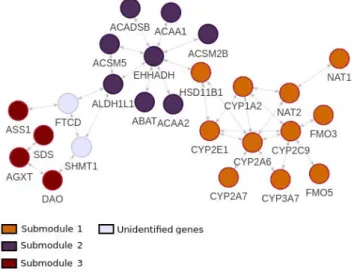
Figure 5: The identified active module from Hepatocellular carcinoma sample. The subnetwork contains 23 genes and 32 connections. We highlight 3 submodules from the func-tional analysis of genes.
10−11), "cellular lipid metabolic process" (FDR=1.16 × 10⁻¹⁰) or KEGG pathways like "fatty acid metabolism" (FDR=1.64 × 10⁻⁶) are predominant in the module. Among the genes involved in metab-olism, those belonging to Cytochrome p450 oxidoreductase fam-ily are particularly prevalent in the liver because they encode a metabolic enzyme which function to metabolize potentially toxic compounds, including drugs. The implication of Cytochrome p450 in human liver cancer has been known since the early 1990s [17]. In the identified active module, 6 genes (CYP1A2, CYP2A6, CYP2A7, CYP2C9, CYP2E1 and CYP3A7) belong to Cytochrome p450 family. In addition, two genes (FMO3 and FMO5) belong, with CYP* to the "Drug metabolism - cytochrome P450" KEGG pathway. These genes are all located in a dense interconnected part of the identified active module that we call submodule 1 (Figure 5). submodule 1 contains genes over-represented in liver cancer modules 23 and 135 identified by Segal et al. [38] with FDR of 8.08 × 10⁻⁹ and 1.26 × 10⁻⁸respectively. Another distinct submodule (submodule 2), that we can distinguish at the center of Figure 5 contains genes over-represented in liver cancer modules 184 and 221 [38] with both a FDR of 2.64 × 10⁻⁸. The third set of genes that we distinguish on Figure 5 (submodule 3) is a set of 4 genes (DAO, AGXT, SDS and ASS1) that are disconnected to the main network. These genes are over-represented in liver cancer modules 235 [38] and HCC subclass S3 identified by Hoshida et al. [21] with FDR of 5.36 × 10⁻⁵ and 4.96 × 10⁻⁶respectively.
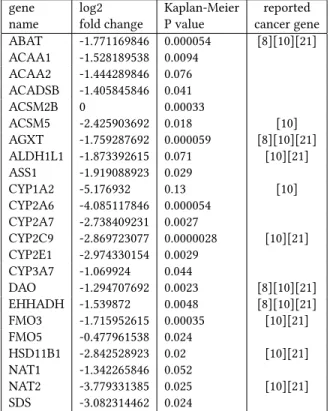
Table 1 lists the genes in the identified module along with their log2 fold change and the Log-rank P value for Kaplan-Meier plot indicating the correlation beetween their expression level and pa-tient survival. Log-rank P values were calculated with the Human Protein Atlas web site3. We can observe that the vast majority of the genes in the table are correlated with patient survival with a P value lower than 0.05, which is significant. Another fact that has
gene log2 Kaplan-Meier reported name fold change P value cancer gene ABAT -1.771169846 0.000054 [8][10][21] ACAA1 -1.528189538 0.0094 ACAA2 -1.444289846 0.076 ACADSB -1.405845846 0.041 ACSM2B 0 0.00033 ACSM5 -2.425903692 0.018 [10] AGXT -1.759287692 0.000059 [8][10][21] ALDH1L1 -1.873392615 0.071 [10][21] ASS1 -1.919088923 0.029 CYP1A2 -5.176932 0.13 [10] CYP2A6 -4.085117846 0.000054 CYP2A7 -2.738409231 0.0027 CYP2C9 -2.869723077 0.0000028 [10][21] CYP2E1 -2.974330154 0.0029 CYP3A7 -1.069924 0.044 DAO -1.294707692 0.0023 [8][10][21] EHHADH -1.539872 0.0048 [8][10][21] FMO3 -1.715952615 0.00035 [10][21] FMO5 -0.477961538 0.024 HSD11B1 -2.842528923 0.02 [10][21] NAT1 -1.342265846 0.052 NAT2 -3.779331385 0.025 [10][21] SDS -3.082314462 0.024
Table 1: List of the genes belonging to the active module with their associated log2 fold change, Kaplan Meyer Survival analysis (P value) and their belonging to published gene lists. [8] identifies the six hub genes identified by Chen et al. that are associated with metastasis risk and prognosis in HCC. [10] refers to under-expressed in the proliferation class in HCC identified by Chiang et al. [21] identifies genes in the HCC subclass S3 of Hoshida et al.
.
to be highlighted is that our method allows to identify genes of interest that have no chance of being detected using only differen-tial expression. This is the case, for example of FMO5 with a log2 fold change of only -0.47 or ACSM2B whose expression was not measured. However, ACSM2B is associated with a Kaplan-Meier P value of 0.00033 and, at this time, little is known about ACSM2B gene. Boomgaarden et al. [7] reported that ACSM2B encodes for enzymes catalyzing the activation of medium-chain length fatty acids. They shown that ACSM2B is the predominant transcript in human liver, and that its genetic variations could play an important role in disease susceptibility. There is no other evidence that there is a link between this gene and HCC but the few facts stated above make it a potential candidate to play a role in liver disease.
Overall, the low activity of the identified module seems to be characteristic of HCC development. In an article published in 2017, Chen et al. identified six hub genes associated with metastasis risk and prognosis in hepatocellular carcinoma [8]. The six genes in question are ABAT, AGXT, ALDH6A1, CYP4A11, DAO and EHHADH. Of these six genes, four are part of the module identified by our method.
6
CONCLUSION
In this article, we have proposed a new method, AMI-NSGAII, to identify important subgraphs in weighted-nodes graphs. This study addresses a biological need to identify one or more sets of genes interacting together that may be related to a given phenotype. In the context of biological applications, the weighted-nodes graphs are constructed by enriching genes in a protein-protein interaction network with weights representing their activity. Our approach of active module identification relies on a population-based meta-heuristic that differs from existing methods in three important points: i) the use of a relaxed notion of connectedness that we calld-connectedness, ii) the use of a new crossover operator that combinesd-connected sub-graphs according to the d value, iii) the consideration, when evaluating potential solutions, of the weight of the nodes but also of the essentiality of the nodes measured by taking into account the influence on their neighbors.
We have shown that our method gave excellent result on a simu-lation experiment used in other studies. We have additionally used our method to process a real dataset consisting of gene expres-sion profiling of Hepatocellular carcinoma tumor samples versus non-tumor tissues. We have shown that AMI-NSGAII was able to identify sub-networks of genes that are biologically meaningful and consistent with the findings of previous studies. By analyzing the results obtained by our method, we highlighted ACSM2B as a gene that has the potential to play a role in liver disease.
As we manage to optimize two objectives independently (with-out using a weighted sum between objectives), we obtain a set of good solutions positioned on a Pareto front. Depending on the data processed, and also on the number of modules to be discovered, the Pareto front may contain sets of genes that can be combined or, conversely, entirely independent subgraphs. Future work will be to standardize the post-processing of results in order to be agnostic about the number of active modules on the network.
REFERENCES
[1] Albert-László Barabási and Réka Albert. 1999. Emergence of scaling in random networks. science 286, 5439 (1999), 509–512.
[2] Tanya Barrett, Tugba O Suzek, Dennis B Troup, Stephen E Wilhite, Wing-Chi Ngau, Pierre Ledoux, Dmitry Rudnev, Alex E Lash, Wataru Fujibuchi, and Ron Edgar. 2005. NCBI GEO: mining millions of expression profiles-database and tools. Nucleic acids research 33, suppl_1 (2005), D562–D566.
[3] István Bartha, Julia di Iulio, J Craig Venter, and Amalio Telenti. 2018. Human gene essentiality. Nature Reviews Genetics 19, 1 (2018), 51.
[4] Omer Basha, Shoval Tirman, Amir Eluk, and Esti Yeger-Lotem. 2013. Respon-seNet2.0: Revealing signaling and regulatory pathways connecting your proteins and genes–now with human data. Nucleic acids research 41, Web Server issue (2013), 198–203.
[5] Daniela Beisser, Gunnar W. Klau, Thomas Dandekar, Tobias Müller, and Marcus T. Dittrich. 2010. BioNet: An R-Package for the functional analysis of biological networks. Bioinformatics 26, 8 (2010), 1129–1130.
[6] Nikolaus Berndt, Johannes Eckstein, Niklas Heucke, Robert Gajowski, Martin Stockmann, David Meierhofer, and Hermann-Georg Holzhütter. 2019. Character-ization of Lipid and Lipid Droplet Metabolism in Human HCC. Cells 8, 5 (2019), 512.
[7] Inka Boomgaarden, Christina Vock, Maja Klapper, and Frank Döring. 2009. Com-parative analyses of disease risk genes belonging to the acyl-CoA synthetase medium-chain (ACSM) family in human liver and cell lines. Biochemical genetics 47, 9-10 (2009), 739–748.
[8] Pengfei Chen, Fan Wang, Juerong Feng, Rui Zhou, Ying Chang, Jing Liu, and Qiu Zhao. 2017. Co-expression network analysis identified six hub genes in associa-tion with metastasis risk and prognosis in hepatocellular carcinoma. Oncotarget 8, 30 (2017), 48948.
[9] Weiqi Chen, Jing Liu, and Shan He. 2017. Prior knowledge guided active modules identification: An integrated multi-objective approach. BMC Systems Biology 11,
CSBio 2019, December 4–7, 2019, Nice, France Leandro Correa, Denis Pallez, Laurent Tichit, Olivier Soriani, and Claude Pasquier
Suppl 2 (2017), 1–12.
[10] Derek Y Chiang, Augusto Villanueva, Yujin Hoshida, Judit Peix, Philippa Newell, Beatriz Minguez, Amanda C LeBlanc, Diana J Donovan, Swan N Thung, Manel Sole, et al. 2008. Focal gains of VEGFA and molecular classification of hepatocel-lular carcinoma. Cancer research 68, 16 (2008), 6779–6788.
[11] Alex J Cornish and Florian Markowetz. 2014. SANTA: quantifying the functional content of molecular networks. PLoS computational biology 10, 9 (2014), e1003808. [12] Kenneth A. De Jong and William M. Spears. 1992. A formal analysis of the role of multi-point crossover in genetic algorithms. Annals of Mathematics and Artificial Intelligence 5, 1 (01 Mar 1992), 1–26.
[13] Kalyanmoy Deb, Amrit Pratap, Sameer Agarwal, and TAMT Meyarivan. 2002. A fast and elitist multiobjective genetic algorithm: NSGA-II. IEEE transactions on evolutionary computation 6, 2 (2002), 182–197.
[14] Marcus T. Dittrich, Gunnar W. Klau, Andreas Rosenwald, Thomas Dandekar, and Tobias Müller. 2008. Identifying functional modules in protein-protein interaction networks: An integrated exact approach. Bioinformatics 24, 13 (2008), 223–231. [15] Hajk-Georg Drost and Jerzy Paszkowski. 2017. Biomartr: genomic data retrieval
with R. Bioinformatics 33, 8 (2017), 1216–1217.
[16] Zhide Fang, Jeffrey Martin, and Zhong Wang. 2012. Statistical methods for identifying differentially expressed genes in RNA-Seq experiments. Cell and Bioscience 2, 1 (2012), 1.
[17] Lesley M Forrester, Gordon E Neal, David J Judah, Michael J Glancey, and C Roland Wolf. 1990. Evidence for involvement of multiple forms of cytochrome P-450 in aflatoxin B1 metabolism in human liver. Proceedings of the National Academy of Sciences 87, 21 (1990), 8306–8310.
[18] Susan Dina Ghiassian, Jörg Menche, and Albert László Barabási. 2015. A DIseAse MOdule Detection (DIAMOnD) Algorithm Derived from a Systematic Analysis of Connectivity Patterns of Disease Proteins in the Human Interactome. PLoS Computational Biology 11, 4 (2015), 1–21.
[19] Enrico Glaab, Anaïs Baudot, Natalio Krasnogor, Reinhard Schneider, and Al-fonso Valencia. 2012. EnrichNet: Network-based gene set enrichment analysis. Bioinformatics 28, 18 (2012), 451–457.
[20] Hao He, Dongdong Lin, Jigang Zhang, Yu-ping Wang, and Hong-wen Deng. 2017. Comparison of statistical methods for subnetwork detection in the integration of gene expression and protein interaction network. BMC Bioinformatics 18, 1 (2017), 149.
[21] Yujin Hoshida, Sebastian MB Nijman, Masahiro Kobayashi, Jennifer A Chan, Jean-Philippe Brunet, Derek Y Chiang, Augusto Villanueva, Philippa Newell, Kenji Ikeda, Masaji Hashimoto, et al. 2009. Integrative transcriptome analysis reveals common molecular subclasses of human hepatocellular carcinoma. Cancer research 69, 18 (2009), 7385–7392.
[22] Trey Ideker, Owen Ozier, Benno Schwikowski, and Andrew F Siegel. 2002. Dis-covering regulatory and signalling circuits in molecular interaction networks. Bioinformatics 18, suppl_1 (2002), S233–S240.
[23] Peng Jiang, Hongfang Wang, Wei Li, Chongzhi Zang, Bo Li, Yinling J Wong, Cliff Meyer, Jun S Liu, Jon C Aster, and X Shirley Liu. 2015. Network analysis of gene essentiality in functional genomics experiments. Genome biology 16, 1 (2015), 239.
[24] Dong Li, Zhisong Pan, Guyu Hu, Zexuan Zhu, and Shan He. 2017. Active module identification in intracellular networks using a memetic algorithm with a new binary decoding scheme. BMC genomics 18, 2 (2017), 209.
[25] Yan Lu, Peng-Yuan Liu, Peng Xiao, and Hong-Wen Deng. 2005. Hotelling’s T 2 multivariate profiling for detecting differential expression in microarrays. Bioinformatics 21, 14 (2005), 3105–3113.
[26] Haisu Ma, Eric E Schadt, Lee M Kaplan, and Hongyu Zhao. 2011. COSINE: COndition-SpecIfic sub-NEtwork identification using a global optimization method. Bioinformatics 27, 9 (2011), 1290–1298.
[27] Mahmoud A. Mahdavi and Yen-Han Lin. 2007. False positive reduction in protein-protein interaction predictions using gene ontology annotations. BMC bioinfor-matics 8 (23 Jul 2007), 262–262. 1471-2105-8-262[PII].
[28] Christopher A. Miller, Stephen H. Settle, Erik P. Sulman, Kenneth D. Aldape, and Aleksandar Milosavljevic. 2011. Discovering functional modules by identifying recurrent and mutually exclusive mutational patterns in tumors. BMC Medical Genomics 4, 1 (dec 2011), 34.
[29] Ettore Mosca and Luciano Milanesi. 2013. Network-based analysis of omics with multi-objective optimization. Molecular BioSystems 9, 12 (2013), 2971–2980. [30] Hung Nguyen, Sangam Shrestha, Duc Tran, Adib Shafi, Sorin Draghici, and
Tin Nguyen. 2019. A Comprehensive Survey of Tools and Software for Active Subnetwork Identification. Frontiers in Genetics 10 (2019), 155.
[31] Iryna Nikolayeva, Oriol Guitart Pla, and Benno Schwikowski. 2018. Network module identification - A widespread theoretical bias and best practices. Methods 132 (2018), 19–25.
[32] Deanna Petrochilos, Ali Shojaie, John Gennari, and Neil Abernethy. 2013. Using random walks to identify cancer-associated modules in expression data. BioData Mining 6, 1 (dec 2013), 17.
[33] Franck Rapaport, Andrei Zinovyev, Marie Dutreix, Emmanuel Barillot, and Jean Philippe Vert. 2007. Classification of microarray data using gene networks. BMC Bioinformatics 8 (2007), 1–15.
[34] Matthew A. Reyna, Mark D M Leiserson, and Benjamin J. Raphael. 2018. Hierar-chical HotNet: identifying hierarchies of altered subnetworks. Bioinformatics 34, 17 (sep 2018), i972–i980.
[35] Matthew E. Ritchie, Belinda Phipson, Di Wu, Yifang Hu, Charity W. Law, Wei Shi, and Gordon K. Smyth. 2015. limma powers differential expression analyses for RNA-sequencing and microarray studies. Nucleic Acids Research 43, 7 (01 2015), e47–e47.
[36] Sean Robinson, Jaakko Nevalainen, Guillaume Pinna, Anna Campalans, J. Pablo Radicella, and Laurent Guyon. 2017. Incorporating interaction networks into the determination of functionally related hit genes in genomic experiments with Markov random fields. Bioinformatics (Oxford, England) 33, 14 (jul 2017), i170–i179.
[37] Stephanie Roessler, Hu-Liang Jia, Anuradha Budhu, Marshonna Forgues, Qing-Hai Ye, Ju-Seog Lee, Snorri S Thorgeirsson, Zhongtang Sun, Zhao-You Tang, Lun-Xiu Qin, et al. 2010. A unique metastasis gene signature enables prediction of tumor relapse in early-stage hepatocellular carcinoma patients. Cancer research 70, 24 (2010), 10202–10212.
[38] Eran Segal, Nir Friedman, Daphne Koller, and Aviv Regev. 2004. A module map showing conditional activity of expression modules in cancer. Nature genetics 36, 10 (2004), 1090.
[39] Aravind Subramanian, Pablo Tamayo, Vamsi K Mootha, Sayan Mukherjee, Ben-jamin L Ebert, Michael A Gillette, Amanda Paulovich, Scott L Pomeroy, Todd R Golub, Eric S Lander, et al. 2005. Gene set enrichment analysis: a knowledge-based approach for interpreting genome-wide expression profiles. Proceedings of the National Academy of Sciences 102, 43 (2005), 15545–15550.
[40] A. Tanay, R. Sharan, M. Kupiec, and R. Shamir. 2004. Revealing modularity and organization in the yeast molecular network by integrated analysis of highly heterogeneous genomewide data. Proceedings of the National Academy of Sciences 101, 9 (2004), 2981–2986.
[41] Nurcan Tuncbag, Sara J C Gosline, Amanda Kedaigle, Anthony R Soltis, Anthony Gitter, and Ernest Fraenkel. 2016. Network-Based Interpretation of Diverse High-Throughput Datasets through the Omics Integrator Software Package. PLoS computational biology 12, 4 (apr 2016), e1004879.
[42] Jean Philippe Vert and Minoru Kanehisa. 2003. Extracting active pathways from gene expression data. Bioinformatics 19, suppl_2 (2003), ii238–ii244. [43] Christian Von Mering, Lars J Jensen, Berend Snel, Sean D Hooper, Markus
Krupp, Mathilde Foglierini, Nelly Jouffre, Martijn A Huynen, and Peer Bork. 2005. STRING: known and predicted protein–protein associations, integrated and transferred across organisms. Nucleic acids research 33, suppl_1 (2005), D433–D437.
[44] Bethan Yates, Bryony Braschi, Kristian A. Gray, Ruth L. Seal, Susan Tweedie, and Elspeth A. Bruford. 2016. Genenames.org: the HGNC and VGNC resources in 2017. Nucleic Acids Research 45, D1 (10 2016), D619–D625.