HAL Id: insu-01562007
https://hal-insu.archives-ouvertes.fr/insu-01562007
Submitted on 17 Jul 2017HAL is a multi-disciplinary open access archive for the deposit and dissemination of sci-entific research documents, whether they are pub-lished or not. The documents may come from teaching and research institutions in France or abroad, or from public or private research centers.
L’archive ouverte pluridisciplinaire HAL, est destinée au dépôt et à la diffusion de documents scientifiques de niveau recherche, publiés ou non, émanant des établissements d’enseignement et de recherche français ou étrangers, des laboratoires publics ou privés.
Raman lidars for a better understanding of pollution in
the Arctic System (PARCS)
Patrick Chazette, Jean-Christophe Raut, Julien Totems, Xiaoxia Shang,
Christophe Caudoux, Julien Delanoë, Kathy S. Law
To cite this version:
Patrick Chazette, Jean-Christophe Raut, Julien Totems, Xiaoxia Shang, Christophe Caudoux, et al.. Raman lidars for a better understanding of pollution in the Arctic System (PARCS). EPJ Web of Conferences, EDP Sciences, 2018, (The 28th International Laser Radar Conference (ILRC 28), Bucharest 2017), 176, art. 04005 (4 p.). �10.1051/epjconf/201817604005�. �insu-01562007�
R
AMAN LIDARS FOR A BETTER UNDERSTANDING OF POLLUTION IN THEA
RCTICS
YSTEM(PARCS)
Chazette Patrick1*, Raut Jean-Christophe2, Totems Julien1, Shang Xiaoxia1,2, Caudoux
Christophe2, Delanoë Julien2, and Law Kathy2
1IPSL/LSCE, CEA-CNRS-UVSQ, Gif sur Yvette, France, *Patrick.chazette@lsce.ipsl.fr 2 LATMOS/IPSL, UPMC Univ. Paris 06 Sorbonne Universités, UVSQ, CNRS, Paris
ABSTRACT
The development of oil and gas drilling and the opening of new shipping routes, in the Barents and Norway seas, poses new challenges for the Arctic environment due to the impact of air pollution emissions on climate and air quality. To improve our knowledge of the interactions between aerosols, water vapor and cloud cover, within the French PARCS (Pollution in the A R C t i c S y s t e m ) p r o j e c t , R a m a n l i d a r observations were performed from the ground and from an ultra-light aircraft near the North Cape in northern Norway, and coupled with measurements from a 95 GHz ground-based Doppler radar.
1 INTRODUCTION
The French Arctic initiative project Pollution in the ARCtic System (PARCS), aims to improve our knowledge about the impact of local pollution on the Arctic system, including cloud formation, and builds on past efforts that began in the 1980s [1]. The Laboratory of Climate and Environmental Sciences (LSCE) and the Laboratoire de l’Atmosphèere, Milieux et Observations Spatiales (LATMOS) therefore set up an innovative field campaign within the Arctic circle. The experiment took place in May 2016 in the region of Hammerfest (70°39′45″N 23°41′00″E, Norway), 90 km southwest of the North Cape. It is based on the coupling between Raman lidar observations performed from both the ground and an ultralight aircraft (ULA) [2][3]. These observations make it possible to quantify aerosols, water vapor and to identify cloud types via a 95 GHz mini-radar (BASTA) / lidar synergy [4].
The main scientific objectives are to i) sample the aerosol pollution along the coast of northern Norway due to shipping, oil and gas extraction activities, ii) quantify the atmospheric pollution due to local flaring activities and industries, and iii) study the interactions between aerosols and water vapor, cloud liquid droplets, cloud ice crystals.
2 FIELD EXPERIMENT
3 Ground-based measurements
The Mobile Atmospheric Station (MAS) was located close to the Hammerfest airport (Figure 1). It was equipped with the 354.7-nm water vapor Raman lidar (WALI) and the 95-GHz mini-BASTA radar [3][4][5]. These instruments carried out continuous measurements between 13 and 26 May 2016 with a final vertical resolution of 15 (1’ integration) and 12.5/25/100 m (3” integration) for the lidar and the radar, respectively.
Figure 1. MAS located near Hammerfest airport, equipped with Raman lidar and 95 GHz radar.
The lidar is designed to fulfill eye-safety standards (EN 60825-1). Its emitter is a pulsed Nd:YAG laser (QUANTELTM Q-Smart). The
acquisition system is a PXI (PCI eXtensions for Instrumentation, by National InstrumentsTM)
technology with four 12-bit digitizers at 200 MS/ s. The wide field-of-view (FOV) ~2.3 mrad allows a full-overlap of the transmission and reception paths beyond ~ 200 m. The acquisition was performed by averaging 1000 laser shots leading to a temporal sampling close to 1 minute. Its pulse energy is ~120 mJ in the UV and the pulse repetition frequency is 20 Hz. The receiver is composed of 3 distinct detection modules using small collector telescopes of 15 cm in diameter. The total number of detection channels is four: the elastic co-polarized and cross polarized channels (with respect to the polarized laser emission), the
Raman nitrogen (N2-channel, ~386.6 nm) and
water vapor (H2O channel, ~407.5 nm) channels.
4 Airborne measurements
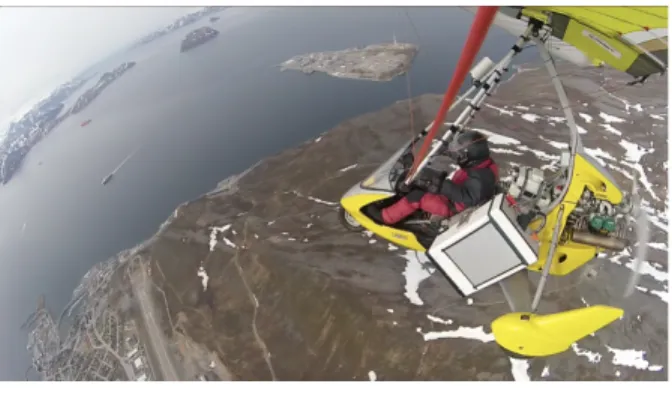
A Tanarg 912 XS ULA, built by the Air Création Company, with a maximum total payload of approximately 250 kg including the pilot, was used for airborne measurements. Flight duration was 1-2 hours, depending on flight conditions, with a cruise speed around 85-90 km h-1. The
355-nm eye-safe lidar for automatic atmospheric surveys using Raman scattering (LAASURS) was installed on-board the ULA (Figure 2). LAASURS is equipped of the same channels and acquisition system than WALI, except for water vapor. It uses a QUANTELTM Ultra flash-pumped
laser emitter (30 mJ, 20 Hz PRF). A VAISALATM
meteorological probe, type PTU300, was also embedded on the ULA. The ULA location is provided by a Global Positioning System (GPS) and an Attitude and Heading Reference System (AHRS), which are part of the MTi-G system.
Figure 2. N2-Raman lidar embedded on ULA.
5 ATMOSPHERIC TARGETS
6 Aerosols
The measurement of aerosol optical properties in the atmospheric column is very sensitive in the Arctic region since the aerosol concentrations can be very low at this time of year. AERONET measurements give an aerosol optical thickness (AOT) generally lower than 0.1 at 355 nm. These values are confirmed during the campaign where the ground-based lidar (GBL)-derived AOTs remained between 0.05 and 0.13.
We carried out 14 ULA flights in cloudy and windy conditions with a lidar that operated at a temperature down to -17 °C. A flight example is shown in Figure 3. The data are retrieved in synergy with the GBL. Higher aerosol extinction
coefficients (AEC) are observed in the northeastern part of the flight. They are probably due to marine sea-salt. During the experiment, aerosol plumes at high altitudes were detected by the GBL, such as the one located at about 7 km above the mean sea level (amsl) in Figure 4. It is highlighted by the aerosol volume depolarization ratio (VDR) and apparent backscatter coefficient (ABCapp). Its origin remains to be identified more
precisely, but it could be a contribution from the major forest fires occurring in Canada during this period.
Figure 3. AEC retrieved from the flight around Hammerfest on 16th May 2016.
7 Water vapor
Similarly, measuring the water vapor mixing ratio (WVMR) with high relative accuracy is challenging using a Raman lidar, because the air masses are significantly drier and there is always sunlight during summer north of the Arctic Circle. The calibration of the lidar was performed using several vertical ULA flights above the GBL location. The relative standard deviation on the WVMR is assessed to be close to 5% (resp. 25%) within the first km (resp. 3 km), for 200 m/1 h integration (perpetual daytime). A comparison between WALI- and the meteorological probe-derived WVMR profiles is given in Figure 5. Figure 4 also shows the temporal evolution of the WVMR, highlighting a strong variation along time and altitude. Generally, the altitude range of the GBL is limited by the presence of clouds often present during the field-campaign.
Figure 4. Temporal evolutions, between 13th and 16th May 2016 of the lidar-derived ABCapp, VDR and
WVMR (top, middle and bottom panels, respectively).
Figure 5. WVMR vertical profiles derived from WALI and the VAISALA™ probe on 5th May 2016. The red
dotted line and the horizontal bars delimit the standard deviation on the meteorological probe and the lidar
measurements, respectively.
8 Clouds
Simultaneous measurements between WALI and the BASTA mini-radar allow identification of the cloud phase and melting layer (ML) where ice crystals are melting leading to liquid precipitation. The detection of the ML by the lidar/radar synergy has already been described and validated [6]. The lidar/radar synergy is also ideal for characterizing cloud microphysic due their respective sensitivities. Indeed, lidar and radar measurements are roughly proportional to the second and sixth moments of the particle size distribution, respectively [4].
Figure 6. Temporal evolutions on 24th May 2016 of the
lidar-derived ABCapp (top panel), radar reflectivity in
dBZ (middle panel), and Doppler radar-derived vertical drop speed (bottom panel).
Figure 6 shows a very rainy situation where the ground temperature was about 6-7 °C. On the upper panel, the temporal evolution of the vertical profile of the ABCapp is shown. A zone with less
scattering is observed close to 1 km amsl (lidar dark band), which corresponds to the ML. The ML is also well identified on radar reflectivity (radar bright band), expressed in terms of dBZ (middle panel), as well as on radar-derived vertical drop speed (bottom panel).
Raindrops are more efficient scatterers on radar signal due to the lower frequency compared to the lidar, and we note significantly higher drop velocities than those of icy crystal particles present in the cloud with a sharp conversion from ice to rain drop at the ML. They have similar signatures on lidar measurements, which are also more sensitive to multiple scattering. The raindrops are less concentrated than liquid cloud drops and therefore allow the signal to penetrate further. Cloud phase detection is one of the
advantages of the radar-lidar synergy. For instance, at 18:14 and 1.4 km, the lidar detects a strong return while the radar does not show any modification in its measurements. The very small liquid drops are too small to be identified by the radar (using only reflectivity and Doppler velocity). Such a layer is assumed to be a supercooled layer embedded in the ice layer. The comparison of the upper and middle panels enables us to classify the water and frozen clouds. The radar reflectivity is indeed much lower in the presence of a cloud water droplets, whereas the lidar signature remains of the same intensity. At the end of the period (after 1900 local time), a precipitating water cloud is observed around 1 km amsl in Figure 6.
9 CONCLUSIONS
During PARCS field-campaign, we collected an original dataset of remote sensing measurements in the Arctic region. Aerosols, water vapor and clouds were simultaneously sampled in the atmospheric column using ground-based and airborne lidars, coupled with a ground-based 95 GHz radar for clouds identification and microphysics. The ML was unmistakably identified by both ground-based lidar and radar. It is a key parameter to constrain and validate the cloud microphysics simulated in mesoscale models.
An important further step will be to simulate cloud cover using the Weather Research and Forecasting (WRF) model and to validate s i m u l a t i o n s u s i n g t h e f i e l d - c a m p a i g n observations. The water vapor content is also an important element that must be validated in the model because of its influence on cloud formation. These measurements will lead to improvements in our understanding about Arctic clouds and their potential interactions with aerosols.
ACKNOWLEDGEMENTS
This work was supported by the French Institut National de l’Univers (INSU) of the Centre National de la Recherche Scientifique (CNRS) via the French Arctic initiative. The French space agency (CNES) and the Commissariat à l'Energie Atomique et aux énergies alternatives (CEA) are acknowledged for their supports. We also acknowledge valuable help from Tatsuo Onishi
(LATMOS/IPSL) in providing tracer forecasts during the experiment. We thank Yoann Chazette, Nathalie Toussaint and Sébastien Blanchon for their help during the field experiment. The ULA flights were performed by Franck Toussaint. The Avinor crew of Hammerfest Airport, represented by Hans-Petter Nergård, and the Air Creation company are acknowledged for their hospitality. References
[1] Barrie, L. a., 1986: Arctic air pollution: An overview of current knowledge. Atmos. E n v i r o n . 2 0 , 6 4 3 – 6 6 3 . d o i : 10.1016/0004-6981(86)90180-0
[2] Chazette, P., 2016: Exceptional aerosol pollution plume observed using a new ULA-lidar approach, Atmos. Environ., 141, 470-480.
[3] Chazette, P., Marnas, F., Totems, J., 2014: The mobile Water vapor Aerosol Raman LIdar and its implication in the framework of the HyMeX and ChArMEx programs: application to a dust transport process, Atmos. Meas. Tech., 7, 1629– 1647.
[4] Delanoë, J., and R. J. Hogan, 2008: A variational scheme for retrieving ice cloud properties from combined radar, lidar, and infrared radiometer, J. Geophys. Res., 113, D07204, doi:10.1029/2007JD009000
[5] Delanoë J., A. Protat, J.-P. Vinson, W. Brett, C. Caudoux, F. Bertrand, J. Parent du Chatelet, R. Hallali, L. Barthes, M. Haeffelin, and J.-C. Dupont, 2016: BASTA: A 95-GHz FMCW Doppler Radar for Cloud and Fog Studies. J. Atmos. Oceanic Technol. 33, 1023–1038, doi: 10.1175/JTECH-D-15-0104.1.
[6] Sassen, K., Campbell, J.R., Zhu, J., Kollias, P., Shupe, M., Williams, C., 2005: Lidar and T r i p l e - Wa v e l e n g t h D o p p l e r R a d a r Measurements of the Melting Layer: A Revised Model for Dark- and Brightband Phenomena, J. Appl. Meteorol., 44, 301–312. doi:10.1175/ JAM-2197.1