HAL Id: hal-01366350
https://hal.archives-ouvertes.fr/hal-01366350
Submitted on 14 Sep 2016
HAL is a multi-disciplinary open access
archive for the deposit and dissemination of
sci-entific research documents, whether they are
pub-lished or not. The documents may come from
teaching and research institutions in France or
abroad, or from public or private research centers.
L’archive ouverte pluridisciplinaire HAL, est
destinée au dépôt et à la diffusion de documents
scientifiques de niveau recherche, publiés ou non,
émanant des établissements d’enseignement et de
recherche français ou étrangers, des laboratoires
publics ou privés.
Semantics of Higraphs for Process Modeling and
Analysis
Elena Kushnareva, Irina Rychkova, Bénédicte Le Grand
To cite this version:
Elena Kushnareva, Irina Rychkova, Bénédicte Le Grand. Semantics of Higraphs for Process Modeling
and Analysis. AdaptiveCM 2016 – 5th International Workshop on Adaptive Case Management and
other non-workflow approaches to BPM, Sept. 2016, Vienna, Austria. , Sep 2016, Vienna, Austria.
�hal-01366350�
Semantics of Higraphs for Process Modeling and
Analysis
Elena Kushnareva
Centre de Recherche en Informatique, University Paris 1 Panth´eon-Sorbonne, 90, rue Tolbiac, 75013, Paris, France [email protected]
Irina Rychkova
Centre de Recherche en Informatique, University Paris 1 Panth´eon-Sorbonne, 90, rue Tolbiac, 75013, Paris, France
B´en´edicte Le Grand
Centre de Recherche en Informatique, University Paris 1 Panth´eon-Sorbonne, 90, rue Tolbiac, 75013, Paris, France
Abstract—Knowledge and experience of a case manager re-mains a key success factor for Case Management Processes (CMPs). When a number of influential parameters is high, a number of possible scenarios grows significantly. Automated guidance in scenario evaluation and activity planning would be of a great help. In our previous work, we defined the statecharts semantics for visualisation and simulation of CMP scenarios. In this work, we formalise the state-oriented models with higraphs: higraphs provide mathematical foundation for statecharts and eventually enable a wide panoply of algorithms for process analysis and optimisation. We show how a statecharts diagram can be transformed into higraph and analysed at run-time with graph algorithms. In particular, we take an example of the Shortest Path algorithm and show how this algorithm can be used in order to guide the case manager suggesting her the best process scenario. Compared to BPM approaches, a state-oriented process scenario does not specify concrete activities but only the objectives and constraints to be met. Thus, our approach does not prescribe but describe an activity to be executed next. The manager can define an activity that fit the description ”on the fly”, based on her experience and intuition.
I. INTRODUCTION
Case management process (CMP) [1] can be characterized by the following: it is driven by emergent knowledge about the case subject or the environment; largely based on human expertise; highly unpredictable; difficult to replicate; hard to analyze and improve as no HOWTOs available. CMPs have multiple applications: crisis situations handling, patient care, insurance application, computer games development, etc.
The features of a case management support system often include case artifact organizer/repository, task scheduler, re-port generator, document sharing, business calculator based on business rules, etc. Definition, assessment of alternative scenarios and decision-making remains a responsibility of a human expert - a case manager.
When a scenario is not prescribed for a given situation or when the prescribed one cannot be implemented for one reason or another, the case manager has to (i) identify relevant parameters that can affect the scenario (e.g., events, resources, lessons learned from the previous situations, guidelines, man-uals etc.); (ii) assess the situation based on the observed parameters, evaluate/compare scenarios; (iii) make a decision about the course of action.
When a number of influential parameters is high, a number and complexity of possible scenarios grows exponentially. The
capacity to process the received information and to compare multiple scenarios can be extended by using the IS supporting systems (e.g., data analytics). Whereas the capacity to identify the relevant parameters and to make a decision (i) and (iii) relies strongly on the experience of a person. Automated assistance in scenario evaluation and activity planning (ii) can be provided by an IS.
Information systems for business process management (BPM) are widely developed today. These systems mainly exploit an activity-centric paradigm, where a process is de-scribed as a flow of activities. Process flexibility is one of the preoccupations for a modern BPM system: existing solutions support coordination between human actors and adaptation of a scenario at run-time. For example, ordering of activities (scheduling / skipping / repeating) can be configured at run-time. An activity can be also parametrized so that a particular variant can be selected at run-time based on the situation. To ensure this flexibility, various mechanisms are proposed, including ad-hoc subprocesses defined in BPMN 2.0 [2] or process variability and variation points [3].
However, the main challenge of an activity-centric paradigm is that all the process variants (variation points and activities that follow) have to be defined in advance (at design time). For CMP, it is not always the case: not only a case manager needs to decide on the order of activities to execute at run-time, she may also have to propose new activities that fit the situation and are not currently in the model. Semantics based on activities cannot specify the latter.
In our previous work [4], we discussed a state-oriented paradigm and the operational semantics of CMP based on statecharts [5][6][7][8]. A statechart diagram depicts a set of states and transitions between states that can be triggered by an event (or a combination of events). In a statechart model, a process is defined in terms of results or ”milestones” one needs to achieve (modeled as states) and conditions or events required to achieve them. Whereas the events are resulted from and conditions are met thanks to execution of activities - the latter are not a part of the model. There are several important differences with the activity-centric models:
- in a state-oriented model, transitions can happen and the goals can be achieved as a result of certain external events happening in the environment. For example, in a case of flood considered in our previous work [4], the crisis can be termi-nated once the water level subsides to normal, independently
of the activities executed by the case manager.
- state-oriented model requires the results (process goals) to be known in advance (states of the model). The activities that have to be executed in order to achieve them can be defined at run-time.
- in a state-oriented model, several paths from a current state to a target state (the goal of the process) usually exist. This would be equivalent to an activity-centric model with variation points defined after each task.
In [4][9], we demonstrated that the state-oriented approach and statecharts models can be successfully used to describe and visualise case management processes. We created a model of Flood management process in Yakindu statecharts tool [10] and illustrated how multiple scenarios can be created during the execution of this process.
In this work, we formalise the state-oriented process mod-els with higraphs [11]. A higraph is a mathematical graph extended to include notions of depth (defined hierarchy) and orthogonality (a Cartesian product or partitioning), which makes them a combination and extension of Euler graphs, hypergraphs and Euler Cirles (or Venn diagrams).
Higraphs semantics provides mathematical foundation for statecharts and eventually enables a wide panoply of (graph) algorithms for process analysis. In particular, we explore how the algorithms of path search and optimization on graphs can be used in order to support run-time decision making and adaptive scenario planning for unstructured, non-workflow processes.
Higraph semantics and statechart/higraph transformation are a central part of the research illustrated in Fig. 1: whereas the statecharts are used forvisualisation and simulation of a non-workflow process, underlying formalism of higraph allows for (run-time)process analysis and optimisation.
In this paper, we (i) report on the transformation of statecharts diagrams in higraphs, then we (ii) discuss how the graph algorithms (e.g., the shortest path) can be used in order to identify the best scenario and (iii) how the run-time analysis of higraph can help the case manager to choose/propose an activity that would lead to realisation of this scenario.
Our research paves the road to creation of an automated recommendation support for the case manager: the latter can use a state-oriented model to fix the milestones and the main goals of a process (states) and to define the conditions under which these milestones and goals can be reached (transitions). At run time, the current state of the model reflects the cur-rent situation of a process. At each curcur-rent state, the proposed algorithm can identify the next milestone that contributes best to the main process goal. It can also suggest the list of activities to execute. The case manager may choose one of the suggested activities or may define her own activity. If the selected activity fails or another external event occurs, the target milestone may not be achieved. In this case, the new alternative milestone will be defined.
The reminder of this paper is organised as follows: In Section II, we explain our motivation and introduce higraphs, statecharts and related theories. In Section III, we describe
our state-oriented approach for modeling and analysis of non-workflow processes. In particular, we discuss the importance of the formal semantics of higraphs within this approach. In Section IV, we present the transformation of statecharts to higraphs. Section V covers higraph analysis methods and automated recommendations enabled by statecharts/higraph semantics. Section VI presents our conclusions.
II. BACKGROUND
A. Motivation
Up to now, BPM approaches based on the activity-centered paradigm remain the mainstream paradigm for process-support systems design. Within this paradigm, a process is specified with an (ordered) set of activities that the system carries out during the execution. To provide better support for pro-cess flexibility, activity-oriented formalisms are extended with declarative parts such as constraints or configurable elements [12][3]. Ad-hock subprocesses in BPMN 2.0 allow for spec-ification of activities without giving a particular order of execution.
The main challenge of an activity-centric paradigm is that all the activities available for execution have to be predefined and included in a process model. But it does not always work for an unstructured process, such as CMP.
Davenport [1] defines a case management process (CMP) as a process that is not predefined or repeatable, but instead, depends on its evolving circumstances and on decisions re-garding a particular situation, i.e., a case.
As reported in [13], numerous efforts to create an efficient IS for CMP support in the industry are compromised by the attempt to deal with CMP the same way as with regular business process - i.e., representing case management by a workflow and focusing on the (predefined) sequence of tasks. Several research groups report on approaches to design and specify case management processes: in [14] and [15] an approach that combines state- and activity-oriented paradigms is presented. The case handling paradigm is presented in [16]. In [17], the authors outline the present solutions for case management. They position an intelligent assistance and guid-ance to knowledge workers as one of the main challenges: ”the next generation tools should be intelligent enough to bring the right and needed information to the knowledge worker in the right time in a proactive manner (e.g., recommend course of action, identify new relevant sources of information that may impact the decisions made in the course of a case, etc.)”.
Providing an intelligent support and guidance for scenario planning is the main purpose of our work.
In this work, we represent state-oriented models with higraphs and, in order to guide the case manager suggesting her the best process scenario, we exploit some algorithms for graph analysis.
B. Higraphs
Higraphs are a combination and extension of Euler graphs, hypergraphs and Euler/Venn diagrams. A graph in the simplest case can be defined with a set of nodes and a set of edges,
where an edge is connecting a pair of nodes (a binary relation). A hypergraph is a graph in which an edge (a hyperedge) connects not a pair, but a subset of nodes.
A higraph is a quadruple:
H = (B, , ⇡, E)
where B is a finite set of elements, called blobs, and E, the set of edges, is a binary relation on B:
E✓ B ⇥ B. The subblob function u is defined as
: B! 2B
It assigns to each blob x 2 B its set (x) of subblobs and is restricted to being cycle free.
The partitioning function ⇡ is defined as: ⇡ : B! 2B⇥B
associating with each blob x 2 B some equivalence relation ⇡(x) on the set of subblobs, (x). This is really just a rigorous way of specifying the breakup of x into its orthogonal components, which are now defined to be the equivalence classes induced by the relation ⇡(x).
An Euler/Venn diagram consists of simple closed curves drawn in a plane. The inside region of a curve depicts a set. The outside region of this curve depicts the elements that do not belong to this set respectively. Curves whose interior zones do not intersect represent disjoint sets; two curves whose interior zones intersect represent sets that have common elements and so on. Therefore, a diagram can illustrate logical relations between sets, such as being a subset of, being disjoint from, and having a nonempty intersection with.
A node of a higraph, called a ’blob’, represents a curve from Euler/Venn diagrams and allow for reasoning about its ’inside’ and ’outside’ regions using visual, topological repre-sentation. The blobs of higraphs can be connected by edges or hyperedges. Therefore, compared to regular graphs, higraphs visually distinguish between structural (set-theoretical) and other (domain-specific) relations that can be defined between the nodes: the former relations are depicted by the blobs and their topological configuration, the latter are depicted by the (hyper-)edges between blobs. Furthermore, higraphs extend the Euler/Venn diagrams with a possibility to represent a Cartesian product - another structural relation between nodes of a graph. Compared to a regular graph, higraph provides a super-polynomial saving in size of the description.
Formal syntax and semantics of higraphs defined by Harel in [11] makes accessible a wide spectrum of techniques and algorithms for qualitative, quantitative analysis as well as optimisation, validation and verification. Algorithms for analysis of higraphs are proposed in [18] (shortest path and minimum cover problems, calculating distance, Hamiltonian cycle, bipartition test). Other algorithms from graph theory can be applied to higraphs as well.
C. Statecharts
A number of applications of higraphs is discussed in [18][19]. In particular, higraphs are suitable for knowledge-representation, where both structural and domain-specific re-lations must be defined. The language of statecharts [5] is an application of higraphs for modeling behavior of complex event-driven systems. Here the Cartesian products specify the orthogonal or concurrent states of a system.
Statecharts are a higraph-based extension of standard state-transition diagrams, where the blobs represent states and arrows represent transitions.
Statecharts = state diagrams + depth + orthogonality + broadcast communication.
Depth is represented by the insideness of blobs.
Orthogonality is the dual of the XOR decomposition of states, in essence an AND decomposition, and is captured by the partitioning feature of higraphs, that is, by the unordered Cartesian product.
III. HIGRAPHS AS A TOOL FORCASEMANAGEMENT
PROCESSES(CMP)
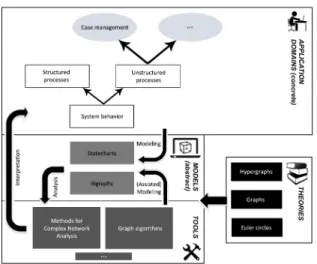
Fig. 1 illustrates our state-oriented approach for modeling and analysis of non-workflow processes. It consists of four interconnected parts:
• Application domains • Theories
• Models • Tools
Application domains depict different cases where the state-oriented approach can be used. For example, statecharts and higraphs were originally used for modeling the industrial control systems. Other domains can be also considered.
Models depict the formalisms we have chosen to represent the problems from the application domains. Statechart opera-tional semantics is used to visualise and simulate a process (e.g., with Yakindu SCT). Higraph denotational semantics provides an underlying formalism for further process analysis with the Tools.
Theories (e.g., graph theory, etc.) are used to create the algorithms and build these tools.
The selection of tools and algorithms depends on a given problem and on the concrete application domain. Once the analysis is performed, it needs to be interpreted in the Ap-plication domain. The overall objective of this approach is to create a toolbox for various types of analysis originated from graph theory and other related theories.
In our approach, we propose to model a CMP with a statechart paradigm (this is illustrated by the arrow from the Application domains to the Models in Fig. 1). The state-oriented paradigm does not specify concrete activities that should be executed during the process. The process scenarios can be discussed in more business-oriented terms such as
Fig. 1. State-oriented approach for modeling and analysis of non-workflow processes
goals and milestones (modeled as states) and constraints and requirements (modeled as events and conditions).
Statecharts provide a simple notation for visualizing the process, focusing uniquely on WHAT will be done instead of HOW it will be implemented. One can also simulate a statecharts model, playing different process scenarios, testing ”improbable” cases and improving the understanding of the process [20].
The problem of planning the course for action by the case manager can be reformulated in terms of statecharts as follows: given a current state Sc in the process and a target state T (a
desired objective)
1) what would be the best1 sequence of states
S1, S2, ...T - the best process scenario - that would
lead us from Sc to T ?
2) what are the activities that should be executed at Sc
in order to lead to realisation of this best scenario? To solve this problem, one should be able to reason about the process with mathematical rigour. The formalism of higraphs discussed below provides required mathematical foundation and enables the set of tools for process analysis (this is illustrated by the arrow from the Models to Tools in Fig. 1). In particular, we are interested in graph algorithms that can be executed iteratively, (re)defining the new current state Sc and the best scenario at this state.
The defined state-oriented model does not contain the activities; it only describes the effects (postconditions) that are required in order to trigger a transition from one state to another - the definition of activities should be supported by the Application Domain (this is illustrated by the arrow from the Tools to Application Domains in Fig. 1).
Potentially, the tools can be also used in order to reason about model (higraph or statecharts) quality (this is illustrated by the arrow from the Tools to Models in Fig. 1).
1We do not specify the criteria for the ”best” scenario as they can vary
depending on the situation (e.g., the cheapest, the fastest, the scenario where the states Sx, Sywill be avoided etc.).
In the next sections we explain how a higraph can be created from a statechart diagram and how this higraph can be further explored using graph algorithms. On the example of the classical algorithm for the shortest path, we illustrate how the best process scenario can be identified. This will answer the first question formulated above. Then we show how from the ”best sequence of states” we can identify the ”best activity” that can be recommended to the case manager. This will answer the second question formulated above.
IV. FROMSTATECHARTS TOHIGRAPHS
We use Yakindu SCT for modeling statecharts where the models are stored in XMI files. The tree structure of a state-chart model includes regions, vertices, outgoing and incoming transitions with specific attributes (e.g., id, name, type, label, etc.). The resulting models define a complex structure that may include hierarchy (i.e., regions and vertices can be placed one inside the other as many times as required) and orthogonality (i.e., regions and vertices can be placed in parallel as many times as required).
In order to find and recommend a case manager the next best step while running the process, we have transformed a statechart model into a higraph. We used Python language [21] for programming.
In order to get the data from the Yakindu SCT output files (.sct) and to transform it into higraph, we created a parser. While parcing a Yakindu statechart model, we extract process states (ids, names, types, parent-children relations), transitions (ids, names, outgoing states, incoming states, labels) and relations between regions.
We developed a higraph constructor for Statechart-Higraph transformation.
To create a higraph representation in Python, a NetworkX software package [22] was used. In particular, we constructed a directed graph with self loops and multiple edges between two nodes, which, in terms of NetworkX, is called a MultiDiGraph. We started with constructing a list of vertices (VerticeList) by going deeper into states nesting levels in each region of the Statecharts model, specifying the current region, depth level (Depth) and direct parent state (ParentVertice) for inner states. After that, we constructed a list of transitions (Transition-List) via specifying outgoing/incoming states.
Statecharts formalism allows adding entry pseudo states in each region, so that the start of the process (or a subprocess) scenario would be indicated. A MultiDiGraph, however, does not use anything similar, as entry pseudo states are not explic-itly connected to a super-state there are situated in. As a result, the VerticeList consists only of actual states of the Statecharts model.
Transitions, connecting entry pseudo states with some other states in the Statecharts model, are now replaced with transitions, connecting their direct ParentVertice with the same state.
Transformation algorithm is shown below: 1.create MultiDiGraph()
2.for each Vertice in VerticeList: 3. if VerticeDepth == 0: 4. add Vertice to BlobList 5. else:
6. if VerticeName != ’ ’: 7. find ParentVertice
8. VerticeName = ParentVerticeName + VerticeName 9. add Vertice to BlobList and InternalBlobList 10. add Nodes from BlobList to MultiDiGraph()
11. add attributes Depth and ParentBlob to Nodes in MultiDiGraph()
12. for each Transition in TransitionList:
13. if SourceVertice in BlobList and TargetVertice in BlobList:
14. add Transition(SourceVertice, TargetVertice) to EdgeList 15. else:
16. if SourceVerticeDepth != 0: 17. find ParentVertice
18. if ParentVertice in BlobList:
19. add Transition(ParentVertice, TargetVertice) to EdgeList 20. add Edges from EdgeList to MultiDiGraph()
The graph internal data structures in NetworkX are based on an adjacency list representation and implemented using Python dictionary datastructures. The graph adjaceny structure is implemented as a Python dictionary of dictionaries; the outer dictionary is keyed by nodes to values that are themselves dictionaries keyed by neighboring node to the edge attributes associated with that edge. This dict-of-dicts structure allows fast addition, deletion, and lookup of nodes and neighbors in large graphs. The underlying datastructure is accessed directly by methods (the programming interface API) in the class definitions. All functions, on the other hand, manipulate graph-like objects solely via those API methods and not by acting directly on the datastructure. This design allows for possible replacement of the dicts-of-dicts-based datastructure with an alternative datastructure that implements the same methods.
We illustrate our transformation results on several abstract examples in order to verify that datastructure and relation between the elements are modified in a correct manner.
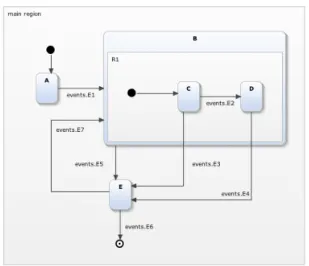
The first example (Fig. 2) shows a simple combination of 8 states with hierarchy (Entry, C and D states lie in B superstate). As proposed within the algorithm, we get rid of an Entry pseudo-state and rename C and D states into B|C and B|D, as B state is their direct parent. In the end, higraph nodes and edges are:
Ex1: Hierarchy higraph model example
Nodes: [(’A’, {’depth’: 0}), (’B’, {’depth’: 0}), (’E’, {’depth’: 0}), (’B_|_C’, {’depth’: 1, ’parent’: ’B’}), (’Stop’, {’depth’: 0}), (’B_|_D’, {’depth’: 1, ’parent’: ’B’}), (’Start’, {’depth’: 0})] Edges: [(’A’, ’B’), (’B’, ’B_|_C’), (’B’,
’E’), (’E’, ’B’), (’E’, ’Stop’), (’B_|_C’,
Fig. 2. Hierarchy statechart model example (Ex1)
Fig. 3. Concurrency statechart model example (Ex2)
’E’), (’B_|_C’, ’B_|_D’), (’B_|_D’, ’E’), (’Start’, ’A’)]
The second example (Fig. 3) focuses on concurrency property of a Statecharts model: super-state B contains regions R1 and R2, that can be reached at the same time, starting their sub-processes in parallel.
Once again, we cut Entry pseudo-states (in R1 and R2) and construct higraph nodes and edges, according to the algorithm:
Ex2: Concurrency higraph model example
Nodes: [(’A’, {’depth’: 0}), (’B’, {’depth’: 0}), (’E’, {’depth’: 0}), (’B_|_C’, {’depth’: 1, ’parent’: ’B’}), (’Stop’, {’depth’: 0}), (’B_|_F’, {’depth’: 1, ’parent’: ’B’}), (’B_|_D’, {’depth’: 1, ’parent’: ’B’}), (’Start’, {’depth’: 0})] Edges: [(’A’, ’B’), (’B’, ’B_|_C’), (’B’,
’E’), (’B’, ’B_|_F’), (’E’, ’B’), (’E’, ’Stop’), (’B_|_C’, ’E’), (’B_|_C’,
’B_|_D’), (’B_|_F’, ’E’), (’B_|_D’, ’E’), (’Start’, ’A’)]
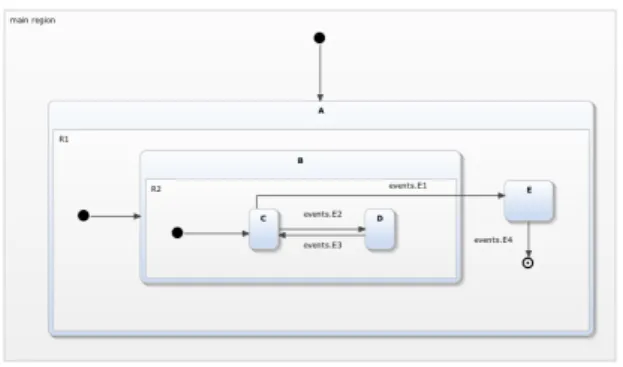
Fig. 4. Deep hierarchy statechart model example (Ex3)
The third example (Fig. 4) is a more complicated version of an hierarchy example, as there are 3 nesting levels.
Note that there are no triple named blobs among those who are on the deepest level, as only direct parent blobs are taken in account while renaming.
Ex3: Deep hierarchy higraph model example
Nodes: [(’A’, {’depth’: 0}), (’B_|_C’,
{’depth’: 2, ’parent’: ’B’}), (’A_|_Stop’, {’depth’: 1, ’parent’: ’A’}), (’Start’, {’depth’: 0}), (’A_|_B’, {’depth’: 1, ’parent’: ’A’}), (’A_|_E’, {’depth’: 1, ’parent’: ’A’}), (’B_|_D’, {’depth’: 2, ’parent’: ’B’})]
Edges: [(’A’, ’A_|_B’), (’B_|_C’, ’A_|_E’), (’B_|_C’, ’B_|_D’), (’Start’, ’A’),
(’A_|_B’, ’B_|_C’), (’A_|_E’, ’A_|_Stop’), (’B_|_D’, ’B_|_C’)]
Thus, the transformation algorithm captures the main properties of statecharts and reflects them in a form of the higraph representation, therefore enabling the usage of graph algorithms for model analysis.
V. EXPLORINGHIGRAPHS FORPROCESSANALYSIS
Now that we have transformed statecharts into higraphs, we will show how the higraph formalism can be applied to the CMP analysis and decision-making support.
A. Defining the best process scenario
In order to identify the best process scenario and figure out how the run-time analysis of higraphs can help the case manager to choose/propose an activity that would lead to a realisation of this scenario, first, we need to understand, how to apply graph algorithms to higraphs.
Despite the applications discussed in [11][18], very little work has been carried out on the algorithmic properties of higraphs.
As, by definition, higraphs are an extension of ordinary graphs by AND/OR decomposition of vertices, several blobs
can be reached at the same time. Such sets of blobs are called configurations.
Having defined the configurations, we can talk about semantics of higraphs in terms of an induced graph, where vertices are higraph configurations and edges between these vertices exist only if there is an ’appropriate’ higraph edge. This approach to semantics allows us to work with higraphs by means of ordinary graphs.
Thus, the shortest path between two blobs in a higraph is defined as the shortest path in the induced graph between any configuration containing the source blob and any configuration containing the target blob [18].
For example, consider Ex1 (Fig. 2) higraph. Here is the list of every possible path from Start to Stop blobs:
1. Start -> A -> B -> E -> Stop 2. Start -> A -> B -> B_|_C -> E -> Stop 3. Start -> A -> B -> B_|_C -> B_|_D -> E -> Stop 4. Start -> A -> B -> E -> B -> ... -> E -> Stop 5. Start -> A -> B -> B_|_C -> E -> B -> ... -> E -> Stop 6. Start -> A -> B -> B_|_C -> B_|_D -> E -> B -> ... -> E -> Stop
Since there is a cycle in this higraph, for the path list only its first iteration is considered.
The shortest path in this case is the first one, because it has the minimal number of transitions (if not specified, the default weight of any transition equals 1, except for the parent-child blob transition, which equals 0). But since the higraph represents a non-workflow process, the shortest path calculation might not be that simple.
Statecharts models consist of states and transitions between them, representing a combination of events. While the process is running, these events might or might not happen, therefore, making its corresponding transitions (un)available. As a result, if, by chance, the transition B -> E is not available at some point, path No.1 from the list is not the shortest path to reach the target Stop blob.
For the case manager, the best process scenario corresponds to a sequence of milestones that contribute best to the main process goal. The manager can select one of such scenarios (if several are available) and decide upon the activities to execute during this scenario. Alternatively, these activities can be also recommended by the algorithm.
B. From ”best scenario” to ”best course of actions” Considering that the best scenario is defined as a shortest path on the higraph, now we need to go back to the application domain and to answer the question: what are the activities that should be executed in order to lead to realisation of this best scenario?
The link between the activities that has to be scheduled by the case manager and the state-oriented model (statecharts) can be expressed as follows:
1) From the manager’s perspective, a process execution scenario consists of activities;
2) An activity can be characterised by its results (or events) produced upon the execution (often referred to as postconditions).
3) Once an event occurs, it can trigger a state transition in our state-oriented model.
In other terms, the state-oriented model describes what should be produced (event or postcondition) in order to trigger a transition required by the best scenario. An activity from the application domain that matches this description can be considered as the best activity and recommended for the case manager2. Alternatively, the case manager can define her own
activity that also matches this description.
The listing below illustrates how a list of available activities can be specified in the application domain. We define an activity through their names, preconditions (i.e., a set of of states where an activity can be executed) and postconditions (a combination of triggered events):
activities_names = {activity_1_pre : ’Activity_1’, activity_2_pre : ’Activity_2’} activities_list = {activity_1_pre : activity_1_post, activity_2_pre : activity_2_post}
activity_1_pre = (’A’, ’A_|_B’) activity_1_post = (’event_1’) activity_2_pre = (’A_|_B’, ’B_|_D’) activity_2_post = (’event_2’) activities_pre = [activity_1_pre,
activity_2_pre]
Here Activity 1 is enabled in A, A|B states and triggers event 1 when executed, while Activity 2 is available in A|B, B|D states and triggers event 2.
For a given state (or configuration of states) a list of enabled activities can be automatically defined: in our example, when the process scenario reaches the state A, Activity 1 becomes enabled and can be executed. Upon its execution, event 1 will be produced.
The fact that Activity 1 is enabled for execution at some state(s) does not mean that this activity will/should be ex-ecuted. Only if its postcondition (event 1 in our example) matches the best scenario identified by the analysis of the higraph, this activity will be suggested for execution to the case manager as (one of) the best activity.
If the case manager decides to use her own activity instead of the recommended one - she can add this activity to the list at run-time and reuse it later.
VI. CONCLUSION AND PERSPECTIVES
In our previous work, we demonstrated how a case management process can be modeled and simulated with statecharts -a st-ate-oriented form-alism invented by D-avid H-arel -and used for modeling real-time event-driven systems. Compared to
2Here we consider that some list of activities associated with the process
is defined in the application domain.
BPM approaches, a statechart process model does not specify concrete activities but only the objectives and constraints to be met. Thus, our approach does not prescribe but describe an activity to be executed next. The manager can define an activity that fit the description ”on the fly”, based on her experience and intuition, or can select such activity from a list (e.g., recommended activities or activities previously executed in a similar situations) in order to ensure a desirable process scenario.
When the process complexity grows, definition of desirable scenarios, comparison of alternatives and selection of the best scenario at run time becomes complex. Automated guidance for the case manager is a big advantage.
In this paper, we propose an approach for analysis of non-workflow processes (including case management processes) based on higraph semantics. On the example of classical shortest path algorithm, we show how the graph algorithms can be used to provide automated guidance about best scenario definition.
Higraph analysis algorithms are not limited by the short-est path computations and include much more: connectivity checking, clustering, cycle finding, communicability and other algorithms. These algorithms will be explored in our future work.
Among the main challenges of the presented approach we consider the relation between Application, Model and Tool domains (Fig. 1): Translation of a real life process to a state-chart model, identification of relevant tools and algorithms for model analysis, interpretation of the obtained results in order to provide meaningful recommendations, expressed in terms of application domain are some of the important questions that we are going to consider next.
Our proposed approach overcomes the shortcomings of the activity-centric models: the activities can be defined at run-time, the process can be (re)configured at each state depending on the situation (compared to a predefined number of variation points in conventional process models), the process can evolve as a result of an external event (making certain scenarios irrelevant). The proposed algorithms help the case manager to make better decisions while not restraining her creativity.
REFERENCES
[1] T. Davenport, Thinking for a living: How to get better performances and results from knowledge workers. Harvard Business Press, 2005. [2] OMG, “Business process model and notation (bpmn),”
http://www.omg.org/spec, 2011.
[3] M. Rosemann and W. van der Aalst, “A configurable reference mod-elling language,” Information Systems, vol. 32, no. 1, pp. 1–23, 2007. [4] E. Kushnareva, I. Rychkova, and B. Le Grand, “Modeling business
processes for automated crisis management support: lessons learned,” in IEEE 9th International Conference on Research Challenges in Information Science (RCIS), 2015.
[5] D. Harel, “Statecharts: A visual formalism for complex systems,” in Science of computer programming, 1987, vol. 8, no. 3, pp. 231–274. [6] D. Harel and E. Gery, “Executable object modeling with statecharts,”
in Proceedings of the 18th International Conference on Software Engineering, ser. ICSE ’96. Washington, DC, USA: IEEE Computer Society, 1996, pp. 246–257.
[7] D. Harel and M. Politi, Modeling reactive systems with statecharts: the STATEMATE approach. McGraw-Hill, Inc., 1998.
[8] E. Mikk, Y. Lakhnech, C. Petersohn, and M. Siegel, “On formal semantics of statecharts as supported by statemate,” in Workshop, Ilkley, vol. 14, 1997, p. 15.
[9] I. Rychkova, E. Kushnareva, and B. Le Grand, “Modeling and animation of crisis management process with statecharts,” in 14th International Conference on Perspectives in Business Informatics Research (BIR), 2015.
[10] I. AG, “Yakindu statechart tools version 2.4. for eclipse luna,” http://statecharts.org/, 2014.
[11] D. Harel, “On visual formalisms,” in Communications of the ACM, 1988, vol. 31, no. 5, pp. 514–530.
[12] W. van der Aalst, M. Pesic, and H. Schonenberg, “Declarative work-flows: Balancing between flexibility and support,” Computer Science-Research and Development, vol. 23, no. 2, pp. 99–113, 2009. [13] K. Swenson, Mastering The Unpredictable: How Adaptive Case
Man-agement Will Revolutionize The Way That Knowledge Workers Get Things Do. Meghan-Kiffer Press, 2010.
[14] R. Hull, E. Damaggio, R. De Masellis, F. Fournier, M. Gupta, F. T. Heath, III, S. Hobson, M. Linehan, S. Maradugu, A. Nigam, P. N. Sukaviriya, and R. Vaculin, “Business artifacts with guard-stage-milestone lifecycles: Managing artifact interactions with conditions and events,” in Proceedings of the 5th ACM International Conference on Distributed Event-based System, ser. DEBS ’11. New York, NY, USA: ACM, 2011, pp. 51–62.
[15] H. A. Reijers, S. Limam, and W. Van Der Aalst, “Product-based workflow design,” J. of Management Information Systems, vol. 20, no. 1, pp. 229–262, 2003.
[16] W. van der Aalst, M. Weske, and D. Gr¨unbauer, “Case handling: a new paradigm for business process support,” Data & Knowledge Engineering, vol. 53, no. 2, pp. 129–162, 2005.
[17] H. R. Motahari-Nezhad and K. D. Swenson, “Adaptive case man-agement: Overview and research challenges,” in Business Informatics (CBI), 2013 IEEE 15th Conference on. IEEE, 2013, pp. 264–269. [18] O. Grossman and D. Harel, “On the algorithmics of higraphs,” in
Technical report, Israel, 1997.
[19] K. Fogarty and M. Austin, “System modeling and traceability applica-tions of the higraph formalism,” in Technical report, USA, 2007. [20] E. Kushnareva, I. Rychkova, R. Deneckere, and B. Le Grand, “Modeling
crisis management process from goals to scenarios,” in 4th International Workshop on Adaptive Case Management and other non-workflow approaches to BPM (AdaptiveCM), 2015.
[21] “Python programming language,” http://www.python.org.
[22] A. Hagberg, D. Schult, and P. Swart, “Python language software package - networkx,” https://networkx.github.io/, 2005.