DESIGN OPTIMIZATION OF A SPACE TRUSS STRUCTURE
by
THU NGOC NGUYEN
Bachelor of Science in Civil and Environmental Engineering University of California at Berkeley, California -May 1996
Bachelor of Architecture
University of Architecture, Ho-Chi-Minh City, Vietnam -October 1991
Submitted to the Department of Civil and Environmental Engineering In Partial Fulfillment of the Requirements for the Degree of
MASTER OF ENGINEERING
IN CIVIL AND ENVIRONMENTAL ENGINEERING
at the
MASSACHUSETTS INSTITUTE OF TECHNOLOGY June 1998
© 1998 Thu Ngoc Nguyen All rights reserved
The author hereby grants to M.L T. permission to reproduce and distribute publicly paper and electronic copies of this thesis document in whole or in part.
Signature of the Author
Department of Civil and Environmental Engineering May 8, 1998 A 1
Certified by
Accepted by
,/ Professor Jerome J. Connor Department of Civil and Environmental Engineering Thesis Supervisor
Sv Professor Joseph Sussman Chairman, Department Committee on Graduate Studies
JUN 0
Z192
3
c~
DESIGN OPTIMIZATION OF A SPACE TRUSS STRUCTURE
by
THU NGOC NGUYEN
Submitted to the Department of Civil and Environmental Engineering on May 8, 1998 in partial fulfillment of the requirements for the Degree of Master of Engineering
in Civil and Environmental Engineering.
Abstract
This thesis focuses on the design optimization of a cable-stayed space truss structure proposed as part of a project design study by the High Performance Structures group in the Master of Engineering program. The design optimization investigates further into the cable-stayed scheme of the entire roof system. A beam on elastic foundation model is used for preliminary analysis purpose; the space truss structure is modeled as beam and the cable system as an elastic foundation. By adjusting the stiffness of the cables, one can minimize the stiffness of the truss while achieving a more uniform deflection and member stress. Following the preliminary analysis, a large-scale model is generated in SAP2000 for static and dynamic analyses of the entire structure. The outputs are compared with each other and checked against strength and deflection requirements. Global stability is also examined. Finally, passive motion control method using a tuned mass damper is incorporated into the system to optimize its dynamic behavior.
Thesis Supervisor: Jerome J. Connor
Acknowledgements
First of all, I would like to thank my advisor, Professor Jerome Connor, for all his help to
make this thesis possible, for his understanding and trust in whatever I was doing. His knowledge and passion of the profession truly inspire me all through the year. Thanks also to Charlie Helliwell for his supports to the M.Eng. program in general, and to the HPS project and thesis in particular. Thanks also go to the members of HPS group, especially group B, for your contribution to our group project. Thanks to all members of
M.Eng. class 1998 for sharing good times. The presence of many of you in the M.Eng. room at late hours during the past few weeks really encouraged me to work harder and harder.
Very special thanks to my parents, sisters, and brother for your continuous support for whatever I am doing. Wonderful! You are always my greatest source of strength for all these years. My friends, here and there all over the world, you cannot be missed!
Finally, I owe thanks to the M.Eng. computer net supports, folks at CSI for prompt
TABLE
OF CONTENTS
1. OVERVIEW AND BACKGROUND ... 8
1.1 OVERVIEW ... 8
1.2 BACKGROUND ... ... ... 9
1.2.1 High Performance Project .... ... 9
1.2.2 Selected Scheme ... .. ... 9
1.2.3 Selected Roof Structure ... 17
2. LOAD AND LOAD CASES ... 19
2.1 LOAD CASES ... ... 19
2.2 DEAD LOAD ... ... 20
2.3 LIVE AND SNOW LOADS ... 21
2.4 W IN D L O AD ... 22
2.5 SEISM IC LOAD ... ... . ... 24
3. SPACE TRUSS ROOF STRUCTURE ... ... 25
3.1 DESCRIPTION OF SPACE TRUSS STRUCTURE ... 25
3.2 SUSTAINING SYSTEM ... 26
3.3 LATERAL RESISTANCE SYSTEM ... ... .. 28
3.4 TRUSS MEMBER LAYOUT ... 29
4. PRELIMINARY DESIGN OF SUSTAINING SYSTEM ... 30
3.1 M A STS ... ... 30
3.2 SUSTAINING CABLE SYSTEM ... . 31
5. PRELIMINARY DESIGN OF SPACE TRUSS ... 34
5.1 EQUIVALENT BEAM MODEL ... 34
5.2 SAP2000 MODEL ... ... 34
5.3 STATIC A NALYSIS ... 35
5.3.1 Equivalent Beam Model ... ... 35
5.3.2 SAP2000 Model ... . ... ... 36
5.4 DYNAMIC ANALYSIS ... 37
5.4.1 Response to Wind Loading ... ... ... . 37
5.4.2 Response to Lateral and Excitation Loading ... ... 38
5.5 STABILITY CONSIDERATION ... 40
6. DESIGN OPTIMIZATION ... 41
6.1 OPTIMIZATION METHODOLOGY ... ... 41
6.1.1 Optimization Design of Sustaining Cable Systems ... 42
6.2 STATIC ANALYSIS ... 44
6.2.1 Updated Bending Rigidity DB ... ... 44
6.2.2 Response due to 1.2DL+1.6LL ... 45
6.2.3 Response using Influence Line ... 45
6.3 DYNAMIC ANALYSIS ... 46
6.3.1 Response to Vertical Loading ... 46
6.3.2 Response to Lateral Loading ... ... ... 47
6.4 STABILITY CHECK ... 48
6.5 SUMILRY ... 48
7. MOTION CONTROL ... 49
7.1 MODEL WITH DAMPING ... 49
7.2 RESULTS ... 49
7.3 EVALUATION ... ... 50
8. SUGGESTIONS FOR FURTHER STUDY ... 51
8.1 COMPLETE MODEL ... 51
8.2 STABILITY OF COMPLETE STRUCTURAL SYSTEM ... ... 51
8.3 AERODYNAMIC EFFECT ... 52
8.4 EXPERIMENT IN WIND TUNNEL ... 52
8.5 CONNECTIONS BETWEEN STRUCTURAL ELEMENTS ... 53
8.6 O TH ERS ... ... ... 53
0. EVALUATION ... 54
10. CONCLUSION ... 55
APPENDIX ... 57
LIST OF
TABLES
Table 2-1: Factored load combinations. Table 2-2: Table 2-3: Table 2-4: Table 3-1: Table 4.1: Table 5-1: Table 5-2: Table 5-3: Table 5-4: Table 5-5: Table 5-6: Table 5-7: Table 6-1: Table 6-2: Table 6-3: Table 6-4: Table 6-5: Table 6-6: Table 6-7: Table 6-8: Table 6-9: Table 6-10: Table 6-11: Table 6-12: Table 7-1: Table 7-2:
Unit Dead load.
Summary of Snow Loads. Reference Wind Pressure. Member Section Properties.
Equivalent Spring Stiffness for Sustaining Cables. Maximum Member Stress (ksi).
Maximum Global Deflection (in).
Maximum Element Stress due to Wind Load (ksi). Maximum Global Deflection due to Wind Load (in). Maximum Element Stress due to Lateral Excitation (ksi). Maximum Global Deflection due to Lateral Excitation (in). Modal period of structure due to Lateral Excitation (sec). Update Cable Sizes.
Update Member Section Properties. Optimized Equivalent Spring Stiffness. Maximum Element Stresses (ksi). Maximum Global Deflection (in).
Maximum Global Deflection using Influence Line (in). Maximum Element Stress due to Wind Excitation (ksi). Maximum Global Deflection due to Wind Excitation (in). Maximum Element Stress due to Lateral Excitation (ksi). Maximum Global Deflection due to Lateral Excitation (in). Modal period of structure due to Lateral Excitation (sec). Summary of Maximum Member Stress and Global Deflection.
Maximum Element Stress due to Lateral Excitation with 5% damping (ksi). Comparison of Global Deflection due to Lateral Excitation (in).
LIST
OF FIGURES
Figure 1-1: Figure 1-2: Figure 1-3: Figure 1-4: Figure 1-5: Figure 1-6: Figure 1-7: Figure 3-1: Figure 3-2: Figure 3-3: Figure 3-4: Figure 3-5: Figure 3-6: Figure 5-1: Figure 5-2:Plan and Elevation. Perspective. Roof Plan.
Typical Floor Plan. South Elevation. East Elevation.
Longitudinal Cross-section. Cable layout Plan.
Longitudinal Elevation. Transverse Elevation. Longitudinal Elevation. Transverse Elevation.
Member Type Arrangement Plan. Member Force Diagram.
Chapter
1
OVERVIEW
AND BACKGROUND
1.1 Overview
This thesis focuses on the optimal design aspect of a cable-stayed space truss
structure. This space truss is called a "unistrut" space truss because it is composed of
many members working primarily in axial action (Coy 12). Eight "unistrut" members
form a tetrahedral shape with a square base. These tetrahedral elements are in turn
arranged next to each other to form the entire space structure.
The scope of this thesis is limited to the case study of a 90 feet wide by 270 feet
long by 6 feet deep roof space truss structure for a new facility for the Civil and
Environmental Engineering Department at the Massachusetts Institute of Technology.
The selected roof is a part of the Master of Engineering class 1998 High Performance
Structure project designed by Group B.
The analysis phase is concerned with determining the response due to static and
dynamic loading, and evaluating the use of damping to control the motion. Among many
alternatives for damping, a passive control method using a tuned-mass damper is selected
for this project. The tuned-mass damper is located at a specific location on the space truss
structure to maximize its effectiveness. At the same time, the physical properties of each
element of the space truss are iterated to increase the effectiveness of the damping
The ultimate goal of the design optimization is to control the response of the
structure under any loading condition to a satisfactory level of uniformity and comfort for
occupants of the facility. The design optimization reduces the maximum global deflection
to avoid interference with other structural as well as non-structural elements of the whole
building.
1.2 Background
1.2.1 High Performance Structure Project
The High Performance Structure project is one of the academic components of the
Master of Engineering program for the structural engineering concentration at MIT. This
year's project is the conceptual design of a new facility for the Civil and Environmental
Engineering Department. The High Performance Structure group is divided into two
structural groups responsible for both architectural and structural design, Geotechnical
and Smart Technology groups supported the structural groups. Within each structural
group, team members suggest several schemes responding to the requirements from the
client, which is the CEE department. The scope of this thesis is limited to only one of the
selected schemes.
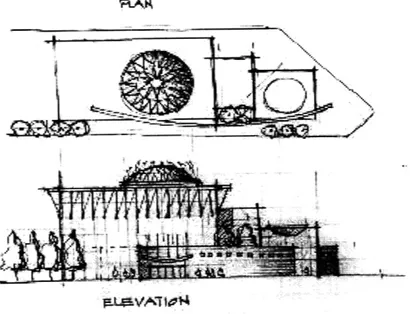
1.2.2 Selected Scheme
This scheme incorporates the dome-one of MIT symbols-as a major
architectural theme. The facility consists of three blocks with step-up elevation to
increase the visibility from the traffic intersection of Main Street and Vassar Street
Boston. A glass atrium is suggested at the entrance end as an inviting open space. A
reverse dome hanging from the roof is visible through the glass atrium to balance
spatially and geometrically with the bigger dome on the main building. A curved concrete
wall of two-story height embraces the three rectangular blocks while creating a
semi-open green space in between. The difference in shape, size, and geometry of the blocks
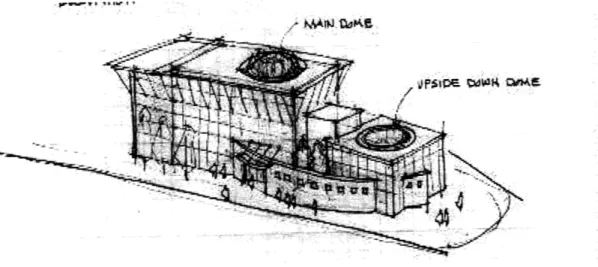
creates a lively and friendly atmosphere for the MIT community. Figures 1-1 and 1-2
show sketches for Plan, Elevation, and Perspective of this selected scheme.
RAL
9z4VTj1A
Figure 1-1: Plan and Elevation
I __ _
kkAnd .AM
Figure 1-2: Perspective.
One of the highlights of this scheme is a moveable dome structure. There is one
dome covering the main atrium in the main structure and one reverse dome covering the
entrance atrium. The main dome has steel frames with colored glass in the shape of
flower petal. These petals can be moved parallel to each other around the dome-top
center. The movement creates an overlapping of petals, and is controlled by a light
sensor. The sensor determines how much light is needed in the main atrium according to
required comfort level while creating a lively blossoming effect.
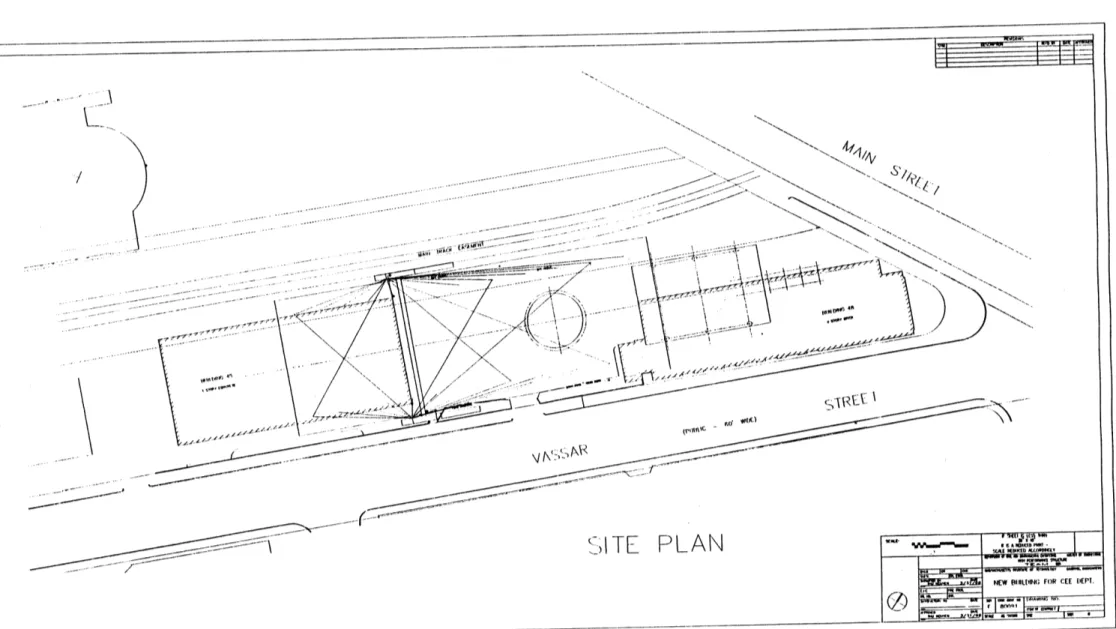
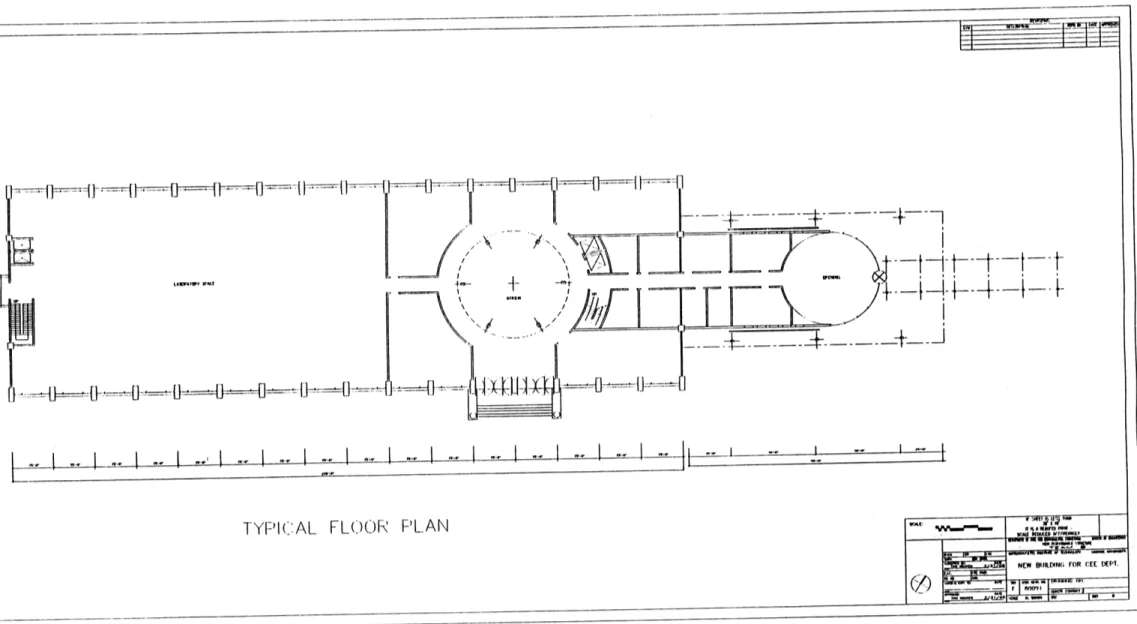
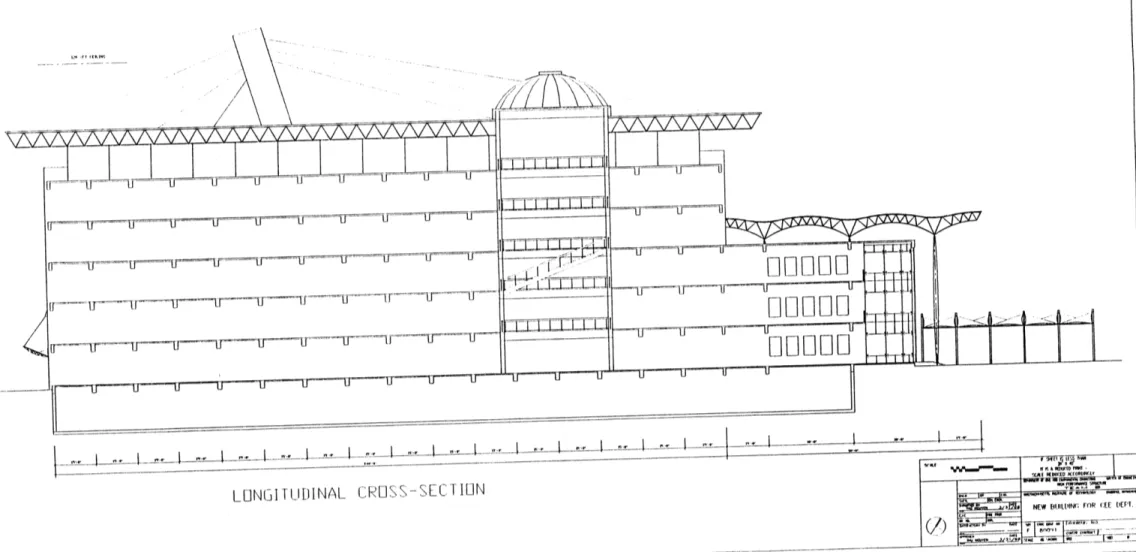
Structurally, this scheme can accommodate a very long span to obtain maximum interior space desired by the client while minimizing the vibration effect caused by the nearby train, subway, and surrounding traffic. The selected scheme is then modified for a more realistic architecture incorporating valid ideas from all group members. Figures 1-3 to 1-7
depict the roof plan, typical floor plan, elevations, and cross-section of the new building. x
- --
--~I..
LI-
"l xo. - ... .. .... "
JITE PLAN
:'"
I,
Figure 1-3: Roof Plan.
L
- iii'" -~~...- ~...~..-~~~.... ~....~.-...- ...- ~~....~ .---~_.__c-I
___
_~---
---I
TYPICAL FLOOR PLAN
Figure 1-4: Typical Floor Plan.
-t--f
-i-4
I ,, i, I - ~---- --1~ ~--- --- -----I
.,
I ... I I -- I I I - I I I-C L iLI
- L.- I -- I " I
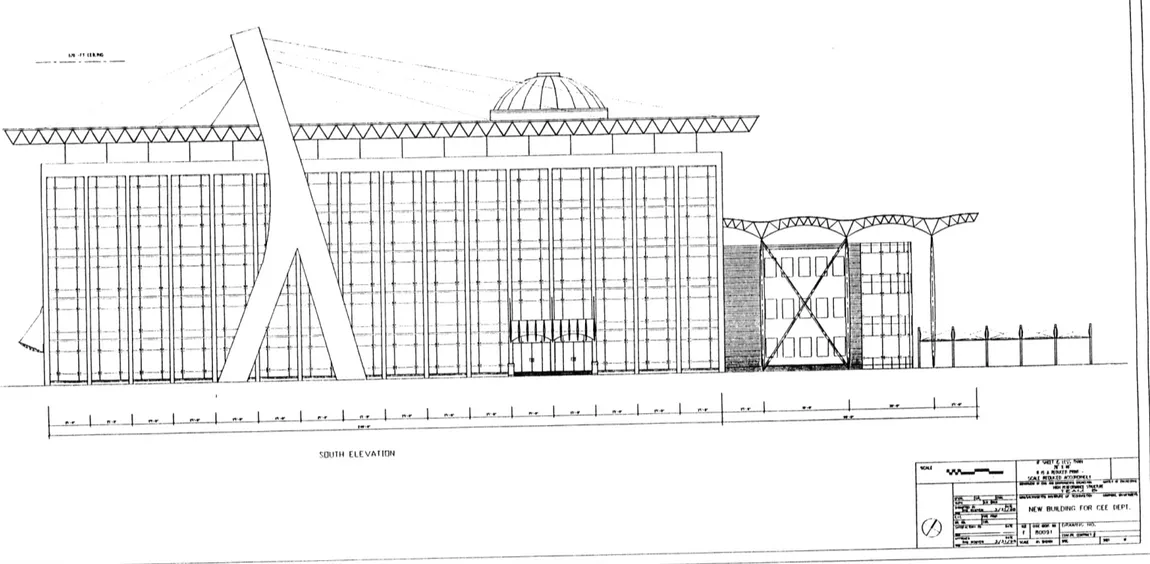
SOIJTH ELEVATION
Figure 1-5: South Elevation.
_ _ _. ___ L _ I I II ( ILMC
I .- I -
I - I --
"-__~~ ___~ ___EAST ELEVATION Figure-l-6:-East Elevation. 14 " 1.9 41 Ctlow. ---I -- I .I I .- -- I
f~i_
U UU l{ -- -U wr-c-h;r==Th--- mu--9~ i----1rm-m , wtr-mw. m 1r~-s--U U U U U U U U U U [1 I -I7-TT-TTF-- II U U U ~NW~~
lt= m m rb u U 00000 IIJ~E~-CCCJ __ 31 7 7 U U U U U u U U U U U U UID]
]
]u
I~Itt~
I I
I~~~~~~~~ I__ rr- Ln _- n~_I .L___ A .- __~_l L ~~F - r
[
LONGITUDINAL CROSS-SECT]ION
Figure 1-7: Longitudinal Cross-section.
/ __ I ~_ __I~C _ I _ _ _ _ L __ _I -- I __1 I
,I
I-
I
--- --~---~ - ~ - - - - ~I I 1 ~ - - --- - - --- - -rI-I -- II--Y
I I I1 u u u u u u u u u u u u u a I I 11 ---lI i II r r i, lt-i. I, ' I -- -- I I I U Ii U I U~ U U U U I __I I ' *v ~-rI -I --
I1.2.3 Selected Roof Structure
The daring roof design concept illustrates the power, elegance, and responsibility of civil engineering. Moreover, the resemblance to "half a cable-stayed bridge" is obvious and intentional for the new Civil and Environmental Engineering building.
The roof shelters, but appears separate from, the rectangular building beneath; indeed, the gravity load of the roof is not resisted by the framing of the six story building. This aspect of our design is discernable by the layman because of three clues. First, the
piers/masts stand just outside the 240' long exterior walls of the six-story section of the building. Second, there is a bank of windows all around the sixth floor. Third, the top
floor is free of columns. (N.B. Lateral bracing of the piers which resist roof gravity
loads, would be integrated into frame of the six-story building in the next design stage.) Massive reinforced-concrete masts support the space truss roof, while steel cables
connected to the mast resist a portion of the gravity loads acting on the roof. A "lambda-shaped" pier on each of the long sides of the building rises 150' vertically to the point
where the cables are attached. It supports the entire weight of the roof system as well as
the moments resulting from the non-symmetric cable layout and location of the point of
attachment of the roof truss. The lateral bracing system of the masts consists of beams
passing between the two "lambda-shaped" piers.
Twelve steel cables attached to the top of each mast connect to points along the
270' edges of the roof. Each set of twelve cables forms a slight angle with the vertical
plane. This slanted configuration creates bi-axial bending in the concrete masts. The
cables are pre-stressed so that there is no deflection in the roof due to dead load after
The roof truss is connected with simple connections to the underside of a beam passing between the two masts and to the 24 cables. Additional tension members running
from the top floor of the six-story building laterally brace and stabilize the roof. A circular opening in the roof truss is intended to accommodate the dome. Truss elements surrounding this opening area are stronger than regular elements due to stress
concentration.
Live/snow, dead, wind, and earthquake loads are relevant to the roof system design. We design for a snow/live load of 30 psf on a 270'x90' flat roof. We assume 75
psf of dead load. Wind loads are as given in Uniform Building Code. Refer to chapter 2
for more calculations of applied loads.
As this is a conceptual design, it is based on many assumptions on loads and
simplified connections. Lateral bracing system of the masts consists of two beams
passing above the roof truss. It is also likely that pin-connections between the concrete
pier components would really be designed as rigid joints. The next stage would involve
the generation of a computer model for the entire building, which would suggest changes
Chapter 2
LOAD
AND LOAD CASES
Before the most efficient building system can be established, designed, and finalized, the loads that will act on the building must be determined. Due to the
geometric restrictions of the site and the extreme nature of the structural design proposed,
the loading effects on the building may be greatly magnified if not carefully considered in
design. Within the scope of this thesis, static and dynamic analyses are considered. For
static analysis, only dead and live loads are used. Wind load is ignored to be more
conservative because wind load is in fact acting as a suction force on flat roof. For
dynamic analysis, wind load is applied as a vertical loading, and earthquake is a lateral
loading.
2.1 Load cases
We use the factored load combinations from the LRFD manuals. Preliminary
calculations indicate wind load conditions need not be considered it results in less
favorable stress conditions, except for the dynamic analysis considering vertical loading.
Table 2-1: Factored load combinations Combination Factored load or load effect U
1 1.4D 2 1.2D + 1.6L + .5(Lr or S or R) 3 1.2D + 1.6 (L or S or R) + (.5L or .8W) 4 1.2D + 1.3W + .5L + .2S 5 1.2D + 1.OE + .5L + .2S 6 .9D + (1.OE or 1.3W) 2.2 Dead Load
Since no actual design calculations have been made at this stage of the project, these weights are just a first approximation. After various calculations have been
completed, an improved estimate of the dead loads can be generated. The following table summarizes the surface loads initially assumed and estimated.
Table 2-2: Unit Dead load
Building Element Loads
Roof water-proof material 5 psf
Roof cover 5 psf Space truss 15 psf Suspended ceiling 11 psf Lighting 5 psf HVAC 6 psf Sprinkler 8 psf Fire protection 2 psf Total Dunit 57 psf
Total Dead load:
2.3 Live and Snow Loads
Roof live load is estimated to be 20 psf, mainly for the purpose of maintenance because no public access is allowed on the roof. In addition, when roof live load is
present, it covers only certain area rather than the entire roof surface. Hence, this live
load is very insignificant.
The snow load is estimated according to Massachusetts State Code, Chapter 16, 780 CMR 1610.0. Since Boston is classified as part of Snow Load Zone 2, the basic
snow load is taken to be a uniformly distributed surface load, P, of 30 psf from Section 1610.2. In this case, according to LRFD, snow load governs.
Since the roof of the entire proposed building is not wholly flat, snowdrifts must
be accounted for. Special considerations must be taken for the dome and the region
surrounding it. On the dome itself, the uniform snow load, P,, is calculated to be 26.3 psf. This surface load will be applied to the area below the effective roof slope, while the
surface of the dome with a tangent that equals to or exceeds 700 will be considered free of snow. In addition, with a domed surface, sliding snow loads are unavoidable and should be investigated. For the proposed dome diameter of 40 feet, the area affected by sliding
snow is found to be the circular area 50 feet in diameter concentric with the dome. The
estimated pressure by these sliding loads is 27.43 psf with a subsequent loading of 16.73
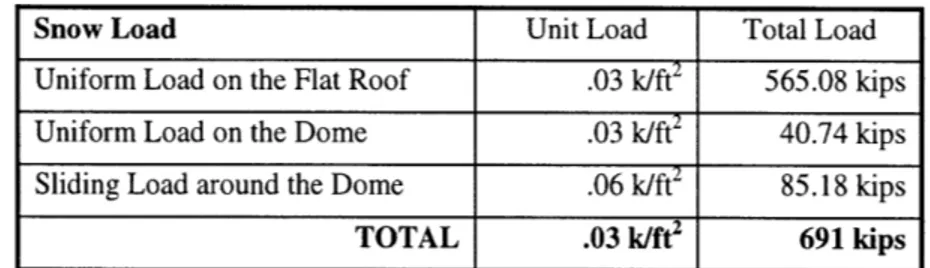
Table 2-3: Summary of Snow Loads
Snow Load Unit Load Total Load
Uniform Load on the Flat Roof .03 k/ft2 565.08 kips Uniform Load on the Dome .03 k/ft2 40.74 kips Sliding Load around the Dome .06 k/ft2 85.18 kips
TOTAL .03 k/ft2 691 kips
Total Snow load:
Sto, = Area x Sui = (270ft x 90ft -fr x 202 ft 2)x 30psf = 691k
2.4 Wind Load
The wind loads on a structure or building can be determined using either an analytical procedure or wind tunnel tests. The analytical procedure is usually employed, but wind tunnel results may be required for exceptional cases. For the proposed building design, we use the analytical procedure from the Massachusetts State Building Code (780 CMR 1611.0 Wind Loads) rather than the more general ASCE-7. We do not undertake wind tunnel testing.
780 CMR defines the wind load as "The lateral pressure on the building or
structure in pounds per square foot (psf) due to wind blowing in any direction."
Construction documents must contain the following, regardless of whether wind loads govern the lateral design of the building: wind load zone, wind pressure (P), and special
exposures.
The site of our building lies in wind zone 3 (Eastern Massachusetts); the reference
wind velocity for zone 3 is V,, = 90 mph. We have decided to use exposure B rather than exposure A, which might also be valid though less conservative. Exposure B is described
as "suburban areas, towns, city outskirts, wooded areas, and rolling terrain," applying only when the terrain for at least one half mile upwind is a "continuous urban
development, forest, wooded area, or rolling terrain."
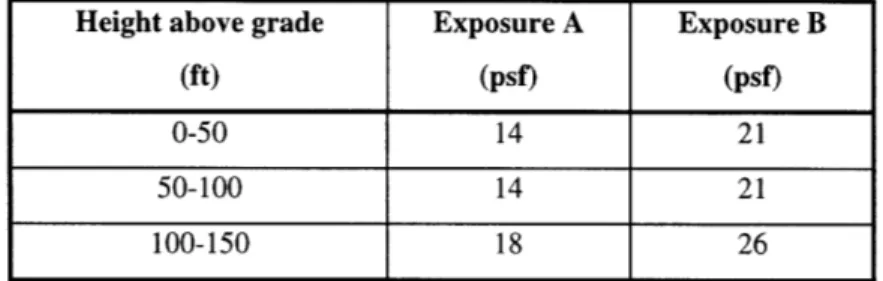
The following table shows the reference wind pressures for our building given by Exposure Group B but includes the data for Exposure A for comparison.
Table 2-4: Reference Wind Pressure
Height above grade Exposure A Exposure B
(ft) (psf) (psf)
0-50 14 21
50-100 14 21
100-150 18 26
For the wind loading on the roof, the relevant portions of 780 CMR are sections 1611.8 and 1611.9. Our flat roof must resist a suction of 0.6 times the reference wind
pressure, hence 0.6 x 21 psf. The roof must resist an internal pressure of 0.2 times the reference wind pressure, applied as a positive pressure or as a suction, whichever gives the greater structural effect when added to the external pressure, for the design of each structural component.
In regards to the wind loading on the masts of the proposed structure, Section
1611.12 indicates that we will need to use ASCE-7 tables 12 through 16 for the masts to
which our cables are attached.
Examples of the geometries that may need wind tunnel testing are domes, arches, bridges and trussed towers. Unusual building geometries, like this roof design, may
result in unexpected reactions in the structure while upwind obstructions may cause
examined further especially if there is no adequate documentation of the wind effects available.
While wind tunnel procedures are more accurate than the analytical procedure, they are considerably more expensive. Though we will not undertake wind tunnel tests, we do advise them (in light our building's unusual roof geometry) if our structural configuration is to be pursued.
2.5 Seismic Load
In order to design for the structural integrity of the proposed building during a probable earthquake, the Massachusetts State Building Code specifications for seismic load determination and guidelines for seismic design found in Section 1612.0 are used. Falling into Seismic Hazard Exposure Group II, the building must meet the design
requirements of Seismic Performance Category C - that is, 0.015hs, where h, is the story height below level x. Because of the high performance requirement of this roof system, the masts are not allowed to deflect excessively. A small lateral deflection of the masts will translate into a large vertical deflection at the end of the space truss. Therefore, a conservative limit on drift of L/400 is used instead. This specified drift ratio is only applied to calculate the equivalent lateral stiffness, which the masts contribute to the system.
Only the computer model in SAP2000 is subjected to seismic loading, which uses
Chapter3
SPACE TRUSS ROOF
STRUCTURE
3.1 Description of Space Truss Structure
The one-piece roof structure proposed for this project is a "unistrut" space truss, which is composed of multiple tetrahedral modules. Each module is 6 feet high and has a 6-foot square base. The overall dimension of the space truss is 270 feet in length by 90 feet in width and 6 feet in depth, covering the 240 feet by 75 feet building underneath. All truss members are specified as A53 Grade B steel pipes with Fy = 35 ksi and F, = 60
ksi.
The roof structure is connected by hinges to a cable-stayed-girder near the mid-point of truss span. Twelve pairs of cables in "bundles" arrangement hang the two cantilever ends of the truss and transfer loads to a pair of concrete masts along the longitudinal sides of the truss. See Figures 3-1 to 3-5 for sustaining and lateral resistance cable arrangement.
The deflection of the truss is the critical concern of the entire problem because of
its long span cantilever. Throughout the analysis, controlling the maximum global deflection of the space truss is primary objective.
3.2 Sustaining System
G I .. % . .
--w
C-C.ALE
LArOUT
L1NIT LDI 4AL,
ELEVATION
Figure 3-2: Longitudinal Elevation.
I i
I I
CAPRL
LAOYOUT ft1EVAT
ION
Figure 3-3: Transverse Elevation.Figure 3-3: Transverse Elevation.
LX I ,s I
I
ii
13.3 Lateral Resistance System
IA._.AL. ,E
STA NCE .Y$T&M
ON diT UDI NAL.
Figure 3-4: Longitudinal Elevation.
LAIW-AII PftTINGB -
-/
I/
/
---I
ALtAL4 RtESTING SYSTEMI
Figure 3-5: Transverse Elevation.
3.4 Truss Member Layout
Outside 4 (in)
1 2.375
2 3.5
Table 3-1: Member Section Properties.
Wall thickness (in) Area (in2) Moment of Inertia (in4)
.436 2.66 1.31
.6 5.47 5.99
Use type 1 (see Table 3-1) for all diagonal members except for those at locations
where stress concentration from supports may occur. Use type 2 for all other diagonal
members and all members in the top and bottom planes. Refer to the following figure for
details. The elements in shaded areas are of type 2. Otherwise, they are of type 1 except
for those on top and bottom layers.
Figure 3-6: Member Type Arrangement Plan. Type
Chapter4
PRELIMINARY DESIGN
OF
SUSTAINING SYSTEM
4.1 Masts
The design of the reinforced concrete masts is not within the scope of this thesis.
Only a first rough calculation is rendered to obtain the equivalent lateral stiffnesses from
the masts applied to the space truss. These lateral stiffnesses are included in the space
truss model as springs for analysis purpose.
A performance-based requirement is assumed to simplify the lateral stiffness
calculation. A preliminary calculation shows that the lateral stiffness of the masts is very
critical to the system. The analysis again indicates that global deflection of the space truss
is the dominant factor of the entire design. According to the calculation (refer to
Appendix 4 for detailed calculation), a drift ratio of LJ600 in the transverse direction is
required for a maximum lateral deflection of 2 inches. The drift ratio in the lateral
deflection is more restricted because it magnifies the global deflection at roof end.
Therefore, it is assumed to be /1050 responding to a limit of 1.14 inches. The stiffness
of the masts required to achieve this drift ratio is almost infeasible. This may be a
considerable design problem that requires a more sophisticated and accurate analysis.
Longitudinal lateral stiffness of each mast: km,,r = 1212 kips / in Transverse lateral stiffness of each mast:
k'mast
= 691 kips / in4.2 Sustaining Cable Systems
Twenty-four steel (50 ksi) cables counteract the deflection and resist loads applied
to the roof truss. Twelve cables are attached to the top of each mast and connect to points
along the 270' edge of the roof adjacent to the mast. As the cables are arranged with a
slight angle with the vertical plane (approximate 14'), bi-axial bending is expected in the
masts. The cables are pre-stressed so that there is no deflection in the roof due to dead
load.
In our design we first locate the mast top at 50' above a 10' high roof truss and 80'
from the left-hand-side of the roof truss. Since the roof truss bays are 6', the cables are
attached to the truss at intervals that are multiples of 6'. For aesthetic reasons, the
attachment points of the leftmost six cables are spaced at 18', while for the other six the
spacing is 24'.
The cable deflection data spreadsheet (Table 4-A, Appendix 4) shows the cable
locations and calculates the length, stiffness, and sine of the angle (with respect to the
roof) of each cable given its area and material properties. Tension, stress, elongation, and
vertical deflection of the point of attachment to the roof truss are also determined, given
the vertical force, which each cable is to resist.
Note that the spreadsheet does not account for a strength reduction factor (though
it can be added easily if required), thus a factored cable stress greater than 45 ksi (0.9*50
ksi) would be unacceptable. For example, if we wanted the cable system to resist all of
the factored live and dead load, we see from the data that we would need to redesign the
The means of calculating the vertical deflection (vertical deflection is
approximately the cable elongation divided by sine of the angle w.r.t. the roof) and
vertical stiffness of the cables (vertical stiffness is the force required for a unit vertical
deflection at the cable connection point) are described in Appendix 4. Notice that we
distribute the load to the cables using tributary areas neglecting irregularities in uniform
loads caused by the presence of the dome.
We design the pre-stress of the cable system to equilibrate the unfactored roof
dead load, hence we eliminate roof deflection due to service dead load. The cables must
be strong enough to bear all of the factored dead load and at least a portion of the factored
live load. It is important to decide how much of the live load will be born by the cables
and how much by the roof truss.
Appendix 4 describes our preferred model for the cable-truss interaction, while
design optimization of the cable system is covered in a later chapter. For conceptual
design phase, we divide the vertical load between the truss and cables thus: the cables
carry all the factored dead load plus half the factored live load, while the truss supports
half the live load. We see from Table 4-A in Appendix 4 that the cables deflect 0.57" and
2.19" under service live load at the left- and right-hand sides respectively; even without
the bending stiffness of the space truss this is more than adequate. (The limiting values
are 3.6" and 4.4". See Appendix 4.)
Looking at Case II of Table 4-A of Appendix 4 we see that the greatest cable
stress is 41 ksi which is below the reduced cable strength, 45 ksi (0.9 * 50 ksi). Thus the
For space truss analysis purpose, all cables are modeled as springs to sustain the
roof structure. Based on the cable stiffness from Table 4-A in Appendix 4, the table
below tabulates the equivalent spring stiffness in each coordinate direction. This spring
stiffness is later used for both equivalent beam and SAP2000 models.
Table 4.1: Equivalent Spring Stiffness for Sustaining Cables.
Cable no Joint L Joint R E (ksi) Area (in2) x y z L K (kip/in) kx ky kz 1 124 42 29000 5.00 78 15 50 94 128.5 106.7 20.5 68.4 2 140 210 29000 5.00 60 15 50 80 151.0 113.3 28.3 94.4 3 145 223 29000 5.00 42 15 50 67 180.3 113.1 40.4 134.6 4 170 394 29000 5.00 24 15 50 57 212.0 89.3 55.8 186.0 5 197 435 29000 5.00 6 15 50 53 228.0 25.8 64.5 215.1 6 898 582 29000 5.00 12 15 50 54 223.8 49.7 62.2 207.2 7 1226 635 29000 5.00 42 15 50 67 180.3 113.1 40.4 134.6 8 1292 799 29000 10.00 66 15 50 84 287.7 226.0 51.4 171.2 9 1354 835 29000 10.00 90 15 50 104 232.4 201.1 33.5 111.7 10 1383 999 29000 10.00 114 15 50 125 193.3 176.3 23.2 77.3 11 1405 1035 29000 10.00 138 15 50 148 163.3 152.3 16.5 55.2 12 1431 1199 29000 10.00 162 15 50 170 142.2 135.5 12.5 41.8
Chapter 5
PRELIMINARY DESIGN
OF SPACE
TRUSS
5.1 Equivalent Beam Model
First, the space truss is modeled as a beam to check for bending and shear
capacity. These values will be used as a reference to compare to those obtained from
computer results. The stiffness of the equivalent beam is obtained by using a computer
model with simple supports at two ends. A vertical distributed load is applied along the
entire beam. Its deflection is used to obtain bending rigidity D,. Refer to Appendix 5 for detailed calculations.
DB = EI = 2.18x10⁹ kips-ft2, model includes cable vertical stiffness DB = EI = 29.8x10⁶ kips-ft2, model excludes cable vertical stiffness
5.2 Computer Model in SAP2000
The computer model built in SAP2000 is a real scale space truss model as
described in Chapter 3. All truss element joints and connections between cable-truss,
beam-truss, and mast-truss are modeled as pins. However, in preliminary design phase, lateral stiffnesses from masts are not included in the model for simplicity.
5.3 Static Analysis
Assume that the modular roof cover is attached to the space truss only at joint
locations. Therefore at every joint in the top plane there is a point load resulting from
distributed load over an area of 6 feet by 6 feet. Refer to Appendix 5 for calculations.
Dead load at each joint: Djoint = 2.052 k
Snow load at each joint: Sjoint = 1.08 k
For serviceability, maximum deflection is restricted at 2 inches in any direction to
avoid interference to glass windows and other non-structural elements on the sixth floor
below the roof. As discussed in section 4.2, the cables will be pre-stressed for dead load.
As a result, the roof truss is level after being completely installed. When the building is in
service, any deflection of the roof is only due to live load, snow load, wind load, or
vibration-induced load; and again that deflection should not exceed 2 inches.
5.3.1 On equivalent beam model:
Transverse Shear: is ignored due to its insignificant contribution to overall stress. Moment Capacity: My= 13,450.4 k.ft
Mp = 20,175.6 k.ft
Ultimate Moment: MU = 9,165.9 k.ft < OMy (0 = 0.9 for bending) - OK
Member Force in top and bottom planes:
* Compression @ bottom: f, = 18.61 ksi -- OK
5.3.2 On SAP2000 model:
Static analysis includes the following considerations:
* P-Delta effect
* Linear and non-linear analysis
* Full member length, ignoring end-offset-overlapping portion of member at
joint-member connection
Load combinations to be considered to obtain stress and deflection:
* factored dead load
* factored live load
* factored dead load plus factored live load
Output summary:
Figure 5-1: Member Force Diagram.
The above Figure 5-1 is a typical SAP2000 output illustrating the magnitude of
axial force in truss elements. The lighter color represents tensile force and darker color
represents compressive force. Table 5-1 below tabulates the maximum axial force in
Table 5-2 summarizes the maximum deflection measured at extreme end of the
cantilevers where deflection is the most critical. Tensile and compressive stress is then
compared with allowable stress. Euler critical buckling equation used in this case:
r2 EA I
critical LA
where I, A, and L are moment of inertia, area, and length of member, respectively.
Table 5-1: Maximum Member Stress.
Area Length Tensio Comp. Stress (ksi) Critical Buckling (in2) (in) n (kips) (kips) Tensile Comp. Load (kips) Horizontal member 5.47 72 118.76 103.14 21.71 18.86 330.72 Diagonal member 2.66 88.18 47.88 43.03 18.00 16.18 107.22 Diagonal member at 5.47 88.18 75.82 - 13.86 - 220.49 cable connection
Table 5-2: Maximum Global Deflection (in).
Deflection due to Deflection due to Deflection due to
1.2D 1.2D + 1.6S 1.6S after 1.2D
x y z x y z x y z
Along East Edge .052 .658 -4.90 .070 .867 -6.37 .018 .209 -1.47 Along West Edge .097 .045 -2.38 .125 .058 -3.09 .028 .013 -.71
5.4 Dynamic Analysis
5.4.1 Response to Wind Loading
Wind excitation is modeled as a ramp force within a period of one second acting
vertically on the structure. Maximum member stresses, global deflection, and modal
responses are to be obtained from computer outputs and are tabulated in Tables 5-3 and
5-4. These results are used to compare to those from other type of dynamic loading in a
The modal response to wind excitation is found to be Twind = 0.2827 sec., which is very low compared to a typical gust wind period of 5-6 sec. This indicates that the truss natural period is not only lower than the wind excitation period, but is also lower than a
reasonable range for typical structure of 2-3 seconds. The results in Table 5-4 shows the deflection now is under control, thus the beam stiffness becomes primary concern. At
high frequency, the structure may cause discomfort for occupants and possible
unexpected structural failures.
Table 5-3: Maximum Element Stress due to Wind Load (ksi).
Area Length Tension Comp. Stress (ksi) (in2) (in) (kips) (kips) Tensile Comp.
Horizontal member 5.47 72 106.6 81.9 19.49 14.97
Diagonal member 2.66 88.18 27.92 22.4 10.50 8.42
Diagonal member at cable connection 5.47 88.18 69.22 - 12.65
Table 5-4: Maximum Global Deflection due to Wind Load (in).
Deflection due to Deflection due to Deflection due to
1.2D 1.2D + 1.6S 1.6S after 1.2D
x y z x y z x y z
Along East Edge .052 .658 -4.90 .123 .715 -5.78 .071 .057 -.88 Along West Edge .097 .045 -2.38 .129 .061 -3.09 .320 .016 -.71
5.4.2 Response to Lateral and Excitation Loading
For dynamic analysis purpose, SAP2000 program uses total mass from the whole structure to generate frequencies and modes. The analysis uses the available El Centro earthquake's time-history function for simulation. Because its magnitude seems excessive for the location of the subject building, the ground acceleration is adjusted accordingly. However, there is no available method to convert the data properly. This analysis assumes the method used by UBC in calculating elastic seismic coefficient Ce:
where Z, I, and C are zone factor, important factor
C = ZIC =
g and numerical coefficient.
In this case, only zone factor Z can be adjusted for location specific from 0.4 for
California to 0.15 for Massachusetts (UBC). This translates to CelMass. = .375(Celcalif).
Though this estimation is not accurate, it provides a rough value for the dynamic analysis.
Only the first five response modes are considered. Maximum member stresses, maximum global deflection, and modal periods are recorded in Tables 5-5 to 5-7 below.
Note that the deflection in far right column in Table 5-6 is the maximum value due to
1.6S only, after the roof is completely installed. Plots of modal response are attached in
Appendix 5 for reference.
Table 5-5: Maximum Element Stress due to Lateral Excitation (ksi).
Area Length Tension Comp. Stress (ksi) (in2) (in) (kips) (kips) Tensile Comp.
Horizontal member 5.47 72 81.09 58.93 14.82 10.77
Diagonal member 2.66 88.18 39.38 37.88 14.81 14.24
Diagonal member at cable connection 5.47 88.18 54.32 - 9.93
-Table 5-6: Maximum Global Deflection due to Lateral Excitation (in). Deflection due to Deflection due to Deflection due to
1.2D 1.2D + 1.6S 1.6S after 1.2D
X Y z x y z x y z
Along East Edge -.015 .340 -2.93 -.026 .593 -4.87 -.011 .253 -1.94 Along West Edge .053 .230 -1.29 .089 .038 -2.30 .036 .192 -1.01
Table 5-7: Modal period of structure due to Lateral Excitation (sec).
Mode 1 2 3 4 5
5.5 Stability
The structure is modeled as an equivalent beam-column for a check of global
buckling. The vertical force acting on the beam-column is calculated from 1.2D+1.6S.
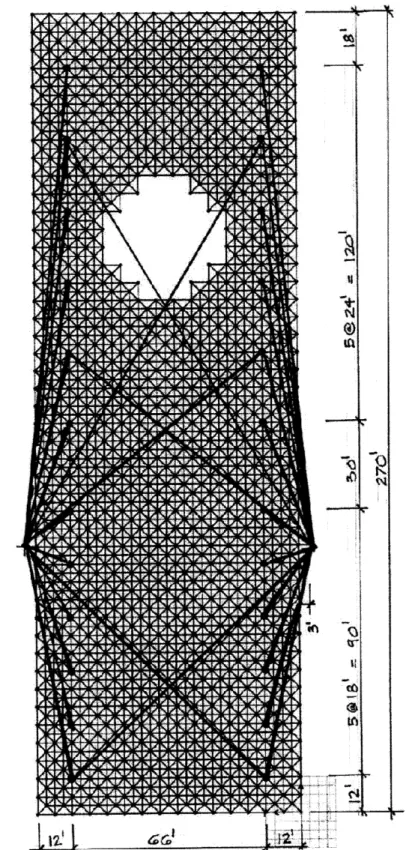
The axial force in the beam, shown in Figure 5-2, is from spring forces in x-direction obtained from computer outputs. For simplicity, only buckling along the longitudinal direction is analyzed. Buckling along the transverse direction is not significant due to a reasonably small distance between supports and small axial forces to resist springs. Refer to Appendix 5 for spring force output and buckling calculation.
.. ..A .- %_
Figure 5-2: Axial loading diagram along longitudinal direction.
Interaction of bending and axial force for beam-column:
-" 8-x <U !! 1.0, where 0=.85, () b =.9 P. 9 bMn a
Chapter
6
DESIGN
OPTIMIZATION
6.1 Optimization Methodology
The purpose of optimization is to take advantage of the cable-stayed beam
characteristics in order to obtain a uniform force distribution thus a uniform deformation
in the space truss, which is considered as a "beam". In such model, vertical stiffness of
cable and bending stiffness of the beam interact with each other to resist the applied
force. The magnitude of moment in the beam is determined by the relative stiffnesses of
these two structural elements. When the vertical cable stiffness increases, moment in the
beam decreases. The next few sections examine how changing in cable stiffness affects
the cable as well as truss element sizes. The diagram below illustrates the methodology of
design optimization process.
Preliminary Design
Optimization Design of Sustaining Cables
Adjust Truss Members Accordingly
Static Analysis:
* Load case 1.2D+1.6L
* Influence line
0 --
~c-Dynamic Analysis:
* Vertical Loading (Wind)
6.1.1 Optimization Design of Sustaining Cable System
In order to take advantage of the cable-stayed scheme, a relative stiffness
relationship between cable and truss is established using beam on elastic foundation
approach with the space truss as "beam" and a set of cables as "elastic foundation" with
stiffness as cable vertical stiffness. An iteration process of the new stiffness determines
the new reasonable size of cables and truss elements.
Basic model for cable-stayed beam analysis is as shown below:
A
P
B VB
kc
From this approach, the relationship is established as:
1 kc x v 3E 1 P
1+ x
1 L3 k (Equation 6-1)
where ke, L, and EI are cable vertical stiffness, beam length, and bending rigidity,
respectively.
A maximum deflection of 2 inches is used to determine vertical stiffness of
cables. This stiffness is modified once more taking into account of sagging due to
self-weight and pre-stress in cables. The corrected cable stiffness with sagging and pre-stress
becomes: AEL
k=
1 AE (wa cosL L2 (Equation 6-2)
1l+-x- x
12 T T
where AE, Wa, L, T, and 0 are cable axial stiffness, self-weight, length, pre-stress, and
Once the optimized cable vertical stiffness is calculated, the size of truss elements
is modified based on the relationship given Equation 6-1. Tables 6-1 and 6-2 below
compare the optimized properties to those obtained in preliminary design phase.
Table 6-1: Update Cable Sizes.
Cable 1 Cable 2-7 Cable 8-9 Cable 10-11 Cable 12 Prelim Opt Prelim Opt Prelim Opt Prelim Opt Prelim Opt Dia. (in) 2.52 2 2.52 1.50 3.57 2.50 3.57 3.50 3.57 4.25
Area (in) 5 3.14 5 1.77 10 4.91 10 9.60 10 14.20
Note: See Appendix 6 for detailed calculation.
Table 6-2: Update Member Section Properties.
Type Outside 0 (in) Wall thickness (in) Area (in2) Moment of Inertia (in4)
Prelim Opt Prelim Opt Prelim Opt Prelim Opt
1 2.375 1.90 .436 .200 2.66 1.07 1.31 .391
2 3.5 2.875 .6 .552 5.47 4.03 5.99 2.87
3 3.5 .6 5.47- 5.99
6.1.2 Updated SAP2000 Model
Besides the change in cable and truss member sizes above, the following
modifications are applied to the SAP2000 model to reflect a more accurate structural
behavior of the entire roof system:
* Including lateral resistance cable system above the roof. Lateral resistance cables
provided under the roof structure is not considered, because of its insignificance
contribution compared to those provided above the roof.
* Including lateral stiffness of masts both in longitudinal and transverse directions.
* Considering cable stiffness distribution to truss using the beam on elastic foundation
The following Table 6-3 lists update equivalent spring stiffness applied to
SAP2000 model, including lateral resistance cable system and lateral stiffness from
masts. Lateral resistance cables are assumed to have the same properties as sustaining
cable at each particular location on the roof. Therefore, Sust-l is similar to Cable number
1; Sust-2 and Sust-3 are similar to Cable number 8 and 11, respectively. Equivalent
lateral stiffnesses in x- and y-direction from masts calculated in section 4.1 are applied to
16 joints connecting supporting girder and space truss.
Table 6-3: Optimized Equivalent Spring Stiffness.
Cable no Joint L Joint R E (ksi) Area (in2) x y z L K (kip/in) kx ky kz 1 124 42 29000 3.14 78 15 50 93.9 80.9 67.2 12.9 43.1 2 140 210 29000 1.77 60 15 50 79.5 53.8 40.6 10.1 33.8 3 145 223 29000 1.77 42 15 50 67.0 63.8 40.0 14.3 47.6 4 170 394 29000 1.77 24 15 50 57.5 74.5 31.1 19.4 64.8 5 197 435 29000 1.77 6 15 50 52.5 81.4 9.3 23.2 77.5 6 898 582 29000 1.77 12 15 50 53.6 79.9 17.9 22.4 74.5 7 1226 635 29000 1.77 42 15 50 67.0 63.8 40.0 14.3 47.6 8 1292 799 29000 4.91 66 15 50 84.1 141.0 110.6 25.1 83.8 9 1354 835 29000 4.91 90 15 50 104.0 114.0 98.7 16.4 54.8 10 1383 999 29000 9.60 114 15 50 125.4 185.0 168.2 22.1 73.8 11 1405 1035 29000 9.60 138 15 50 147.5 157.2 147.1 16.0 53.3 12 1431 1199 29000 14.20 162 15 50 170.2 201.6 191.9 17.8 59.2 Sust-1 124 42 29000 3.14 78 81 50 123.1 61.7 39.1 40.6 25.1 Sust-2 1292 799 29000 3.14 66 81 50 115.8 102.4 58.4 71.6 44.2 Sust-3 1405 1035 29000 3.14 138 81 50 147.5 157.2 147.1 16.0 53.3 6.2 Static Analysis
6.2.1 Update Bending Rigidity DB
A unit load is applied on SAP2000 model with two simple end supports similar to
section 5.1. The vertical deflection is then recorded to calculate the truss bending rigidity. DB = El = 22.98x10⁶ kips-in2 without springs.
6.2.2 Response due to 1.2DL+1.6S
Although a static analysis is not sufficient in this case, its results are used as a
reference for further analysis. A similar procedure is followed as in preliminary design
stage except for the updated SAP2000 model. Maximum element stresses and global
deflections are tabulated in Tables 6-4 and 6-5.
Table 6-4: Maximum Element Stresses (ksi).
Area (in2) Length Tension Comp. Stress (ksi) (in) (kips) (kips) Tensile Comp.
Horizontal member 4.03 72 110.59 96.67 27.44 23.99
Diagonal member 1.07 88.18 30.38 27.33 28.39 25.54
Diagonal member at connection 5.47 88.18 120.09 113.10 21.95 20.68
Table 6-5: Maximum Global Deflection (in).
Deflection due to Deflection due to Deflection due to
1.2D 1.2D + 1.6S 1.6S after 1.2D
x y z x y z x y z
Along East Edge .093 .310 -3.48 .123 .408 -4.52 .030 .098 -1.04 Along West Edge .111 -.027 -2.93 .144 -.035 -3.81 .033 -.008 .880
6.2.3 Response using Influence Line
To be conservative in design, the influence line is considered for the case of only
one side of the roof loaded with snow load inducing imbalance in the structure. Under
this condition, the primary concern is the global deflection at furthest end of the structure
of the loaded side. The following table summarizes the computer output compared to that
due to 1.2DL+1.6S.
Table 6-6: Maximum Global Deflection using Influence Line (in).
Deflection due to Deflection due to Deflection due to
1.2D 1.2D + 1.6S 1.6S after 1.2D
x y z x y z x y z
Along East Edge .093 .310 -3.48 .129 .437 -4.68 .036 .127 -1.20 Along West Edge .111 -.027 -2.93 .125 -.029 -2.24 .014 -.005 -.69
6.3 Dynamic Analysis
6.3.1 Response to Vertical Loading
Wind is the primary consideration for vertical excitation loading case. An impulse
load representing a wind gust is applied in the vertical direction. The impulse load
magnitude is approximated as the suction pressure induced by wind on a flat roof
calculated according to the Uniform Building Code.
The first two outputs of concern of this loading are the maximum element stress and maximum global deflection. Next, the response modal period of Twind = .2601 second is compared to the gust period, which is conservatively estimated about 5-6 seconds. These outputs are summarized in Tables 6-7 to 6-8.
Table 6-7: Maximum Element Stress due to Wind Excitation (ksi).
Area Length Tension Comp. Stress (ksi) (in2) (in) (kips) (kips) Tensile Comp.
Horizontal member 4.03 72 112 98.38 27.79 24.41
Diagonal member 1.07 88.18 35.97 32.46 33.62 30.36
Diagonal member at connection 5.47 88.18 161.65 105.49 29.55 19.3
Table 6-8: Maximum Global Deflection due to Wind Excitation (in).
Deflection due to Deflection due to Deflection due to
1.2D 1.2D + 1.6S 1.6S after 1.2D
x y z x y z x y z
Along East Edge .093 .310 -3.48 .412 .852 -4.23 .319 .542 -.75 Along West Edge .111 -.027 -2.93 .155 -.082 -3.83 .044 -.055 -.90
6.3.2 Response to Lateral Loading
A scaled El Centro earthquake's time-history function is again used for simulation
of the optimized cable-stayed system. Tables 6-9 to 6-11 summarize computer outputs of
maximum member stresses, global deflections, and modal periods. Refer to Appendix 6
for output graphs depicting axial forces and displacements of representative members and
joints.
Table 6-9: Maximum Element Stress due to Lateral Excitation (ksi).
Area Length Tension Comp. Stress (ksi) (in2) (in) (kips) (kips) Tensile Comp.
Horizontal member 4.03 72 89.2 57.3 22.13 14.22
Diagonal member 1.07 88.18 13.3 26.7 12.41 24.95
Diagonal member at connection 5.47 88.18 149.5 128.5 27.33 23.49
Table 6-10: Maximum Global Deflection due to Lateral Excitation (in). Deflection due to Deflection due to Deflection due to 1.2D Lateral Excitation 1.6S after 1.2D
x y z x y z x y z
Joint 310 .093 .310 -3.48 -5.59 -2.11
Joint 1307 .111 -.027 -2.93 -- 4.58 -1.65
Only z-direction is considered, x- and y-direction are insignificant.
Table 6-11: Modal period of structure due to Lateral Excitation (sec).
Mode 1 2 3 4 5
Period .9320 .3025 .2601 .2429 .2024
6.4 Stability
An analysis for stability similar to section 5.5 is performed with new axial forces exerting on the space truss. The result from section 5.5 shows that despite some changes in design optimization stage, instability of the entire space truss is very unlikely.
Therefore further analysis is not necessary.
6.5 Summary
The table below compares the results using SAP2000 model under different
loading conditions in optimization design stage. The summary only lists the two most
critical joints at two ends of truss and the most five frame elements often sustain the
maximum stress.
Table 6-12: Summary of Maximum Member Stress and Global Deflection.
Static case 1.2D+1.6S Dynamic Wind Loading Dynamic Lateral Excitation Axial Axial Max. Axial Axial Max. Axial Axial Max. Force Stress Deform. Force Stress Def. Force Stress Def.
Joint 310 -.88 -.75 -2.11 Joint 1307 -1.04 -.90 -1.65 Frame 1604 110.59 27.44 112.00 27.79 89.20 22.13 Frame 4298 30.38 28.39 35.95 33.62 13.30 12.41 Frame 4301 27.33 25.54 32.46 30.36 26.70 24.95 Frame 4580 113.10 20.68 105.49 19.30 128.50 23.49 Frame 4582 120.09 21.96 161.65 29.55 149.50 27.33
Chapter
7
MOTION CONTROL
Because of the complexity of the structural system, a more sophisticated and
thorough analytical procedure should be used to determine precisely the structure's behaviors. Although the results from design optimization stage in previous chapters seem
satisfactory, controlling the motion of the entire system is extremely important. The
purpose of this chapter is to look at how this structural system behaves under motion control. A tuned mass damper is included in the computer model subjected to wind loading and lateral excitation. The results are compared to those of the same model under similar loading condition without damping.
7.1 Model with Damping
A tuned mass damper (TMD) is introduced into the system to achieve an
equivalent damping ratio of 5%. A simple calculation for the damper necessary for TMD is calculated in Appendix 7. In SAP2000 computer model, such damping is applied to
generate the outputs for the both dynamic loading cases.
7.2 Results
Table 7-1: Maximum Element Stress due to Lateral Excitation with 5% damping (ksi). Area Length Tension Comp. Stress (ksi)
(in2) (in) (kips) (kips) Tensile Comp.
Horizontal member 4.03 72 35.5 39.7 8.81 9.85
Diagonal member 1.07 88.18 12.6 12.8 11.78 11.96
Table 7-2: Comparison of Global Deflection due to Lateral Excitation (in).
Deflection due to 1.6S after 1.2D Deflection due to 1.6S after 1.2D Difference without damping with 5% damping
z
_z
AzJoint 310 -5.59 -1.90 3.69
Joint 1307 -4.58 -3.40 1.18
7.3 Evaluation
Results from Tables 7-1 and 7-2 indicate both the member stress and the
deflection of the structure decrease upon introducing a damper into the system. This
proves that using of damper is very advantageous in such structure. The scope of this
thesis is to observe how the structure behaves under damping. A further analysis should
be carried out to be able to assess how beneficial the damper actually is. This study
should include the location of TMD within the structure, the design of the device to
Chapters
SUGGESTIONS
FOR FURTHER
STUDY
8.1 Complete Model
A complete spatial model is strongly advised to fully understand the complex
behavior of the cable-stayed space truss roof. The analysis carried out in this thesis rather
looks at separate structure element of the system. Therefore it did not take into
considerations the interaction between elements. First, between masts and cables, the
lateral deflection at cable connection point on top of mast will likely change the stress in
cables. Second, lateral bending and torsion stiffness of girders connecting two masts
above the truss may influence the global response.
8.2 Stability of Complete Structural System
With a complete model, one can discover more instability modes of the system.
This paper only looks at the torsion of the space truss itself, while several other modes
are predicted. For instance, rotational movement in the horizontal plane of the space truss
will twist the pair of masts and thus induces torsion in the masts.
Another possible stability problem is when the space truss twists out-of-plane. In
such event, it may cause uplifting of the masts about either transverse or longitudinal
One last concern of stability is the releasing of pre-stress in cables in the case
where the roof is uplifted or deflects upward.
8.3 Aerodynamic Effect
An airfoil of the roof due to wind should be established to study any possible
uplifting. The space truss will be essentially boxed to prevent weathering and corrosion.
Only a few tetrahedral modules around the edge are left open to reduce this aerodynamic
effect. Under certain angle of attack, an uplift force may occur and causes instability in
the system such as twisting out-of-plane.
a: angle of attack
8.4 Experiment in Wind Tunnel
With many uncertainties in computerized analysis, a model under wind tunnel
testing is certainly helpful. Though this process is expensive, it assists in understanding
better the complete behavior of the cable-stayed truss in general, and will be an
interesting case study for a field that still lacks research. The result can also be used for
8.4 Connections between Structural Elements
The load transferred between these structural elements is considerably large. By
far, all connections between masts and cables, mast girder and truss, or truss and cables
are assumed to be pins. Such connections are as important and can be a challenge for its
size and design configuration.
Cables are arranged in "bundle" configuration. All cables meet at one location on
the mast. A finite element method analysis is necessary to assess the required material
strength to prevent crack growth, deterioration in materials, and fatigue.
Beam connecting the pair of mast and partially supporting the space truss roof
may either assist or alter the behavior of the truss. Again, the primary concern in this
design problem is the global defection of the truss. A more complete computer model or a
model with wind tunnel may be able to investigate this behavior.
8.5 Others
* Relative extension under heat on the top of the roof during daytime may increase
pre-stressed in these members.
Chapter
9
E VALUAT 10 N
Since available information about the actual cost of construction as well as
maintenance of this type of structure is limited, this thesis is only looking into how the
optimization would impact the overall material cost.
Assume that the unit weight of A53 steel used for space truss element is y, the
weight of material saved upon optimization totals:
* Member type 1: 3043 units x (2.66-1.07)in2 x 88.18in x y = 188.6(y)
* Member type 2: 1786 units x (5.47-4.03)in2 x 72in x y = 107.1(y)
* Member type 3: same as prior to optimization.
Total weight saved on truss: W,= 295.7(y) = 295.7(490 lb/ft3) = 145 k The weight saved upon adjusting cable size in design optimization phase:
Wc = 24.08(y) = 24.08(490 lb/ft3) = 11.8 k Net weight saved: Wtotat-save = 156.8 k ----Prior to optimization: Wtruss-prel = 365 k and Wcable-prel = 55.8 k
Initial net weight: Wtotal-prel = 420.8 k
----Percentage of weight saved: %W - Wat-save - 37% total-prel