HAL Id: hal-00078869
https://hal.archives-ouvertes.fr/hal-00078869
Preprint submitted on 7 Jun 2006
HAL is a multi-disciplinary open access
archive for the deposit and dissemination of
sci-entific research documents, whether they are
pub-lished or not. The documents may come from
teaching and research institutions in France or
abroad, or from public or private research centers.
L’archive ouverte pluridisciplinaire HAL, est
destinée au dépôt et à la diffusion de documents
scientifiques de niveau recherche, publiés ou non,
émanant des établissements d’enseignement et de
recherche français ou étrangers, des laboratoires
publics ou privés.
The distribution of ND2H in LDN1689N
Maryvonne Gerin, Dariuscz Lis, Sabine Philipp, Rolf Güsten, Evelyne Roueff,
Vincent Reveret
To cite this version:
Maryvonne Gerin, Dariuscz Lis, Sabine Philipp, Rolf Güsten, Evelyne Roueff, et al.. The distribution
of ND2H in LDN1689N. 2006. �hal-00078869�
ccsd-00078869, version 1 - 7 Jun 2006
June 7, 2006
The distribution of ND
2
H in LDN1689N
M. Gerin
1, D.C. Lis
2, S. Philipp
3, R. G ¨usten
3, E. Roueff
4, and V. Reveret
51 LERMA, CNRS UMR8112, Observatoire de Paris and ENS , 24 Rue Lhomond, 75231 Paris cedex 05 France, e-mail: gerin@lra.ens.fr 2 California Institute of Technology, MC 320-47, Pasadena, CA 91125 , USA, e-mail: dcl@submm.caltech.edu
3 Max Planck Institut f¨ur Radioastronomie, Auf dem H¨ugel 69, Bonn, Germany, e-mail: philipp,guesten@mpifr-bonn.mpg.de
4 LUTH, CNRS UMR8102, Observatoire de Paris and Universit´e Paris 7, Place J. Janssen, 92190 Meudon, France , e-mail:
evelyne.roueff@obspm.fr
5 European Southern Observatory, Casilla 19001, Santiago 19, Chile, e-mail: vreveret@eso.org
Received 10 April 2006 / Accepted 01 June 2006
ABSTRACT
Aims.Finding tracers of the innermost regions of prestellar cores is important for understanding their chemical and dynamical evolution before the onset of gravitational collapse. While classical molecular tracers, such as CO and CS, have been shown to be strongly depleted in cold, dense gas by condensation on grain mantles, it has been a subject of discussion to what extent nitrogen-bearing species, such as ammonia, are affected by this process. As deuterium fractionation is efficient in cold, dense gas, deuterated species are excellent tracers of prestellar cores. A comparison of the spatial distribution of neutral and ionized deuterated species with the dust continuum emission can thus provide important insights into the physical and chemical structure of such regions.
Methods.We study the spatial distribution of the ground-state 335.5 GHz line of ND2H in LDN1689N, using APEX, and compare it with the
distribution of the DCO+(3–2) line, as well as the 350 µm dust continuum emission observed with the SHARC II bolometer camera at CSO. Results. While the distribution of the ND2H emission in LDN1689N is generally similar to that of the 350 µm dust continuum
emis-sion, the peak of the ND2H emission is offset by ∼10′′ to the East from the dust continuum and DCO+ emission peak. ND2H and ND3
share the same spatial distribution. The observed offset between the ND2H and DCO+ emission is consistent with the hypothesis that
the deuterium peak in LDN1689N is an interaction region between the outflow shock from IRAS16293–2422 and the dense ambient gas. We detect the J = 4 → 3 line of H13CO+at 346.998 GHz in the image side band serendipitously. This line shows the same spatial
distribution as DCO+(3–2), and peaks close to the 350 µm emission maximum which provides further support for the shock interaction scenario.
Key words.Interstellar medium – molecules – individual objects : LDN1689N
1. Introduction
Deuteration of nitrogen compounds, such as ammonia and N2H+, is spectacular in a number of environments including
dark clouds, such as L134N (Tin´e et al. 2000; Roueff et al. 2000; Roueff et al. 2005), low-mass star forming regions and prestellar cores such as LDN1689N and Barnard 1 (Loinard et al. 2001; Gerin et al. 2001; Lis et al. 2002a). The discussion of the respective contributions of grain and gas-phase processes in the deuteration is active, but no definite solution is yet avail-able. The lack of detection of deuterated water in ices toward low-mass young stellar objects (YSOs) by Dartois et al. (2003) and Parise et al. (2003) suggests that “another mechanism than pure solid state chemistry may be active to produce very high deuterium enrichment in the gas phase.”
Further constraints on the deuterium fractionation mech-anisms are provided by the spatial distribution of deuterated species, as compared with the molecular gas distribution traced
Send offprint requests to: M. Gerin
by the submillimeter dust continuum emission. Whereas maps of singly deuterated species have been published in many cores — the relatively large line intensities of e.g. DCO+, N2D+
al-low easy mapping with state of the art detectors — mapping multiply deuterated species has proven to be a challenge, given the relatively low line intensities. Ceccarelli et al. (2001) have shown that the D2CO emission is extended around the class
0 protostar IRAS16293–2422. Roueff et al. (2005) present a limited map of the ND3 ground-state transition at 309 GHz
with the CSO in LDN1689N, which unfortunately suffers from rather poor pointing accuracy. Because the ground state ND2H
10,1−00,0lines, at 335.5 for the ortho species and 335.4 GHz for
the para species (See Coudert and Roueff (2006) for NH3and
its isotopologues line frequencies), are relatively strong (0.6 K in LDN1689N; Lis et al. 2006) and the atmospheric transmis-sion is good at this frequency, we have carried out the first map of a doubly deuterated species in a dense core.
2 M. Gerin et al.: The distribution of ND2H in LDN1689N 2. Observations
The observations have been carried out using the APEX-2a 350 GHz receiver of the Atacama Pathfinder Experiment (APEX 1). We combined data obtained during two periods,
August 2005 and October 2005. The receiver was tuned in DSB with the ND2H lines in the lower sideband. The
back-end was the facility MPIfR Fast Fourier Spectrometer. We ob-served a total of 10 positions towards LDN1689N (α2000 =
16:32:29.470, δ2000= –24:28:52.60). The pointing was checked
regularly and found accuracte to ∼ 2 − 3′′. The observations
have been taken in the position-switched mode with a refer-ence position located 240′′ East of the source for the August
2005 data. The October 2005 data have been taken with a ref-erence position offset by 10′in azimuth. Line and continuum
maps shown in Lis et al. (2002b) and Stark et al. (2004) show that the source emission rapidly drops towards the East.
The data have been corrected for the sideband gain and the APEX main beam efficiency of 0.7 at 335 GHz. The tem-perature scale used in this paper is the main beam brightness temperature scale. Overall, the data calibration agree well with the CSO spectrum presented by Lis et al. (2006). The FWHM beam size of APEX is 18′′at 335.5 GHz.
3. Results
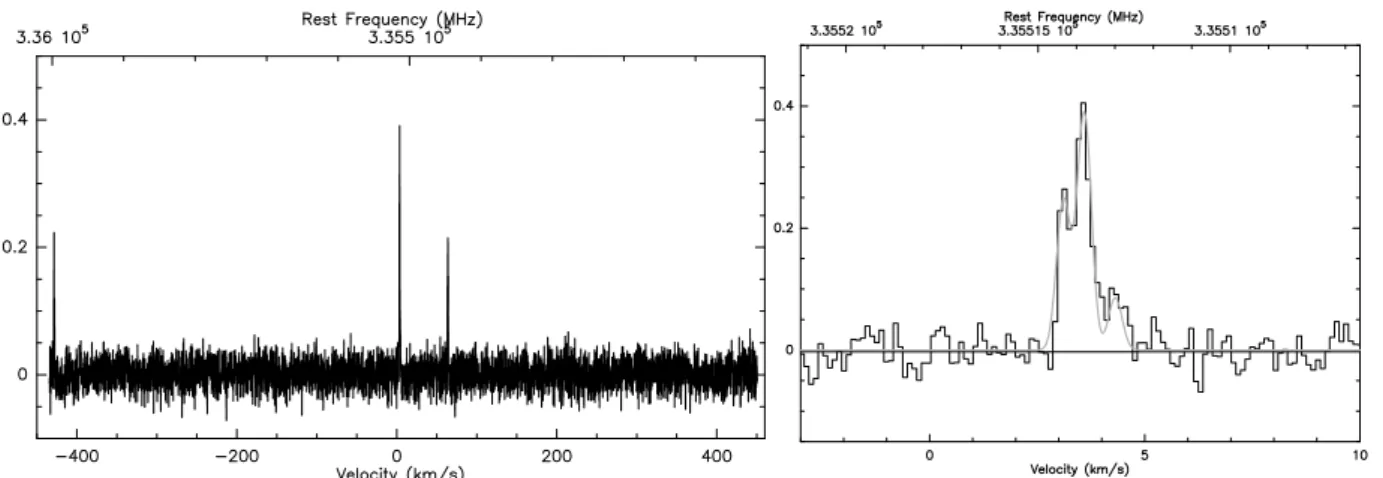
Fig. 1 shows the average spectrum integrated over the map, while contour maps are shown in Fig. 2. The ortho- and para-ND2H(111−000) lines are clearly detected with a mean intensity
ratio of 2:1, reproducing the ortho-to-para statistical weight ra-tio (Lis et al. 2006). We have also detected the H13CO+(4–3)
line at 346.998 GHz in the image side band, which is discussed below.
3.1. ND2H spatial distribution
Fig. 2 shows contours of the main ND2H emission at 335.5
GHz (in white) overlayed over a 350 µm continuum image. The ND2H emission is clearly extended and shows an
elon-gated shape generally similar to the dust continuum emission. The limited ND3map shown by Roueff et al. (2005) shows the
same elongated pattern. Over the limited extend of the ND2H
map, the line and continuum emissions are positively correlated with a correlation coefficient of 0.29. This rather weak correla-tion is due to the difference in peak posicorrela-tions of the ND2H line
emission with respect to the continuum peak, the ND2H
emis-sion beeing offset by ∼10′′to the East of the dust contimuum emission maximum. This offset far exceeds the pointing uncer-tainties (∼2 − 3′′).
The right panel in Fig. 2 shows an overlay of the ND2H
con-tours on a DCO+(3–2) map (Lis et al. 2002b). The ND
2H peak
is clearly offset from the DCO+ peak too. D
2CO (Ceccarelli
et al. 2000), ND3 (Roueff et al. 2005), ND2H (Loinard et
al. 2001, Roueff et al. 2005), DCO+ (Lis et al; 2002b), all
1 This publication is based on data acquired with the Atacama
Pathfinder Experiment (APEX). APEX is a collaboration between the Max-Planck-Institut f¨ur Radioastronomie, the European Southern Observatory and the Onsala Space Observatory.
appear at a blueshifted velocity compared to the cloud en-velope : VLS R = 3.4 – 3.6 kms−1 versus VLS R = 3.8 – 4.0
kms−1 for C18O and C17O (Stark et al. 2004). This velocity difference was first recognized by Lis et al. (2002b) who sug-gested that it results from the shock interaction of the power-ful blue lobe of the IRAS16293-2422 outflow with the dense core. The blue lobe of the molecular outflow is interacting and compressing LDN1689N, creating dense and cold post-shock gas, blueshifted relative to the cloud envelope. The deuterated species preferably sample this cold and dense material as deu-terium fractionation is more efficient at low temperatures and high gas densities. The large-scale CO and continuum maps presented by Lis et al. (2002b) and Stark et al. (2004) present convincing evidence for this scenario.
The spatial offset between DCO+and ND
2H provides
ad-ditional support for the C-shock hypothesis. The DCO+ ion
is detected ahead of the neutral species ND2H, closer to
IRAS16293-2422. The spatial separation, 10′′, or ∼0.01 pc, is
consistent with C-shock models with a pre-shock density of 104cm−3and a magnetic field of 30 µG (Lesaffre et al. 2004),
which predict a total shock size of 0.04 pc. The deuterium chemistry in shocks has been previously studied by Pineau des Forˆets et al. (1989) and Bergin et al. (1999) in different con-texts. Because of the sensitivity of deuterium fractionation to both the gas temperature and the molecular depletion, it is ex-pected that DCO+ will be reformed more rapidly than ND
2H
in the post-shock gas. While DCO+ is formed as soon as the
gas temperature drops, efficient ND2H formation requires both
cold temperatures and significant CO depletions, which are ex-pected to occur downstream (Bergin et al. 1999). A spatial off-set could therefore exist between abundance peaks of DCO+
and ND2H, as we have detected. More detailed shock models,
would be able to further test the validity of this scenario.
3.2. ND2H abundance
We have fitted the ND2H spectra using the hyperfine fitting
command in CLASS. Although the signal-to-noise ratio is not high enough for securely deriving the line opacity at all posi-tions, it is clear that the maximum opacity coincides with the maximum signal. The opacity derived for the average of all positions excluding (10′′,0′′) is 0.2 ± 0.48, and the correspond-ing excitation temperature is 8 ± 3 K, in good agreement with Lis et al. (2006). The spectra show some indication of higher line opacity, and lower excitation temperature (τ = 3.11 ± 1.5;
Tex = 5 ± 1 towards the two positions with highest intensities
(0,-10′′) and (0,-20′′).
The ND2H column densities have been derived assuming
optically thin emission, LTE and using a uniform excitation temperature of 5 K. They are listed, together with the H2
col-umn density derived from dust continuum measurements in Table 1. We use the 350 µm dust continuum map obtained with SHARC II at the CSO (Fig. 2), and a a dust opacity of κ350 = 0.07 cm2g−1 corresponding to κ1300 = 0.005 cm2g−1
(Ossenkopf & Henning 1994) for a dust emissivity index β = 2, and a dust temperature of 16 K (Stark et al. 2004). The 350 µm continuum fluxes are in fair agreement with the values reported
Fig. 1. Left : Full spectrum averaged over the map. p-ND2H(111−000) at 335.446 GHz, o-ND2H(111−000) at 335.514 GHz and
H13CO+(4–3) at 346.998 GHz (in the image side band) are detected. Right : Enlargement showing a fit of the hyperfine structure
of the o-ND2H line. The temperature scale is Tmb(K) and the velocity scale is relative to the LSR.
Fig. 2. Left: Color image of the 350 µm dust continuum emission obtained with SHARC II at the CSO, convolved to 20′′angular
resolution. The intensity scale is given in Jy/beam. White contours show the integrated intensity of the o-ND2H line at 335.5 GHz,
with contour levels from 0.25 to 0.45 Kkms−1 with 0.05 Kkms−1 spacing. Black contours show the integrated intensity of the H13CO+(4–3) line at 346.998 GHz, with contour levels from 0.25 to 0.87 Kkms−1with 0.125 Kkms−1spacing. The map center is α2000= 16:32:29.470, δ2000= -24:28:52.60. Right: The same contours plotted on a DCO+(3–2) map (Lis et al. 2002b).
by Stark et al. (2004), but on the lower side: we detect a max-imum intensity of 16 Jy in a 20” beam, to be compared with 19.4 ± 2.3 Jy in Stark et al. (2004). This dicrepancy may be an indication that some low-level entended emission is filtered out in the SHARC II image, which has been obtained in the “AC-biased mode”, without the secondary chopper. The result-ing H2column densities reported in Table 1 could therefore be
affected by this 35% uncertainty.
The H2 column density ranges from 3.1 × 1022 cm−2 to
7.2×1022cm−2across the map. The corresponding ND
2H
abun-dances varies from 0.7 × 10⁻⁹to 2.6 × 10⁻⁹relative to H 2, with
a mean value of 1.8 × 10⁻⁹, in good agreement with previous
work (Lis et al. 2006). ND2H appears to be remarkably
abun-dant in this dense core. For the three positions where reliable ND3 data exist (Roueff et al. 2005), the [ND3]/[ND2H]
abun-dance ratio is 0.01 – 0.02, and seems to increase with increasing ND2H column density.
3.3. H13CO+
A relatively strong line is detected at the lower end of the ve-locity range in Fig. 1. Careful tests have been performed using the CSO and APEX telescopes for identifying this line. It turns out that the line can be assigned to the J = 4 → 3
transi-4 M. Gerin et al.: The distribution of ND2H in LDN1689N Table 1. Position V δV N(ND2H)1 N(ND3)2 N(H2)3 (arcsec) kms−1 kms−1 1013cm−2 1012cm−2 1022cm−2 -10,10 3.63 ± 0.02 0.33 ± 0.03 9.8 ± 2 4.1 ± .5 10,0 3.53 ± 0.02 0.20 ± 0.07 3.6 ± 1 3.1 ± .5 0,0 3.56 ± 0.02 0.40 ± 0.05 12.7 ± 2 1.5 5.1 ± .5 -10,0 3.62 ± 0.02 0.39 ± 0.05 10.0 ± 2 5.9 ± .5 -20,0 3.75 ± 0.1 0.8 ± 0.3 8.9 ± 2 5.4 ± .5 0, -10 3.60 ± 0.02 0.30 ± 0.05 15.8 ± 2 5.8 ± .5 -10,-10 3.70 ± 0.05 0.55 ± 0.1 11.7 ± 2 1.8 7.1 ± .5 -20,-10 3.55 ± 0.02 0.26 ± 0.05 4.6 ± 1 5.7 ± .5 0,-20 3.69 ± 0.02 0.45 ± 0.06 12.7 ± 2 2.6 5.2 ± .5 -10,-20 3.72 ± 0.03 0.58 ± 0.08 8.9 ± 2 6.5 ± .5
1Derived assuming LTE and T
ex= 5 K.2Roueff et al. (2005).3Derived assuming Tdust= 16 K and κ350= 0.07 cm2g−1.
tion of H13CO+at 346.998 GHz seen in the image side band.
At APEX, when the system is tuned to ND2H, the H13CO+line
falls 16MHz outside the 1GHz wide IF band, but is aliased back into the signal band. The band edge IF filter attenuates the line intensity, therefore the correct intensity scale has been estab-lished by comparing the original data with additional measure-ments taken with APEX on May 22nd, 2006 with the H13CO+ line centered in the signal band. The 2005 data have been mul-tiplied by 2.5 to match the properly tuned 2006 data. We have checked that the spatial distributions of H13CO+(4-3) agree
rea-sonably well between both datasets. H13CO+(4–3) has a more
sharply peaked spatial distribution than ND2H (Fig. 2), which
is very similar to the DCO+(3–2) map obtained at the CSO (see
right panel of Fig. 2).
4. Conclusions
1. We show that the ND2H emission is extended in the
LDN1689N dense core. The abundance relative to H2,
de-rived from LTE, is ∼ 1.8 × 10⁻⁹, which makes ND 2H
a remarkably abundant molecule in this dense core. The [ND3]/[ND2H] abundance ratio is 0.01 – 0.02.
2. The ND2H emission is spatially offset from the dust
contin-uum DCO+(3–2) and H13CO+(4–3) emission by ∼ 0.01 pc,
and appears to be blueshifted relative to the cloud envelope. Both findings are qualitatively consistent with the scenario of the formation of the LDN1689N dense core by the inter-action of the blue lobe of the IRAS16293–2422 molecular outflow with the ambient material. Detailed models could further test this scenario.
Acknowledgements. Caltech Submillimeter Observatory is supported
by the U.S. National Science Foundation, grant AST 0540882. We thank the MPG and ESO APEX teams for their support, especially P. Bergman and L.- Å. Nyman.
References
Bergin E.A., Neufeld D.A., Melnick G.J., 1999, ApJ 510, L145. Ceccarelli C., Vastel C., Tielens A.G.G.M., et al., 2000, A&A 381,
L17.
Ceccarelli, C., Loinard, L., Castets, A., Tielens, A. G. G. M., Caux, E., Lefloch, B., Vastel, C., A&A 372, 998.
Coudert L.H., Roueff,E., 2006, A&A 449, 855.
Dartois, E., Thi, W.-F., Geballe, T. R., Deboffle, D., d’Hendecourt, L., van Dishoeck, E., 2003, A&A 399, 1009
Gerin, M., Pearson, J. C., Roueff, E., Falgarone, E., Phillips, T. G., 2001, ApJ 551, L193
Lesaffre P., Chi`eze J.P., Cabrit S., Pineau des Forˆets G., 2004, A&A 427, 147.
Lis, D. C., Roueff, E., Gerin, M., Phillips, T. G., Coudert, L. H., van der Tak, F. F. S., Schilke, P, 2002a, ApJ 571, L55
Lis, D. C., Gerin, M., Phillips, T. G., Motte, F., 2002b, ApJ 569, 322. Lis, D.C., Gerin, M., & Roueff, E. 2006, ApJ 636, 916
Loinard, L., Castets, A., Ceccarelli, C., Caux, E., Tielens, A. G. G. M., 2001, ApJ 552 L163
Parise, B., Simon T., Caux, E., Dartois, E., Ceccarelli, C., Rayner, J., Tielens, A. G. G. M., 2003, A&A 410, 897
Ossenkopf V., Henning T., 1994, A&A 291, 943
Pineau des Forˆets G., Roueff E., Flower D.R., 1989, MNRAS 240, 167.
Roueff, E., Tin´e, S., Coudert, L. H., Pineau des Forˆets, G., Falgarone, E., Gerin, M., A&A 354, L63
Roueff, E., Lis, D. C., van der Tak, F. F. S., Gerin, M., Goldsmith, P. F., 2005, A&A, 438, 585
Stark, R., Sandell, G., Beck, S. C., et al., 2004, ApJ 608, 341 Tin´e, S., Roueff, E., Falgarone, E., Gerin, M., Pineau des Forˆets, G.,
2000, A&A 356, 1039
List of Objects
‘LDN1689N’ on page 4 ‘IRAS16293–2422’ on page 4