HAL Id: halshs-00564710
https://halshs.archives-ouvertes.fr/halshs-00564710
Preprint submitted on 9 Feb 2011
HAL is a multi-disciplinary open access archive for the deposit and dissemination of sci-entific research documents, whether they are pub-lished or not. The documents may come from teaching and research institutions in France or
L’archive ouverte pluridisciplinaire HAL, est destinée au dépôt et à la diffusion de documents scientifiques de niveau recherche, publiés ou non, émanant des établissements d’enseignement et de recherche français ou étrangers, des laboratoires
How Much Market Access in FTAs? Textiles Under
NAFTA
Céline Carrere, Olivier Cadot, Jaime Melo De, Alberto Portugal-Perez
To cite this version:
Céline Carrere, Olivier Cadot, Jaime Melo De, Alberto Portugal-Perez. How Much Market Access in FTAs? Textiles Under NAFTA. 2011. �halshs-00564710�
How Much Market Access in FTAs? Textiles
Under NAFTA
∗
Olivier Cadot
†, Céline Carrère
‡,
Jaime de Melo
§, Alberto Portugal-Pérez
¶May 12, 2005
Abstract
This paper estimates the effective market-access granted under NAFTA in textiles and apparel by combining two approaches. First, we estimate the effect of tariff preferences and rules of origin on the border prices of Mexican final goods exported to the US and of US intermediates exported to Mexico. We find that one third of the es-timated rise in the border price of Mexican apparel products com-pensates for the cost of complying with NAFTA’s rules of origin. We also find that the price of US intermediates exported to Mexico is raised significantly by the presence of rules of origin downstream. Sec-ond, simulations from a structural model inspired byour econometric estimates, suggest little market-access improvement for Mexican ex-porters.
JEL classification: F10, F13, F15
Keywords: NAFTA, Rules of Origin, Regional Integration.
∗This paper is part of a World Bank research project. We thank Patrick Conway and
seminar participants at CERDI and GREQAM for comments on an earlier draft. The findings, interpretations and conclusions expressed in it are entirely those of the authors and do not necessarily reflect the views of the World Bank, its executive directors, or the countries they represent.
†HEC Lausanne, Cepr and Cerdi; e-mail: “[email protected]” ‡HEC Lausanne and Cerdi; e-mail: “[email protected]”
§University of Geneva, Cepr and Cerdi; e-mail: “[email protected]” ¶University of Geneva; e-mail: “[email protected]”
1
Introduction
Two recent developments in the international trading system have attracted increasing attention. First, increased market access for Developing Countries (DCs) has been heralded as key for their successful integration into the world market, and also as a sine qua non condition for successful completion of the Doha “development round” negotiations. Initiated by the GSP in the 1970s, non-reciprocal preferential market access had a recent revival with the EU’s “Everything But Arms” initiative and the US’s Africa Growth and Opportunity Act. In parallel, preferential trading agreements have recently flourished with over 250 currently in operation, over 90% of which are Free Trade Agreements (FTAs) rather than deeper forms of integration.
A number of these FTAs are of the North-South type (e.g. NAFTA, EUROMED, and other preferential schemes under negociation such as the FTAA or the EPAs between the EU and ACP countries). In all cases im-proved market access for Southern partners is a big part of their justification. While it has long been established that, because of trade diversion, preferen-tial market access has ambiguous welfare effects, for those arguing for special and differential treatment in that form (e.g. Hoekman, Michalopoulos and Winters, 2004), the implicit view is that at least part of the rents associated with trade barriers get transferred to DCs.
Notwithstanding the trade-diversion issue, how much market access is really being granted under those arrangements is a matter of debate. Ex-post assessments of the effects of FTAs have concentrated on measuring their impact on trade flows, and have on the whole found quite limited effects.1
One of the primary suspects for the disappointing trade-expansion effects of PTAs is the presence of often stiff Rules of Origin (RoO). RoO constrain the sourcing policies of final-good producers, generating higher input costs as well as administrative compliance costs. Recent studies relying on utilization
1Early ex-post empirical assessments of the effect of PTAs (see e.g. Yeats, 1998) focused
on trade flows rather than prices. Recent studies on how RoO affect market access in PTAs (Estevadeordal, 2000; Anson et al., 2004; Cadot et al., forthcoming) have also focussed on patterns of utilization rates and trade flows. Lack of data on utilization rates has precluded carrying out similar exercices in the case of the EU. However, Brenton and Manchin (2003) and Brenton (2004) have also noted that many exporters from Eastern Europe have preferred to continue exporting under OPT arrangements in spite of presumably greater market access under the FTA. Kala Krishna (2005) summarizes the theoretical ltterature on RoO.
rates of preferences (Estevadeordal, 2000; Anson et al., 2005; Cadot et al., 2004; Carrère and de Melo, 2004) have uncovered evidence of non-negligible compliance costs.
Examining trade flows, however, gives no information on the distribution of the rents generated by trade preferences. In order to make further progress and assess the welfare effects of market access under FTAs, one would want to estimate the effects of preferences on prices rather than quantities or utilization rates.2 This would imply estimating the pass-through of tariff preferences (as first done by Kreinin, 1961), an exercise similar to the familiar estimation of exchange-rate pass-through. A small but growing literature, has recently taken that route.3
Two papers have recently estimated the effects of trade preferences on member-country prices in North-South agreements using the Textile and Ap-parel (T&A) sector, where preferences are typically substantial. Olarreaga and Ozden (2003) looked at AGOA’s effect on the unit values of US apparel imports from Africa, and Ozden and Sharma (2004) explored rent capture by apparel producers from the Caribbean Basin Initiative.4 These papers
2Winters (1997) shows that the welfare effects of a PTA must be assessed on the basis
of price changes, as a reduction in the volume of trade can be associated with an increase in welfare.
3Modelling interaction between member and non-member exporters à la Bertrand,
Chang and Winters (2002) analyzed Mercosur’s effect on the price of member and non-member imports into the Brazilian. They found a combination of Argentine pass-through and/or strategic price cuts by non members.
4Olarreaga and Ozden (2003) calculated unit values using the ITC’s trade value and
volume data disaggregated at the HS-8 level over 2000-2002. Instead of expressing the unit values of African imports relative to those of other sources, they used the fact that US customs report shipments separately by regime claimed (AGOA, MFN or other) to compare AGOA prices with MFN prices for the same good and country. This is possible only when utilization rates are strictly between zero and one (more on this later). The ratio of price increase to tariff preference ranges between 6% for Madagascar and 81% for South Africa, with an export-weighted average of 30%. Olarreaga and Ozden explored further the role of market power by regressing this ratio on an ad-hoc measure of buyer concentration (based on the distribution of garment sales across US ports of entry) and found its effect to be negative and statistically significant. In a similar exercise using the same data source, Ozden and Sharma (2004) explored rent-capture by apparel producers from Caribbean Basin Initiative (CBI) countries. They estimated that CBI countries retained about two thirds of the preference margin and that their ability to retain rents was reduced by competition from Mexico after NAFTA was formed.
find that preferences do translate into higher border prices for preferred ex-porters, although pass-through of the tariff reductions is also substantial (between one-third and one-half).5 However, the premise that higher border
prices imply higher rents for producers is not necessarily true. First, as noted by Olarreaga and Ozden, middlemen in the exporting country may capture part of the increase in the border price, and those middlemen may in fact be large companies based in the importing country. Second, as Ozden and Sharma note in their concluding remarks, part of the border price increase may simply cover the additional cost of complying with rules of origin (higher input prices and other administrative costs).
We explore this hypothesis using T&A trade data for NAFTA extending the approach of the last two papers. Like Olarreaga and Ozden, we compare border prices for preferential and MFN apparel shipments using unit values calculated from ITC trade data at the HS8 level. Like Ozden and Sharma, we regress these border-price differences on tariff-preference margins and control variables. Unlike them, however, we do not include quantity variables, but instead include a vector of dummy variables for RoO using a database com-piled by Estevadeordal (2000). In a second step, based on those estimates, we resort to simulation techniques to calculate the likely market-access im-provement for Mexican exporters of apparel to the US under NAFTA.
We also explore empirically a conjecture made in Cadot, Estevadeordal and Suwa (2004) according to which the political function of RoO in NAFTA is to create a captive market for US intermediates. If such is the case, the price of US intermediates should be sensitive to RoO and tariff preferences downstream. We test this hypothesis by regressing the border price of US intermediate goods exported to Mexico (relative to the border price of those same goods when exported to other, non preferential destinations) on RoO and tariff preferences applied by the US on downstream (re-exported) Mex-ican goods. Vertical linkages are captured using an input-output table.
To anticipate our main conclusions, when we do not control for RoO, the elasticity of border prices to tariff-preference margins is close to 80%.6
5We define pass-through in the conventional way, i.e. as a measure of the transmission
of changes in exporters’ costs to changes in importing-country prices. That is, full pass-through by Mexican exporters means that an x% tariff preference (a decrease in exporter costs) translates into an x% US-price decrease (nothing retained by Mexican producers) and conversely.
After controlling for RoO, however, we find that Mexican apparel producers retain only just about half of the preference margin. We also find that RoO and tariff preferences downstream indeed affect US intermediate-good prices in a statistically significant way and that US intermediate-good producers are able to retain a sizable proportion of the rents generated by Mexican preferential tariffs.
The paper is organized as follows. Section 2 lays out a simple analytical framework that illustrates the basic issues and prepares the ground for the econometric estimation and simulations that follow. Section 3 estimates pass-through in the Textile & Apparel sector on the Mexican and US side. Based on these results, illustrative simulations in section 4 are used to investigate the sensitivity of Mexican apparel producers to NAFTA preferences under prevailing RoO. Section 5 concludes.
2
Preference pass-through and RoO
2.1
Trade in Textiles & Apparel
The first issue that should be clarified in a model attempting to track the price effects of tariff preferences is market structure. At one extreme, as in e.g. Ozden and Sharma (2004), the US final-good market is taken as perfectly competitive, Mexican supply being too small to saturate it. The retail price of final goods on the US market is then simply their (MFN) tariff-ridden price. The rent potentially appropriable by Mexican exporters is the tariff-preference margin. At the other extreme, noting that there is product differentiation in apparel, one can model the price interaction between member and non-member country exporters in a Bertrand game as in e.g. Chang and Winters (2000) and Winters and Chang (2002). This approach has the advantage of bringing into the analysis strategic effects that are necessarily left out of a competitive model. In terms of our focus on rents, the upshot is that the rent potentially appropriable by Mexican exporters is diminished by the strategic price cuts of non-member exporters. The T&A sector under study here has a peculiar market structure. Vir-tually all non-preferential trade in T&A products has been governed by the
translates into an increase in Mexican producer prices by 0.8x percentage points, or a 20% pass-through.
Agreement on Textile and Clothing (ATC), successor of the Multi-Fiber Agreement (MFA). Under the ATC, agreed upon as part of the Uruguay Round, quotas on garments were to be progressively enlarged until final phase-out in January 2005. However importing countries backloaded the enlargement of binding quotas until the very end of the transition phase, i.e. until the end of 2004 (on this, see e.g. Spinanger 1998). Thus, during our sample period (2000-2002), most of the world’s non-preferential trade in garments was still affected by binding quotas.
Intra-NAFTA trade in T&A, by contrast, has been governed by Annex 300B of the NAFTA treaty, which superseded the MFA and the ATC and mandated the gradual elimination of tariffs and quotas.7 Under a regime of
binding quantitative restrictions on non-preferred exporters, price interaction between Mexican producers and outside (NAFTA) exporters was non-existent as Mexicans were operating along a residual demand curve whose elasticity was unaffected by the pricing decisions of quota-constrained com-petitors, justifying our modelling approach neglecting strategic interactions. The model briefly outlined below is a hybrid, featuring monopolistic com-petition with Dixit-Stiglitz preferences on the final-good market but dis-regarding price competition between suppliers. In the simulation exercise of section 4, by contrast, we adopt the so-called “Armington framework” whereby apparel products imported into the US are differentiated by origin, which implies less than full rent capture by Mexican exporters even without RoO on intermediates.8
2.2
The model
Suppose that n Mexican final goods (say clothing) indexed by j, are sold on the US market in competition with goods imported from the rest of the world. Let xj and x∗j be the amounts of Mexican and “foreign” goods sold
respectively (“foreign” referring to imports from the rest of the world). There is no US production of final goods. Let also x0 be an aggregate of other goods
7The North American Free Trade Agreement Treaty, Annex 300B, section 1, §2. 8To shorten the presentation of the simulation model in section 4, we note in this
section all instances in which the simulation model departs from the structure presented here.
consumed by US households. Preferences are U (.) = X0+ n X j=1 ln Xj where Xj = £ xρj j + ¡ x∗j¢ρj¤1/ρj .
The quasi-linearity of U ensures that the marginal utility of income is con-stant and equal to one, while the log form of the second term ensures that an interior budget allocation holds between the n Mexican goods and other ones. This means that tariff changes have no income effects, an assumption maintained in the simulations of section 4. Additivity of preferences implies strong separability, so two-stage budgeting holds, confining the price effects of tariff preferences to apparel products. The elasticity of substitution be-tween Mexican and foreign brands of good j is σj = 1/
¡ 1− ρj
¢
. Let pj and
p∗
j be the border prices of Mexican and foreign goods respectively and qj and
q∗
j their internal prices, the wedge between the two being an ad-valorem tariff
at rate tj (the difference between MFN and NAFTA tariffs will be introduced
shortly). Thus, qj = (1 + tj) pj. Define Qj ≡ q1−σ j j + ¡ qj∗¢1−σj
. The US demand for the Mexican brand
of good j is then xj =
³ q−σj
j /Qj
´
Ej where Ej = qjxj + qj∗x∗j is the
sub-expenditure on good j, and the own-price elasticity of US demand for Mexican final good j is εj = σj + (1− σj) q1−σj j/Qj. Similar expressions hold for the
foreign good.
Mexican goods are produced by combining value added with m intermedi-ates indexed by i under a Leontief technology with input-output coefficients aij. Each intermediate can be sourced from either of two origins: US or
“foreign” (ROW). The two origins are perfect substitutes in the fabrication of Mexican final goods.9 Let z
ij denote the quantity of “composite” (US and
foreign) intermediate i used in the production of j; that is, zij = zij + zij∗.
Then xj = min ½ Fj(Kj, Lj); z1j a1j ; ...;zmj amj ¾ .
9In the simulations below, this assumption, which is used here only for analytical
In the absence of RoO, perfect substitutability means that Mexican choice of intermediates (US vs. foreign) would be bang-bang. If US intermediates were all more expensive than foreign ones, for instance, they would not be used at all. However, with rules specifying a minimum content rj (expressed here for
simplicity as a proportion of total intermediate use), Mexican exporters have to use US and foreign intermediates in proportions rj and 1 − rj respectively.
Let Cj(xj)be the cost function dual to Fjand φj(pj)≡ Cj[xj(pj)] /xj(pj)
the corresponding unit-cost function, and suppose that φ0j > 0. If pi is the
price of US intermediate i and p∗
i that of its foreign substitute, the marginal
cost of Mexican final good j is
Φj = φj + m X i=1 aij [rjpi+ (1− rj) (1 + ti) p∗i] = φj + m X i=1 aijpi
where pi = rjpi+ (1− rj) qi∗ and qi∗ = (1 + ti) p∗i. A similar expression holds
for the functional forms adopted in section 4, where a binding RoO raises final-good unit costs.
Optimal pricing by Mexican final-good exporters implies µ 1− 1 εj ¶ qj = (1 + tj) Ã φj + m X i=1 aijpi ! . (1)
Because pi is an increasing function of rj whenever pi > qi∗, the supply
price of Mexican final goods in the US is itself an increasing function of the local-content requirement rj.10 We now compute by how much.
2.3
Pass-through
2.3.1 Mexican
We start with Mexican pass-through, then use a slightly different version of the model to study US pass-through. Assume first that the price of US intermediates is fixed. Let pN
j and pMj stand for NAFTA and MFN producer
prices respectively and tN
j and tMj for NAFTA and MFN tariffs. Let also
10If p
∆pj ≡ pNj − pMj and ∆tj ≡ tMj − tNj . Differentiating expression (1) and
linearizing, one can show (see appendix A.1) that ∆pj pM j ' Ψj ∆tj 1 + tM j + Θjrj (2)
where Θj > 0and Ψj > 0are expressions given in full in Appendix A1’s
equa-tions (14) and (15) respectively. The first term measures the pass-through effect resulting from preferential market access. The second term, which depends on input-output relationships, the price of US intermediates, and the elasticity of demand for the final Mexican good in the US, measures the impact on Mexican border prices of intermediate-price increases “exported” from the US and induced by RoO.
2.3.2 US
We now relax the assumption that the price of US intermediates is fixed and consider the market for US intermediate i. Let zi(pi) be its US supply; if it
is exhausted by Mexican demand, the market-clearing condition is
n
X
j=1
aijxj(pj) = zi(pi) (3)
Differentiating (3), rearranging and letting εs
i and εsj be the supply
elas-ticities of intermediate and final goods respectively, we have, after several manipulations: ∆pi pM i ' pz2i iεsi n X j=1 aijxjεsj ∆pj pM j , (4)
which is similar in form to (2) but depends on downstream final-good prices. This raises an endogeneity issue with which we deal by instrumenting in both equations.11
11As in (2), ∆p
i/pMi depends on a weighted sum of ∆pj/pMj in which the weights are
the input-output coefficients bij. In (2), ∆pj/pMj can be similarly shown to depend on
a weighted sum of ∆pi/pMi through Θj (see appendix A.1). Thus, the link between the
regressor and the error term in (2) is via two nested weighted sums and is thus, although linear, very indirect.
3
Estimation
3.1
Estimation equations
In (2), RoOs were taken to be all in the form of a regional value content. In practice, however, they take different forms which can be treated distinctly in the estimation. We use dummy variables, each of which represents a specific legal form of RoO. Thus, CCj is equal to one if a change of chapter on good
j is required;12 and T ECH
j is equal to one if a technical requirement is
imposed.13 The equation to be estimated for the Mexican pass-through is
thus ∆pj pM j = α0+ α1 ∆tj 1 + tM j + α2CCj + α3T ECHj + uj. (5)
All parameter estimates are expected to be positive.
For the US, the pass-through equation to be estimated is ∆pi pM i = β0+ β1 ∆ti 1 + tM i + β2CCi+ β3T ECHi+ β4 X j bij ∆tj ¡ 1 + tM j ¢ +β5 P j bijCCj+ β6 P j bijT ECHj + i. (6)
In words, the US pass-through of Mexican tariff preferences, measured by coefficient β1, is estimated after controlling for two effects relevant to the
determination of US intermediate prices. The first type of effects, picked up by coefficients β2 and β3,is that of RoOs applying to US intermediates them-selves. This did not appear in the algebra above where intermediates were not themselves assumed to be produced with imported intermediates (in or-der to avoid unnecessarily complicating the calculations). The second type of effects are demand ones measured by coefficients β4 (effect of downstream US
preferences on Mexican goods using intermediate i filtered by input-output coefficients aij) and β5 and β6 (same thing for downstream RoOs). Those
effects instrument for the prices of downstream final goods, themselves en-dogenous as argued above. Intuitively, a higher US preference on downstream
12The notation CC
j stands for a change in tariff chapter, a type of RoO requiring the
Mexican final product shipped to the US to be classified in a chapter of the Harmonized System different from its imported intermediates.
13The notation T ECH
j stands for a type of RoO imposing a technical requirement on
Mexican goods raises the induced demand for intermediates and hence their price; stiffer RoOs downstream pick up the “captive-market” effect discussed in the introduction. Thus, all coefficients are expected to be positive and the null hypothesis on β5 and β6 is that there is no captive-market effect.
We estimate (5) on panel data using the Weighted Least Squares (WLS) estimator which performs better than Ordinary Least Squares (OLS) on our sample because it modulates the importance of each observation in the final solution (see appendix A.4 for details). This method assigns to each observa-tion (tariff line) a weight reflecting its importance in total Mexican exports to the US (NAFTA and MFN regimes combined). In the same way, equation (6) is estimated on cross-section data using the WLS estimator with a weight reflecting the importance of each line in total US exports to Mexico.
3.2
Data
Unit values and tariff preference margins are compiled at the HS-8 level from U.S. Department of Commerce, Treasury, and International Trade Commis-sion data as detailed in Appendices A.2 and A.3.14 For (5), the sample includes all HS-8 lines of Section 11 (Textiles and Textile Articles as defined in the HS Trade Classification–see appendix A.2) over 2000-2002. Are in-cluded only tariff lines with positive US imports of Mexican products and strictly positive US imports from Mexico under NAFTA’s regime (that is, we keep only those tariff lines with positive rates of utilization (ujt) of NAFTA’s
preferential regime , since when ujt = 0 there is no rent to share).
Two methods are used to compute ∆pj/pMj , the dependent variable in
the estimation of the Mexican pass-through (5). The first method, called the “Mexican method” because it compares the unit value of the same Mexican good imported under NAFTA and under MFN, has the advantage of using two unit values that are strictly comparable in the calculation but it reduces
14Unit values are calculated by dividing import values by volumes. This method yields
notoriously noisy proxies for the true prices at which goods are sold, as customs records of physical volumes are typically less reliable than their records of values and both are affected by composition problems. Composition problems are somewhat mitigated at deep levels of disaggregation, but then the quantities involved tend to be smaller and aberrant numbers encountered more frequently. The HS-8 level is arguably the best compromise in this regard. US tariffs are calculated by taking the ratio of collected duties to custom value at the tariff-line level in order to take into account any special sub-regime or partial exemption.
the size of the sample since it excludes tariff lines with 100% utilization rates, i.e. 48% of the observations. The second method, called the “ROW method”, includes all observations but measures the relative price ∆pj/pMj
as the percentage difference between the border price (unit value) of a good imported from Mexico under NAFTA and the border price of the “same” good imported from all US import sources including Mexico under the MFN regime. By contrast with the Mexican method, the ROW method introduces some product heterogeneity.
The sample used for the estimation of (6) includes all intermediates used in the manufacturing of Mexican T&A products for export to the US under the same conditions as before, i.e. positive Mexican imports from US under the NAFTA regime (i.e. positive imports and 0 < uj < 100%). Tariff
preference is now computed on Mexico’s imports of US intermediate i, while the RoO are the same as before (because the same rules apply to all of NAFTA’s signatories). In addition to tariff preferences and RoO on imports of US intermediates i, the regression includes tariff preferences and RoO on downstream goods j weighted by input-output coefficients bij.15 Tables 1 and
2 report descriptive statistics of the variables used in each equation, table 1 referring to variables in equation (5) and table 2 referring to variables in (6).
Tables 1 and 2 here
Regarding RoO together with bilateral cumulation,16 a change-of-chapter
(CC) implies that when non-originating (ROW) inputs are used, the trans-formation performed in Mexico must be substantial enough for the final good to belong to a chapter that is not identical to that of its non-originating com-ponents. This implies an implicit regional value content applying to value added and originating inputs, taken together, relative to the value of non-originating inputs. Although more complicated than in the simple model
15Owing to lack of data, these “input-output” coefficients are computed from the US
input-output table for the year 2000 converted from US IO codes (approx. 300 lines) to the HS-8 level, the degree of disaggregation at which we measure unit values. “Blowing up” of aggregate coefficients into HS-8 disaggregation was done by attributing to each HS-8 line a value of intermediate sales equal to the inverse of the number of HS-8 lines falling in its US IO code category.
16Bilateral cumulation means that US inputs are counted as originating in the making
of section 2, this requirement has essentially the same effect. As to techni-cal requirements, Cadot et al (forthcoming) document how they tend to be fine-tuned to suit special interests, with equivalent cost-raising effects.
For each instrument used to confer origin (T ECH or CC) the number appearing in the table is the percentage of tariff lines to which that instru-ment applies. Under the Mexican method 92.4% of tariff lines at the HS-8 level had to satisfy a change of classification at the chapter levels, and 65.6% had technical requirements on the product or process. The proportion of tariff lines affected by technical requirements strongly increases if the sample is restricted to final goods (i.e. products at the last stage of production).
3.3
Results
Table 3a reports results of the Mexican pass-through estimates using the Mexican method, and table 3b results using the ROW method. The first set of estimates includes only the tariff preference margin (and time effects) as explanatory variables. Coefficients for the rate of tariff preference are always significant at the 5% level and robust to the choice of method: these estimates suggest that Mexican producers retain about 80% of the preference margin. The null hypothesis of no pass-through (no change in consumer price, i.e. border-price increase equal to 100% of the tariff preference) cannot be rejected at the 5% level. Taken at face value, these estimates would suggest that Mexican producers did retain a fairly large proportion of the rents created by trade preference.
Table 3 here
However, when dummy variables measuring the presence of RoO are in-cluded, the picture changes. Part of border-price increase now compensates Mexican producers for the cost of complying with NAFTA’s RoO, whose coefficients are both positive, significant, and quantitatively large.17 The
coefficient on the tariff preference having gone down from 0.784 to 0.501,
17Because RoO are proxied by dummy variables and the dependent variable is
mea-sured in percentage points, the coefficients give the estimated price increase, meamea-sured in percentage points, attributable to the presence of RoOs.
Mexican producers now retain only about half of the tariff preference mar-gin. This suggests that previous estimates of the share of rents retained by producers were significantly overestimated.
The coefficients on RoO variables also suggest that these requirements have a significant effect on price and therefore –presumably– on production costs. This is consistent with the results of Carrère and de Melo (2004) on the relative costs of various types of RoO. In accordance with intuition, the fourth column of results in Tables 3a and 3b shows that the effect of RoO is also stronger and more precisely estimated when the sample is restricted to final goods (as defined in the BEC classification).
If such a significant chunk of the preferences granted to Mexican pro-ducers are flushed, where do they go? On one hand, RoO may well be dissipative barriers (like discriminatory product standards), raising produc-tion costs without directly creating offsetting rents elsewhere. On the other hand, they may also generate rents upstream in the value chain. In order to explore the latter hypothesis, we now turn to an analysis of the pass-through of Mexican preferences by US exporters of intermediate goods.
Results for the US pass-through equation are shown in Table 4. The first two columns show the results of an estimation carried out over the whole sample, while the last two show the results of the same estimation but carried out on a sample restricted to the BEC’s definition of intermediate goods.
Table 4
Mexico’s tariff preference has a highly significant and quantitatively large effect, with a through of only 38% over the whole sample and no pass-through at all when the sample is restricted to intermediate goods. This suggests that US intermediate-good suppliers may have substantial market power relative to Mexican final-good assemblers.
The effect of RoO on the price of US exports to Mexico is not significant, suggesting, in accordance with intuition, that RoO affect final-assemblers lo-cated in Mexico more than intermediate-good producers lolo-cated in the US. By contrast, US tariff preferences on downstream final goods have a large and significant effect on the price of US intermediates used in the fabrication of those goods. The strength of the effect (with a pass-through of only 31-36%)
is indeed a surprise given how imperfectly measured are the input-output linkages. More importantly for us, RoO downstream matter, although their effect is (unsurprisingly given that the effect is filtered by input-output coef-ficients) quantitatively small. For the whole sample, changes of chapter and technical requirements are statistically significant; for intermediate goods, only technical requirements are significant, confirming anecdotal evidence that technical requirements are often manipulated by upstream interests to distort the input choices of downstream industries.18
It may be tempting to interpret the negative constant as evidence of strategic price cuts in response to a decrease in the prices charged by either US producers or non-preferred ones, as documented by Winters and Chang (2000) in the context of Spain’s accession to the EU and by Chang and Winters (2002) in the context of Mercosur. However this interpretation of the constant would be dubious in our context: strategic price cuts ought to be systematically related to the depth of tariff preferences and hence should not be picked up by the constant.
4
NAFTA’s Welfare Effects in T&A:
Simula-tions
The above results suggest a changing pattern of trade in the T&A sector with much erosion of preferences via the restrictiveness of RoO and increases in the prices of US textile intermediates sold to the Mexican apparel sector. Such price developments would be consistent with rather small shifts in sales of apparel towards the US and rather larger shifts in intermediate purchase sales by Mexican apparel producers towards the US. This reorientation of trade is confirmed by the indicators in Table 5a. NAFTA resulted in a sharp re-orientation of intermediate (textiles) export sales by the US towards Mexico, the RZ indicator increasing by 24%, while there was negligible
re-orientation of final goods sales by Mexicans to the US, the RF indicator
only increasing by 2%. Table 5a also gives an indicator of the extent of
18Brenton and Imagawa (forthcoming) note the particularly egregious case of a NAFTA
RoO for certain clothing products specifying that imported fabric must be “of subheading 511111 or 511119, if hand-woven, with a loom width of less than 76cm, woven in the United Kingdom in accordance with the rules and regulations of the Harris Tweed Association, Ltd, and so certified by the Association.” (p. 20)
vertical trade, V , the ratio of specialization in intermediate purchases in the US over final sales to the US. The increase in the value of V indicates that NAFTA has been accompanied by a pattern of ‘vertical exchange’ of the offshore assembly type whereby the US ships semi-finished goods for assembly in Mexico and then re-imports them as finished products. Taken together, these quantity developments suggest little Mexican access to the US market and a verticalization of the pattern of Mexican-US trade.
Table 5 here
How costly were the RoO for Mexican T&A exporters? To get orders of magnitude, we carry out simulations with the partial equilibrium struc-tural model (details in Appendix A.5.) inspired from the model presented in section 2 to attempt to capture the costs of RoO for Mexican exporters of apparel products. Suppose then that Mexican apparel producers sell all their output abroad, either to the US, XU S under NAFTA, or to the ROW,
XROW, and that they purchase all their intermediates abroad, either from
the US, ZU S, or again from the ROW, ZROW under a Leontief technology linking value-added and aggregate intermediate demand, aZ. Assume an
up-ward sloping supply curve for value-added in the Mexican T&A industry and let εX be the corresponding elasticity of supply (assumed constant). Let also
PU S
X be unit producer price of Mexican apparel exported to the US market,
PV A the price of value added, CZR the restricted unit costs under binding
RoO, and λ be the administrative cost component assumed to be fixed per unity. To simplify the interpretation of results, Mexican apparel producers are assumed to be price-takers in the markets for intermediate textiles and sell apparel to the ROW at a constant price, but not for sales to the US (see below).
For a small NAFTA preference margin τ > 0, the percentage increase in producer surplus from preferential market access, cW (here equal to the welfare benefit under the assumption of no domestic demand) is:
c
W = (1 + dPV A)1+εX − 1 ≈ (1 + εX) dPV A (7)
Nothing prevents cW from being negative, in which case Mexican apparel producers would not export under the NAFTA regime.
As in Section 2, the distortionary cost of RoO is black-boxed through a regional value content (RVC) equivalent.19 If subscript zero denotes profit-maximizing per-unit use of US intermediates prior to NAFTA (say the ratio given in table 5), and subscript one the corresponding use by the representa-tive competirepresenta-tive Mexican firm when it faces a binding RoO and preferential access, we have on the cost side
zR≡ Z1U S/Z1ROW > z0 ≡ Z0U S/Z0ROW (8) giving the following restricted cost function for intermediates:
CZR= PZR(zR, PzROW; σ) (9)
where PzROW is the (exogenous) price of intermediates purchased outside of
NAFTA and σ is the elasticity of substitution in use between intermediates of different origin. Thus: CR
Z > CZ in the presence of RoO, and (7) captures
the distortionary costs associated with RoO.
Equilibrium in the US market for Mexican apparel requires US demand for Mexican goods, QM ex
U S , to equal Mexican supply to the US, XU S, as
re-flected in (10). NAFTA has two effects. On the demand side, the preference margin, τ , reduces the consumer price of Mexican apparel,PM ex
Q , sold in the
US.On the supply side, RoO (r, λ) raises the unit cost of sales to the US, PXU S(r, λ). Equilibrium under NAFTA in the Mexican apparel industry is
achieved by adjustment of the unit price of Mexican apparel exports to the US, PM ex
Q = PXU S. One can then write the reduced-form expression
corre-sponding to the underlying structural model (see appendix A5) for equilib-rium in the Mexican apparel sector in terms of demand and supply elasticities, and share parameters describing the sector prior to the implementation of NAFTA, i.e. as:
QU SM ex£PQM ex(τ ); ε, σQ
¤
= XU S£PXU S(r, λ); εX, aZ, θ, σ
¤
(10)
19As shown in the bottom of Table 5, there is actually no RVC in the T&A sector, the
most common RoOs requiring changes of tariff classification. Exceptions and technical requirements also apply to 99% and 47% of T&A tariff lines respectively. Given the large increase in Mexican intermediate purchases from the US following NAFTA, it can be safely assumed that these requirements were designed to raise the RVC of Mexican production. The essays collected in Cadot et al. (forthcoming) document how NAFTA’s exceptions and technical requirements have been calibrated to make US sourcing the only option.
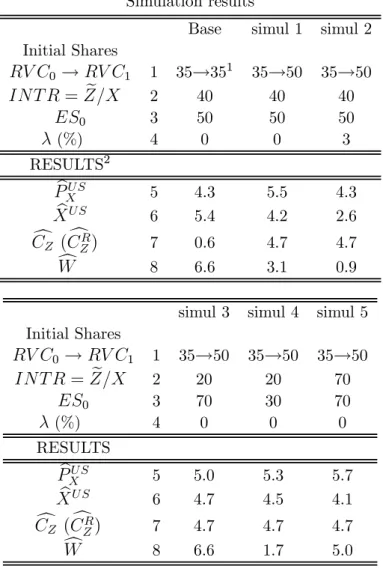
Table 6 describes the results of illustrative simulations with calibration inspired from the pre-NAFTA shares and tariffs given in table 5. Initially, Mexican apparel producers face a 10% MFN tariff in the US market, and the share of intermediates textiles imports from the US is equal to 30%. Unless otherwise indicated, all demand and supply elasticities are assumed equal to unity, and the US share of Mexican apparel exports is 50%. All simulations assume a preferential market access of τ = 10% in the US market for apparel imports. If this preferential access was not accompanied by RoO, export supply to the US market would increase by 5.4% with unit costs increasing by 0.6% because of the assumption of upward-sloping resource costs for the apparel industry. Mexican welfare would increase by 6.6% (base in column 1). Granting preferential access to Mexican apparel suppliers lowers the price paid by US consumers ( bPQM ex < 0), with a pass-through of approximately
50%.20
Table 6 here
Imposing RoO equivalent to raising US intermediate demand by 15 per-centage points reduces supply response as unit costs are raised by 4 percent-age points and welfare gains are cut by 3.5 percentpercent-age points (simulation 1). Adding administrative costs of 3 percent reduces the decline in price of Mexican apparel in the US market (not shown), cutting export expansion in half (with a secondary effect of a lower increase in unit export price to the US). Profits are now less than 0.9% (simulation 2). Selling under NAFTA is now barely profitable21.
The sensitivity of these results to initial shares are explored in the last three simulations in table 6. Each simulation assumes the same preferential
20Equivalently, preferential market access, raises the unit price received by Mexican
apparel producers when they sell in the US market under NAFTA ( bPXU S> 0)
21Alternatively, doubling the intermediate input requirements from the US (without
adding administrative costs) will yield negative profits and therefore it will make exporting under NAFTA a more costly proposition than exporting under MFN (not shown in table 6). This may well be the situation facing many T&A producers entering preferential agreeements with a Northern partner as they depend substantially on imported inputs, and often have small shares in the Northern partner’s market as they face competition from competitors.
access, no administrative costs and the same increase in the share of US intermediates of 15 percentage points (as in simulations 1 and 2). One can check that simultaneously increasing value-added (i.e. lowering intermediate purchases by half) and raising the US share of export share by 20 percentage points yields the same welfare gain as in the base simulation (simulation 3), whereas lowering the initial US export share, reduces the gains from preferential access (simulation 5).
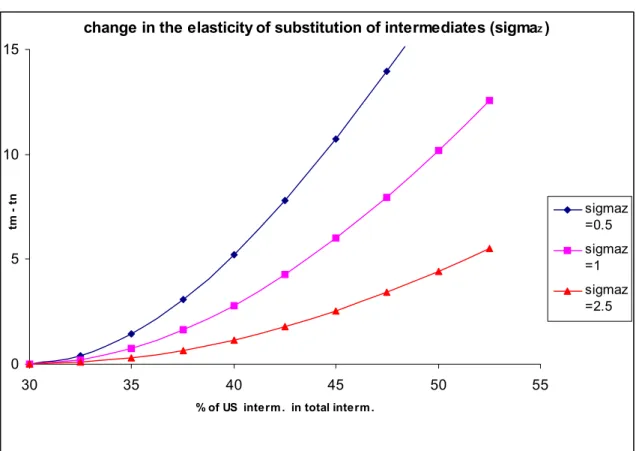
As a final exercise, noting that in spite of rather substantial market access in the T&A sector, NAFTA utilization rates are less than 100% (see table 5b), we solve the model for cW = 0in (7) under different stringency requirements for establishing origin (here captured by increasing RVC ratios). In this exercise, we compute the rate of preferential market access, τ (= tm − tn)
which would leave Mexican apparel producers indifferent between selling in the US under the NAFTA and MFN regimes using the share values used in simulations 1 to 3 in table 6. The results are displayed in figure 1 which traces the combinations of RoO (measured as departures from an initial US intermediate share of 30%) on the horizontal axis and preference rates on the vertical axis.
Figure 1 here
According to the illustrative estimates in figure 1, with an elasticity of substitution of σ = 1 in use between US and ROW intermediates, an increase in the US intermediate share of textiles from 30% to 45% (in the ballpark of estimates in table 5a) and no administrative costs (i.e. λ = 0 in (7)), a preferential market access of 7% percent would be required to leave Mexican apparel producers indifferent, i.e. on their ‘participation constraint’ to the NAFTA regime. These effects would be compounded if we were to include in the simulations a rising price for US intermediates as suggested by the econometric results in section 322. If one views technical requirements and
22For instance, assuming an elasticity of supply of US intermediates to Mexico equal
to three (six), the required preferential access would have to increase from 7% to 14% (10%). The restrictiveness of RVC is evident ,since an increase in the US intermediates share of textiles from 30% to 35% would require a preferential access of 3% in order to leave Mexican producers in their participation constraint (assuming an elasticity of supply of US intermediates to Mexico equal to three).
exceptions as equivalent to reducing the value of σ, it is likely that market access was, in effect, quite low under NAFTA. For example with σ = 0.5, a plausible elasticity of substitution for intermediates purchases, a preference rate of about τ = 10% would be needed to give a marginal preferential access to Mexican apparel producers.
5
Concluding remarks
This paper has studied Mexican market access to the US market under NAFTA in the Textile and Apparel (T&A) sector. We have shown that only about half of the tariff preference (of about 10%) was retained by Mex-ican producers. Furthermore, taken together, our estimates suggest that NAFTA’s tariff preference might just about compensate Mexican producers for the cost of complying with rules of origin. As a result, effective market access for Mexican T&A producers would have been largely unchanged under NAFTA.
We also find that the induced upstream effect on the price of US interme-diate (textile) goods used in the production of Mexican final (apparel) goods is significant and rather large. The price of US intermediates sold to Mexico are, on average, higher than the prices of the same goods for export to other (non preferential) destination by 12-13%. Technical requirements (a partic-ular form of RoOs that is prevalent in the T&A sector) just by themselves account for a full third of that price increase, or about 4 percentage points, a strong signal in noisy data.
Inspired by these estimates, we carried out simulations in a stripped down model of the Mexican T&A sector in which Mexican apparel producers can sell either to the ROW of the US under NAFTA, but under the condition that they increase their purchases of US textile intermediates. Simulation results confirm that preferential margins of the magnitude granted under NAFTA might have been just about sufficient to compensate Mexican apparel producers for having to increase their purchases of US textiles.
These results inform the debate on the usefulness of trade preferences as a development tool. Given that preference margins are bounded above by the level of MFN tariffs which are, for industrial countries, at fairly low levels (apparel examined here is among the few exceptions), preferences absorbed in half by a combination of higher costs and pass-through to buyers are likely
to be of limited value to Southern partners. Taken together, our results lend credence to the suspicion that rules of origin are not so much a development-policy tool designed to prevent screwdriver assembly (a potentially worthy objective) but instead a circuitous way of raising the profits of upstream pro-ducers by creating a captive market for them in partner countries. This is likely to be an especially important issue in North-South preferential agree-ments where vertical trade (capital-intensive component manufacturing in the North, labor-intensive assembly in the South) is prevalent. The flurry of regional trade agreements may well be a costly diversion distracting from necessary reforms to improve the functioning of the World Trading System.
References
[1] Anson, Jose, O. Cadot, A. Estevadeordal, A. Suwa, J. de Melo and B. Tumurchudur (2005), “Rules of Origin in North-South Preferential Trading Arrangements with an Application to NAFTA”, forthcoming, Review of International Economics.
[2] Brenton, Paul (2003), "Integrating the Least Developed Countries into the World Trading System: The Current Impact of EU Preferences un-der Everything But Arms"; Journal of World Trade, 37 pp. 623-646. [3] – and H. Imagawa, (forthcoming), “Rules of Origin, Trade and
Cus-toms” in L. de Wulf and J. Sokol eds. Customs Modernization: A Hand-book, World Bank.
[4] –, and Miriam Manchin (2003), "Making EU Trade Agreements Work: The Role of Rules of Origin", The World Economy 26, Issue 5, Page 755-769
[5] Cadot, Olivier, Antoni Estevadeordal and Akiko Suwa-Eisenmann (2004), “Rules of Origin as Export Subsidies”; CEPR, DP #4999, forth-coming in O. Cadot et al. eds.
[6] Cadot, Olivier, Antoni Estevadeordal and Akiko Suwa-Eisenmann and Thierry Verdier (forthcoming), The Origin of Goods: Rules of Origin in Free-Trade Agreements; Oxford University Press.
[7] Carrère, Céline, and Jaime de Melo (2004), “Are Different Rules of Origin Equally Costly? Estimates from NAFTA”,CEPR DP# 4437, forthcoming in Cadot et al. eds.
[8] Chang, Won, and L. Alan Winters (2002), “How Regional Blocs Affect Excluded Countries: The Price Effects of Mercosur”, American Eco-nomic Review 92, 889-904.
[9] Estevadeordal, Antoni (2000), “Negotiating Preferential Market Access: The Case of the North American Free Trade Agreement”, Journal of World Trade 34, 141-66.
[10] Feenstra, Robert (1989), “Symmetric Pass-Through of Tariffs and Ex-change Rates Under Imperfect Competition : An Empirical Test”, Jour-nal of InternatioJour-nal Economics 27, 25-45.
[11] Hoekman, Bernard, Constantine Michalopoulos and L. Alan Winters (2004), "Special and Differential Treatment of Developing Countries in the WTO: Moving Forward after Cancun" The World Economy 27, 481-506.
[12] Kreinin, Mordechai (1961), “Effect of Tariff Changes on the Prices and Volume of Imports”; American Economic Review 51, 310-324.
[13] Krishna, Kala (2005), "Understanding Rules of Origin"; NBER WP # 11150, forthcoming in O. Cadot et al. eds.
[14] Olarreaga, Marcelo, and Caglar Ozden (2005), “AGOA and Apparel: Who Captures the Tariff Rent in the Presence of Preferential Market Access?”, The World Economy 28, Issue 1, Page 63-77.
[15] Ozden, Caglar, and Gunjan Sharma (2004), “Price Effects of Preferential Market Access: Caribbean Basin Initiative and the Apparel Sector”; World Bank Discussion Paper 3244.
[16] Spinanger, Dean (1998) “Textiles Beyond the MFA Phase-Out”, Uni-versity of Warwick, GSGR Working Paper No. 13/98.
[17] Winters, L. Alan (1997) “Regionalism and the Rest of the World: The Irrelevance of the Kemp-Wan Theorem”; Oxford Economic Papers 49, 228-234.
[18] Winters, L. Alan, and Won Chang, (2000), “Regional Integration and the Rest of the World: An Empirical Investigation”; Journal of Inter-national Economics 51, 363-377.
[19] Yeats, Alexander (1998), “Does Mercosur’s Trade Performance Raise Concerns about the Effects of Regional Trade Agreements?”; World Bank Economic Review 12, 1-28.
Tables
Table 1
Descriptive statistics, Mexican pass-through
“Mexican method” “ROW method” goodj All Only Final All Only Final
obs. 1304 913 2497 1324 ujt a) (%) 73.24 69.58 75.68 71.78 ∆pjt pM jt a) (%) 4.58 4.87 3.99 4.55 ∆tjt 1+tM jt a) (%) 6.07 5.87 6.22 5.79 CCj b) (%) 91.87 92.36 82.66 92.56 T ECHj b) (%) 65.57 80.36 48.34 88.60 Interm. (%) 29.98 - 46.98 -Final (%) 70.02 - 53.02 -Notes Sample period: 2000-2002.
Sample data: Textile & Apparel sector (HS-8 section 11).
a) weighted averages (reflecting the importance of each tariff linej in total Mexican exports to the US).
Table 2
Descriptive statistics, US pass-through
Goodi All (intermed.& Final) Only Intermed.
Observations 837 473 ∆pi/p M i a/ (%) 12.16 13.33 ∆ti/ ¡ 1 + tM i ¢ a/ (%) 12.32 13.76 CCi b/ (%) 82.32 68.92 T ECHi b/ (%) 42.29 7.61 P jaij∆tj/ ¡ 1 + tM j ¢ a/ (%) 5.71 5.72 P jaijCCj a/ (%) 34.01 42.33 P jaijT ECHj a/ (%) 68.80 67.24 Notes Sample period: 2000.
Sample data: Textile & Apparel sector (HS-8 section 11).
a/ Weighted averages (reflecting the share of each US intermediate sales of linei to Mexican T&A sector).
Table 3
Regression results, Mexican pass-through
Table 3a: Mexican Method
∆pjt
pM jt
All Only Final All Only Final Coeff t-stat Coeff t-stat Coeff t-stat Coeff t-stat
∆tjt 1+tM jt 0.784** 3.29 0.799** 3.33 0.501** 2.98 0.474** 3.04 CCj - - - - 0.998* 1.97 1.054** 2.73 T ECHj - - - - 1.674** 3.75 1.989** 4.51 obs. 1304 913 1304 913 R2-adj. 0.51 0.51 0.55 0.56
Table 3b: ROW Method
∆pjt
pM jt
All Only Final All Only Final Coeff t-stat Coeff t-stat Coeff t-stat Coeff t-stat
∆tjt 1+tM jt 0.794** 3.23 0.739** 3.15 0.503** 2.89 0.410** 2.97 CCj - - - - 0.756** 2.63 0.967** 3.24 T ECHj - - - - 2.045** 3.11 1.982** 4.08 obs. 2497 1324 2497 1324 R2-adj. 0.52 0.49 0.54 0.54 Notes
** and * indicates estimates significant at the 5% and 10% level respectively.
t-statistics next to coefficients.
Constant and time effects are included but not reported. Sample period: 2000-2002.
Sample data: Textile & Apparel sector (HS section 11). Estimator: Weighted Least Squares.
Table 4
Regression results, US pass-through
∆pi
pM i
All (intermed. & final) Only Intermed. Coeff t-stat Coeff t-stat
∆ti 1+tM i 0.620** 6.54 0.928** 6.76 CCi -1.516 -1.31 1.405 0.72 T ECHi 2.319 1.11 1.983 1.51 P jaij ∆tj 1+tM j 0.689** 3.86 0.637** 2.07 P jaijCCj 0.037* 1.86 0.022 0.54 P jaijT ECHj 0.053** 2.01 0.119** 2.39 Cst -3.848 -1.47 -9.898** -2.28 obs. 837 473 R2-adj. 0.54 0.51 Notes
** and * indicate estimates significant at the 5% and 10% level respectively.
t-statistics next to coefficients. Sample period: 2000.
Sample data: Textile & Apparel sector (HS section 11). Estimator: Weighted Least Squares.
Table 5
Trade and preferences, and RoO in Mexican-US T&A trade
Table 5a: Changing patterns of Mexican-US trade in T&A
Post-NAFTA/Pre-NAFTAa)
Mex. imports (interm.) RZ= ZU S/ZROW 1.24 Mex exports (final) RF= XU S/XROW
1.02 Verticalization index V = RZ/RF 1.22 Table 5b: Preferences and RoO in T&Ab)
All Intm. Final
US Tariff pref. (unweighted) 10.09% 9.97% 10.21%
RoO (% of tariff lines)
Exceptions 99.3 99.2 99.3
Technical requirements 47.6 2.6 88.3
Utilization rates 86.09% 96.31% 76.85%
Notes: All figures are trade figures summed over the relevant product categories ac-cording to the BEC classification of activities.
ZU S, [ZROW]
: Intermediate purchases from US [ROW]
XU S, [XROW]: Export sales of apparel to US [ROW] a)
Column values are ration of two year averages (2000-1998) and (1994-1992).
b)
The sample includes all HS-8 tariff lines of Section 11 with positive US imports of Mexican products and strictly positive US imports from Mexico under NAFTA’s regime (that is only those tariff lines with positive rates of utilization, see section 3.2) in 2000, i.e. 828 tariff lines.
Table 6
Simulation results
Base simul 1 simul 2 Initial Shares RV C0 → RV C1 1 35→351 35→50 35→50 IN T R = eZ/X 2 40 40 40 ES0 3 50 50 50 λ (%) 4 0 0 3 RESULTS2 b PU S X 5 4.3 5.5 4.3 b XU S 6 5.4 4.2 2.6 c CZ ( cCZR) 7 0.6 4.7 4.7 c W 8 6.6 3.1 0.9
simul 3 simul 4 simul 5 Initial Shares RV C0 → RV C1 1 35→50 35→50 35→50 IN T R = eZ/X 2 20 20 70 ES0 3 70 30 70 λ (%) 4 0 0 0 RESULTS b PXU S 5 5.0 5.3 5.7 b XU S 6 4.7 4.5 4.1 c CZ ( cCZR) 7 4.7 4.7 4.7 c W 8 6.6 1.7 5.0
Notes and definition of variables::
RV C0 = (ZU S/(ZU S+ ZROW))0 = 0.35; ES0 = (XU S/(XU S+ XROW));
λ =administrative costs;W = (1 + dc PV A)1+εX − 1 ≈ (1 + εX) dPV A
All simulations, assumeτ ≡ (tM
− tN)/(1 + tM)= 10%; ε = 1, ε
Q = 1, σz =
1, σQ= 1,Ω = 1, tmZ = tmZ = 0 1
In the base simulation there is no RVC restriction.
Figure 1: Participation constraint
change in the elasticity of substitution of intermediates (sigmaZ)
0 5 10 15
30 35 40 45 50 55
% of US interm. in total interm.
tm - tn sigmaz =0.5 sigmaz =1 sigmaz =2.5
Appendices
23Appendix A.1 Derivation of expressions in section 2
Derivation of expression (2) Differentiating expression (1) gives
µ 1− 1 εj ¶ dqj = (1 + tj) " φ0jdpj + m X i=1 aij∆pidrj # + " φj+ m X i=1 aijpi # dtj. (11) where ∆pi = pi− (1 + ti)p∗i As qj = (1 + tj) pj, it follows that dqj = (1 + tj) dpj + pjdtj. (12)
Substituting (12) into (11) gives µ 1− 1 εj ¶ [(1 + tj) dpj+ pjdtj] = (1 + tj) φ0jdpj+(1 + tj) m X i=1 aij∆pidrj+ Ã φj + m X i=1 aijpi ! dtj, or µ 1− 1 εj − φ 0 j ¶ dpj = m X i=1 aij∆pidrj+ 1 1 + tj " φj + m X i=1 aijpi− µ 1− 1 εj ¶ pj # dtj
Rearranging slightly, this gives dpj = Pm i=1aij∆pi ³ 1− ε1 j − φ 0 j ´ drj+ φj + Pm i=1aijpi− ³ 1− ε1 j ´ pj ³ 1−ε1 j − φ 0 j ´ (1 + tj) dtj.
In discrete form, we have thus ∆pj pj ' Pm i=1aij∆pi ³ 1− 1 εj − φ 0 j ´ pj ∆rj + φj+ Pm i=1aijpi− ³ 1− ε1 j ´ pj ³ 1− ε1 j − φ 0 j ´ pj ∆tj (1 + tj) . (13)
Suppose that expression (13) is evaluated around MFN prices. Let pN j and
pMj stand for NAFTA and MFN producer prices respectively and tNj and tMj
for NAFTA and MFN tariffs. The regional value content rj is zero under
the MFN regime, so we have, after switching the bracketed term’s sign, one obtains pNj − pMj pM j ' Pm i=1aij∆pi ³ 1−ε1 j − φ 0 j ´ pM j rj + ³ 1− ε1 j ´ pM j − φj − Pm i=1aijpi ³ 1−ε1 j − φ 0 j ´ pM j tMj − tNj tM j
which is expression (2) in the text with Θj = Pm i=1aij∆pi ³ 1− ε1 j − φ 0 j ´ pM j (14) and Ψj = ³ 1− ε1 j ´ pM j − φj − Pm i=1aijpi ³ 1−ε1 j − φ 0 j ´ pM j . (15)
Appendix A.2. HS Trade Classification- Section XI
50 Silk
51 Wool. Fine Or Coarse Animal Hair; Horsehair Yarn and Woven Fabric 52 Cotton
53 Other Vegetable Textile Fibres; Paper Yarn and Woven Fabrics of Paper Yarn
54 Man-made Filaments 55 Man-made Staple Fibres
56 Wadding. Felt and Nonwovens; Special Yarns; Twine. Cordage. Ropes and Cables and Articles Thereof
57 Carpets and Other Textile Floor Coverings
Trimmings; Embroidery
59 Impregnated. Coated. Covered Or Laminated Textile Fabrics. Textiles Articles Of a Kind Suitable for Industrial Use
60 Knitted Or Crocheted Fabrics
61 Articles of Apparel and Clothing Accessories. Knitted Or Crocheted 62 Articles of Apparel and Clothing Accessories. Not Knitted Or Crocheted 63 Other Made Up Textile Articles; Sets; Worn Clothing and Worn
Textile Articles; Rags
Appendix A.3. Variables
Variable definitions
uit : utilization rate, defined as the ratio of US imports from Mexico under
US-NAFTA preferential tariffs to total US imports from Mexico (including other pro-grams) at the HS-8 level.
∆pjt
pM jt
: Mexican exporter price variation, defined as ∆pjt
pM jt = p N jt−pMjt pM jt with pN jt (pM
jt) the NAFTA (MFN) pre-tariff prices paid by the US to Mexican exporters of
j in year t.
∆tjt
1+tM jt
: Mexican tariff preference margin, defined as ∆tjt
1+tM jt = tM jt−tNjt 1+tN jt with tN jt and tM
jt the ad-valorem tariffs applied at the US border to Mexican goods under
the NAFTA and MFN regimes respectively.
∆pi
pM i
: US exporter price variation, defined as ∆pi
pM i = pN i −pMi pM i withpN i the NAFTA
pre-tariff prices paid by the Mexican on US exports ofiandpM
i the MFN pre-tariff
prices paid by the RoW on US exports of i;-both defined at the HTS-8 level.
∆ti
1+tM i
: US tariff preference margin, defined as ∆ti
1+tM i = tM i −tNi 1+tN i withtN i (tMi )the
ad-valorem tariffs applied at the Mexican border to US (ROW) goodsiunder the NAFTA (MFN) regimes-defined at the HTS-8 level;
CCi(j) :Dummy equal to 1 if a change of chapter on good i(j)-defined at the
HTS-6 level- is required, otherwise 0;24
24Change in tariff classification, requiring the product to change its heading under the
T ECHi(j) :Dummy equal to 1 if a technical requirement on goodi(j)-defined
at the HTS-6 level- exists , otherwise 0;25
aij: Share of intermediate goodiimported from US used by Mexican producer
of goodj over total intermediate use of goodiin 2000-defined at the HTS-8 level.;
δt: time (year) fixed effects
Variables relative to the stage of production26: Interm. (Final)= Dummy equal to 1 if the product is an intermediate (final) good, otherwise 0.
Details on Variable Computation
Variables ∆pjt pM jt , ∆pi pM i , ∆tjt 1+tM jt, ∆ti 1+tM i
and uit have been compiled from tariff and trade
data from the U.S. Department of Commerce, the U.S. Treasury, and the U.S. International Trade Commission (http://www.dataweb.usitc.gov/)
pNjt (pMjt): Unit prices of US imports from Mexico under NAFTA (MFN),
calculated as the ratio of customs value to number of units of category k in year t. Note that customs value is the value of imports as appraised by the U.S. Customs Service in current dollars and is defined as the price actually paid or payable for merchandise, excluding U.S. import duties, freight, insurance, and other charges.
pN
i (pMi ): Unit prices of US exports to Mexico (the rest of the World) under
NAFTA (MFN), calculated as the ratio of customs value to number of units of category k in year t. Note that total export value are the total f.a.s. (free alongside ship) value, i.e. the value of exports at the U.S. port, based on the transaction price, including inland freight, insurance, and other charges incurred. The value excludes the cost of loading the merchandise and also excludes any further costs.
tN
jt (tMjt): represent the NAFTA preferential (MFN) tariff imposed by the US
on Mexican exports of j in year t, calculated as the ratio of collected duties to custom value on US imports from Mexico under NAFTA (MFN). Calculated duty represents the estimated import duties collected in actual Dollar, based on the applicable rate(s) of duty as shown in the Harmonized Tariff Schedule (HTS).
tN
it (tMit): represents the official NAFTA (MFN) preferential tariff imposed by
the Mexican on imports of good ifrom the US (rest of the world).
25Technical requirement prescribing that the product must undergo specific
manufac-turing processing operations in the originating country.
Appendix A.4. Weighted Linear Least Squares
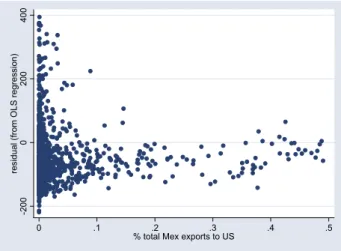
With an Ordinary Least Square (OLS) specification, it is assumed that the data is of “equal quality”, i.e. has constant variance. If this assumption is violated, the fit may be unduly influenced by data of poor quality. In our sample, we can suspect a problem of heteroskedasticity in the error term due to the presence of numerous data outliers. This is confirmed by the Breusch-Pagan / Cook-Weisberg test: the null hypothesis of constant variance is rejected if equation (5) is estimated with the OLS estimator. Figure 2, which plots the residuals shows that: (i) residual variances indeed are not constant, and: (ii) residuals seem to be a function of the tariff line’s share in total Mexican exports to the US. The plot of residuals has a funnel shape where “small lines” (those having a small share in total Mexican exports to the US) yield more scattered response values than large lines. Under those conditions weighted least squares regression improves the fit by including a scale factor (the line’s weight in total Mexican exports to the US) in the fitting process. Weighted least squares regression minimizes the error estimate
S = n X j=1 wjt( ∆pjt pM jt − ∆pdpMjt jt )2 (16)
where wjt are the weights. Hence, the weights determine how much each
HTS-8 line influences the final parameter estimates. A high-quality data point (i.e. with a high share in total Mexican exports to US) influences the fit more than a low-quality data point.
Figure 2: Residuals in the unweighted model (Zoom) -200 0 200 400 re si dual ( fr om OLS r egr essi on) 0 .1 .2 .3 .4 .5
% total Mex exports to US
Appendix A.5. Simulation model for Welfare Analysis
This annex details the equations of the model used for the simulations re-ported in section 6. The model is partial equilibrium with the size of the industry proxied by the supply elasticity of factors entering in a stylized T&A sector. Supply and demand decisions come from profit-maximisation Mexican producers and expenditure cost minimization by a representative US consumer. The tractability of this stylized T&A sector is obtained as follows.
Strong separability is assumed at all production stages and for demand, thereby reducing the number of parameters needed to simulate the model by restraining cross-price effects. On the US import side, strong separability (or Armington assumption) implies two-stage budgeting so that the demand for Mexican apparel only depends on the relative of price of Mexican ap-parel in the US, i.e. the preferential rate received by Mexican producers, τ, with σQ measuring the (Hicksian) price elasticity of demand. The same
strong separability assumption characterizes the export supply decision by Mexican producers for sales to the US and to the ROW, with Ω, measuring the (output-compensated) export price supply elasticity. Likewise, Mexican producers’ decision for intermediate input purchases between the US and the ROW is characterized by a constant (Hicksian) price elasticity of demand of σ. As shown below, strong separability reduces the simulation estimates of
preferential market access to the following five elasticities: εX, ε, σQ, Ω, σ.
Mexico produces a final good (call it apparel), X , with intermediates, Z, according to a Leontief technology and an elasticity of supply of εX (A1
and A2). This final product, apparel, can be sold either to the US, XU S or
to the rest of the world, XROW at increasing marginal costs according to a CET allocation function (the assumption is that there is some differentiation in export sales across markets).This is reflected in (A3) and (A4). Unit price for sales is given by the cost function associated with the CET function (A5). Mexican apparel is produced with intermediate textile products,Z, which for simplicity are not assumed to be produced domestically, but can be purchased either from the US, ZU S, or from the rest-of-the-world (ROW), ZROW, inter-mediates being imperfect substitutes by country of origin ((A6) and (A7)). Cost minimization in the absence of restrictions yields intermediate demands by country of origin (A8a) and corresponding unit costs (A9a).
Since we are not interested in the US side of NAFTA, we only model the import demand decision. On the US side, a constant (price) elasticity of demand, ε, describes the US demand for apparel, Q, with the demand by country of origin depending on relative prices ( A10) as in the quasi-linear utility function used in section 2. Thus the demand for Mexican apparel, QM exU S , is an imperfect substitute with apparel products sold into the US under
MFN from the rest-of-the-world, QROW
U S (A11) and (A12) with unit price for
US apparel purchases given by (A13). Except for sensitivity analysis, we assume that Mexican apparel producers can purchase textiles from the US at constant prices (A17).
To simplify, it is assumed that the US can purchase apparel from the ROW at constant prices (A14) while the price paid for Mexican apparel depends on Mexican cost conditions (A15) including fixed administrative costs, λ, when RoO are binding (see below). Mexicans purchase intermediates at constant prices from both sources (A16 and A17).
RoO are modelled as in section 2 by supposing that they are equivalent to a regional value content scheme. Mexican producers of apparel must purchase US inputs according to (A8b) instead of (A8a). Mexican producers may also face fixed administrative costs per unit, λ. As a result, unit costs of production are raised from CZ in (A9a) to CZR in (A9b).
Under this set-up, an equilibrium in the Mexican market for apparel pro-duction requires that US demand, QM ex
U S equal Mexican supply to the US,
XU S, as reflected in (A18). Implementing NAFTA has two effects. On the
suppliers of apparel,PM ex
Q .On the supply side, RoO forcing Mexican apparel
producers to use US intermediates raises the unit cost of sales to the US, PU S
X (r, λ). Equilibrium under NAFTA in the Mexican apparel industry is
achieved by adjustment in the unit price of Mexican apparel exports to the US, PQM ex= PXU S. One can then write the reduced form expression for
equi-librium in the Mexican apparel sector in terms of demand, supply elasticities and share parameters describing the sector prior to the implementation of NAFTA, i.e. as:
QU SM ex(PQM ex(τ ); ε, σQ) = XU S(PXU S(r, λ)); εX, aZ, θ, σ)
Mexico
Mexican final good supply
X = AX(PV A)εX (A1)
Value-added unit price
PV A= PX− aZCZ (A2)
Mexican export good allocation
XROW = µ X γ ¶ µ 1 α ¶ Ω Ω+1 " 1 + µ α 1− α ¶Ωµ PU S X PROW X ¶Ω+1#− Ω Ω+1 (A3) XU S = µ X γ ¶ µ 1 1− α ¶ Ω Ω+1 " 1 + µ 1− α α ¶Ωµ PROW X PU S X ¶Ω+1#− Ω Ω+1 (A4)
Unit price of composite export good
PX = 1 γ h α−Ω¡PXROW¢1+Ω+ (1− α)−Ω¡PXU S¢1+Ωi 1 Ω+1 (A5) Demand for (imported) intermediates
e
Z = aZX (A6)
Demand for intermediates by country of origin e Z = φhβ (Z∗)σ−1σ + (1− β)¡ZU S¢ σ−1 σ i σ σ−1 (A7) (Unconstrained) Intermediate demand by country of origin
ZU S ZROW = ·µ 1− β β ¶ µ PROW Z PU S Z ¶¸σ (A8a) (Unconstrained) unit cost for intermediates
CZ = 1 φ h (β)σ¡PZROW¢1−σ+ (1− β)σ¡PZU S¢1−σi 1 1−σ (A9a) US
Demand for textiles
QU S = AQ ¡ PQU S ¢−ε (A10) QU S = ψ · θ (Q∗U S) σQ−1 σQ + (1− θ)¡QM ex U S ¢σQ−1 σQ ¸σQ−1σQ (A11) QM ex U S QROW U S = "µ 1− θ θ ¶ ÃPROW Q PM ex Q !#σQ (A12) Unit-price of composite imported good
PQU S = 1 ψ h (θ)σQ¡PROW Q ¢1−σQ + (1− θ)σQ¡PM ex Q ¢1−σQi 1 1−σQ (A13)