HAL Id: cea-02500821
https://hal-cea.archives-ouvertes.fr/cea-02500821
Submitted on 6 Mar 2020
HAL is a multi-disciplinary open access
archive for the deposit and dissemination of
sci-entific research documents, whether they are
pub-lished or not. The documents may come from
teaching and research institutions in France or
abroad, or from public or private research centers.
L’archive ouverte pluridisciplinaire HAL, est
destinée au dépôt et à la diffusion de documents
scientifiques de niveau recherche, publiés ou non,
émanant des établissements d’enseignement et de
recherche français ou étrangers, des laboratoires
publics ou privés.
Identifying subassemblies by ultrasound to prevent fuel
handling error in sodium fast reactors First test
performed in water
K. Paumel, C. Lhuillier
To cite this version:
K. Paumel, C. Lhuillier. Identifying subassemblies by ultrasound to prevent fuel handling error in
sodium fast reactors First test performed in water. ANIMMA 2015 - 4th International Conference
on Advancements in Nuclear Instrumentation: Measurement Methods and their Applications, IEEE,
Apr 2015, Lisbon, Portugal. �cea-02500821�
Identifying subassemblies by ultrasound to prevent
fuel handling error in sodium fast reactors: First test
performed in water
Kevin Paumel and Christian Lhuillier
Abstract– Identifying subassemblies by ultrasound is a method
that is being considered to prevent handling errors in sodium fast reactors. It is based on the reading of a code (aligned notches) engraved on the subassembly head by an emitting/receiving ultrasonic sensor. This reading is carried out in sodium with high temperature transducers. The resulting one-dimensional C-scan can be likened to a binary code expressing the subassembly type and number. The first test performed in water investigated two parameters: width and depth of the notches. The code remained legible for notches as thin as 1.6 mm wide. The impact of the depth seems minor in the range under investigation.
I. INTRODUCTION
DENTIFYING subassemblies by ultrasound is a method that is currently being considered within the scope of preventing handling errors in sodium fast reactors. It is based on reading an engraved code on the subassembly by an emitting/ receiving ultrasonic sensor. This reading is carried out in liquid sodium by a sensor directly immersed in sodium. It is thus not necessary to uncover part of the subassembly before being able to identify it.
The Commissariat à l’Energie Atomique (CEA) has high-temperature ultrasonic transducers (TUSHT) [1] capable of operating in sodium under handling conditions (about 200°C). These sensors are also capable of resisting nominal power conditions of the hot plenum (sodium temperature between 550 and 600°C) and therefore to remain in sodium for several years. For example, TUSHTs used in the Phenix's SONAR device [2] operated for the entire duration of SONAR (about 15 years) and even for the last dynamic core flowering tests in 2013. It is nonetheless necessary to make sure the CEA can ensure a transducer lifespan that is longer the period between two 10-yearly inspections during which they could be replaced by new transducers.
The use of ultrasound therefore appears to be a promising solution. However, ultrasound (at least for methods not using roughness-based diffusion) is sensitive to alignment defects. Furthermore, the ultrasonic trajectory is sensitive to heterogeneities in the sodium environment, i.e. temperature gradients, sodium velocity and bubbles. These disruptive phenomena are complex which makes them difficult to quantify. The test, whose results are reported in this paper, therefore aimed at being representative of a "pragmatic"
Manuscript received April 3, 2015.
K. Paumel and C. Lhuillier are with the CEA, DEN, Nuclear Technology Department, F-13108 Saint-Paul-lez-Durance, France (telephone: +334 42 25 20 46, e-mail: kevin.paumel@cea.fr).
identification configuration in which the disruptive aspects were limited as much as possible:
• Measurement (reading) as close as possible to the code,
• Subassembly freed from the lattice to limit off-centring and inclination of the subassembly in relation to the ultrasonic beam,
• No liquid wave guide (potential bubble trap),
• Reading at the top of the subassembly to take advantage of less "agitated" sodium than that near the core outlet. This test is performed in water because of easier implementation. Its objective is to demonstrate the feasibility of the method, as well as to estimate the reading resolution of the code markings.
This paper first describes the identification method principle as the test objectives and principle. Secondly, the main experimental conditions are described (ultrasonic sensor, mock-up, criteria for similarity, etc.). Then, the test parameters are specified. Lastly, the results are provided.
II. IDENTIFICATION METHOD PRINCIPLE
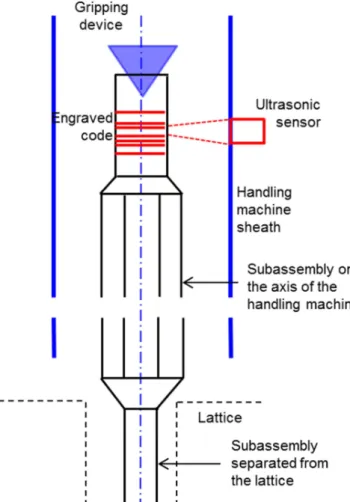
Several alternatives for reading a code by means of ultrasound are considered. This paper focuses on the most robust alternative, i.e. that with the "most favourable" reading configuration (see Fig. 1). In this configuration, the reading occurs after the subassembly was lifted high enough by the handling gripper so that it was completely separate from the lattice. There was no contact between the lifted subassembly and the rest of the core. This separation from the lattice made it possible to reasonably believe that the subassembly's off-centring and inclination were small in relation to the axis of the handling machine sheath.
This full separation also made it possible to avoid friction and even sudden jamming and unjamming when moving the subassembly's code in front of the ultrasonic sensor.
Lastly, it was assumed that the subassembly was hanging freely and pendular oscillation was insignificant following its separation from the lattice.
The reading consists in an upward vertical displacement of a code engraved on the subassembly head in front of the beam of a focused ultrasonic transducer. Similarly to a bar code, the code is made of an alignment of notches. The presence of a notch means the 0 binary value while its absence means the 1 binary value.
Fig. 1. Schematic diagram of the most favourable reading configuration for which the subassembly is high enough so that it is completely free from the lattice.
III. TEST OBJECTIVES AND PRINCIPLE
The test objective was to first demonstrate the feasibility of reading a code under these favourable conditions, i.e:
• low off-centring and inclination
• linear movement of the code in relation to the ultrasonic beam
• displacement increment between each well-controlled ultrasonic pulse.
The objective was also to determine the reading resolution of the code markings, i.e. reading resolution as a function of the width (and spacing between these marks) and the depth of the code markings.
In future tests, the objective will be to assess the maximum off-centring and inclination above which code reading becomes impossible. This data is needed to define the feasibility limits of the method and to compare these limits with the uncertainties on the positioning of the different handling machine components.
A focused sensor was used to obtain better lateral resolution than that obtained with a flat sensor. The distance between the sensor face and the code was established by the choice of the sensor's focal depth. The test involved scanning the sensor’s beam along the engraved code, i.e. down the generatrix of the
cylinder representing a mock-up of the subassembly head (see Fig. 2). This vertical movement (scanning along the z axis) was done by the sensor and not by the mock-up so as to simplify the process with respect to the bench in water and the displacement table. By scanning along the z axis, it was possible to obtain a one-dimensional C-scan of the amplitude along the generatrix. The reading or interpretation of the code required post-processing this C-scan. Post-processing is nearly not discussed in this study.
It is important to remember that the objective of this test was to get as close as possible to conditions for which:
• the ultrasonic beam is positioned in the same plane as the cylinder axis and is perfectly perpendicular to it,
• the distance between the generatrix of the subassembly head mock-up and the sensor face is equal to the focal depth of the sensor.
Fig. 2. Schematic diagram of the test in water.
The inclinations of the sensor and of the mock-up were adjusted manually. This adjustment proved difficult despite the care taken by the experimenter. Adjustment of the axial position (along the x axis in Fig. 2) and lateral position (along the y axis in Fig. 2) of the sensor was adjusted by moving the displacement tables of the water bench.
To be able to meet the second test objective, i.e. to estimate the reading resolution, a very refined sensor displacement increment was chosen for scanning: 0.1 mm (0.01 mm was also tried). A more refined increment can be chosen but this increment must remain consistent with that expected to be used in the ASTRID handling system.
IV. EXPERIMENTAL CONDITIONS
A. Ultrasonic transducer
It is stipulated in section III that a focused sensor was used to favour lateral resolution. A focused sensor, i.e. with the lens integrated into the sensor, was chosen instead of the "flat sensor + remote lens" combination to simplify implementation and control over the experimental conditions.
We chose to use a high-temperature ultrasonic transducer (TUSHT) for the purpose of representing this test in water compared with a real case (subassembly identification process in a reactor). Other transducers (electromagnetic transducers,
NETEC transducers, etc.) could have been used at the handling temperature of about 200°C, but they have not been entirely qualified and could not be permanently installed in the hot plenum reactor, contrary to TUSHTs which can withstand reactor power operating conditions.
It is generally accepted that the φ40 (piezoelectric crystal diameter in mm) TUSHT, which is more sensitive, is better suited than the φ15 TUSHT for telemetry measurements. The latter is generally used for listening due to its more omnidirectional nature (less directional), i.e. passive measurements. This is why the φ40 TUSHT was chosen.
The only focused φ40 TUSHT that was available at that time was the focused TUSHT T40F1 reference. It was also the only focused transducer that could be immersed in sodium from among all the φ15 and φ40 TUSHTs. The curvature radius of its lens (incorporated into the sensor's housing) was 148 mm.
The ultrasonic frequency f for analysis expected to be used in sodium is the highest resonance frequency of the TUSHT, i.e. 4.5 MHz, so as to benefit from the most refined focal spot. The frequency therefore applied during the test in water was also 4.5 MHz owing to the type of similarities chosen (see section 4.C).
According to the AFNOR standard [3], when focus is significant, i.e. Fopt < 0.4 I0 with Fopt representing the focal depth based on the laws of geometrical optics and I0 being the length of the near field, the acoustic focal depth Fac is very similar to the optical focal depth:
≈ = (1)
with Rc representing the curvature radius of the lens and n the refractive index defined by:
=
(2)
A steel lens in contact with sodium at 250°C has a refractive index of 2.2. The refractive index of the same lens in water at 20°C is equivalent to about 3.85. In water, for the focused TUSHT in consideration, Fopt≈ 200 mm < 0.4 I0 (I0≈ 1220 mm at 4.5 MHz). Therefore, the acoustic focal depth Fac in water for the TUSHT is 200 mm.
To apply (1) with sodium at a frequency of 4.5 MHz, the following focal depth was required: Fopt < 290 mm. Section 4.C shows that this criterion was met since the focal depth of 200 mm was retained to achieve the similarities chosen between the water and sodium tests.
To obtain the most refined focal spot and maximum ultrasonic energy on the engraved code, the face of the TUSHT was adjusted to a distance of 200 mm with respect to the generatrix for this water test.
The sensor was excited by a 250 V gate function lasting T = 110 ns so that 1⁄(2T) ≈ 4.5 MHz, i.e. so as to preferably excite the TUSHT's resonance peak at 4.5 MHz.
B. Ultrasonic similarities between sodium and water
By considering that the structures are infinitely stiff and that exponential attenuation is low, interactions between the
ultrasound and the structures can be considered as identical in water and in sodium on the condition that the same e/λ ratio is retained, where e represents the size of the structures and λ the wave length. As a reminder, λ= c/f (c the sound velocity in the liquid considered) with:
!"°$%
& !""°$%≈ 0.6 (3)
In practical terms, this meant:
• either manufacturing smaller structures than those used in a reactor (ratio of about 0.6), making it possible to use the same frequency as that in a reactor;
• or retain the same structural dimensions and use a lower frequency (ratio of 0.6). It is possible to keep the same sensor provided that it is capable of emitting at a lower frequency (by a factor of 0.6) than that to be used in sodium. It is worth pointing out that two TUSHT resonance frequencies, i.e. 2.9 and 4.5 MHz, practically fall within this ratio of 0.6 (0.64).
The first solution was chosen. This is because the two resonance peaks, 2.9 and 4.5 MHz, are not necessarily of the same amplitude. It therefore seemed more rigorous to apply a scale factor on the dimensions of the subassembly head mock-up, all the more so since the value of 0.6 does not generate any high constraints.
Again to maintain similarities between identification in sodium and the tests in water, a second ratio had to be retained: the e/σ ratio between the characteristic dimensions of the structures e (the lateral dimensions of the engraved markings in this case) and the diameter of the focal spot 2σ:
&
*& =* (4)
The diameters of the focal spot at the boundary of the first lobe and at –6 dB are defined by:
2, ≈ 2 × 1,2210 2, 2 3≈ 0
1 (5)
where φ is the diameter of the TUSHT's piezoelectric crystal, identical in sodium and in water. Equation (4) can therefore be written: & 0& 1 45& =0 1 45 (6)
As the similarity rule requires that the e/λ ratio be maintained, the following applies:
& = (7)
Therefore, the test in water is representative of reading in sodium using a φ40 TUSHT with a focal depth of Fac = 200 mm, thus with the following curvature radius (see (1)):
& = × 200 = 109 77 (8)
The focal spot diameters at the boundary of the first lobe and at –6 dB, in water at 20°C and in sodium at 200°C at a frequency of 4.5 MHz are respectively: 2σeau ≈ 3,9 mm, 2σeau– 6dB ≈ 1,6 mm and 2σNa ≈ 6,7 mm, 2σNa–6dB ≈ 2,7 mm.
C. Mock-up subassembly head
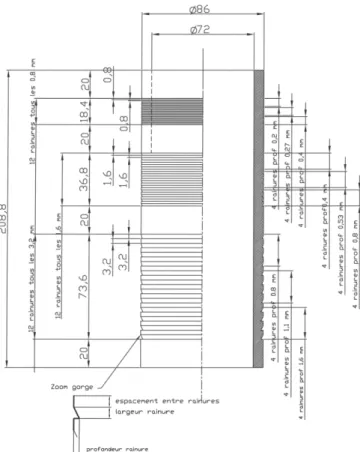
The mock-up of the subassembly head (see Fig. 3) only represents the top tubular and cylindrical part of the subassembly. Its dimensions (inner and outer diameters, code dimensions) are on a scale of 0.6 to comply with the sodium-water similarity criterion. It is made of stainless steel.
The outer cylindrical part of the mock-up provided a support for the engraved code. Three codes of different sizes were engraved on the same mock-up to save materials and especially to keep adjustment times to a minimum. In this test, the objective was not to study the coding but the geometry of the code markings. Therefore, various groove geometries were machined on the mock-up.
Triangular-shaped grooves (or notches) were chosen (see bottom of the Fig. 3) to benefit from CEA feedback. This solution made it possible to use a binary code: on-off with respect to specular reflection of the signal received by the ultrasonic sensor. When the beam hits a solid generatrix (not engraved), the reflected signal was fully directed towards the sensor which recorded a significant echo. When the beam hits a triangular notch, the oblique face of the notch reflected the echo in a direction located outside the sensor zone which therefore recorded no echo.
Fig. 3. Drawing of the subassembly head mock-up used in the water test.
The notch's cross-section was a right triangle whose hypotenuse was oblique compared with the ultrasonic beam whose focal spot had a diameter d = 2σ. One side corresponded to the width of the notch l, while the other corresponded to the depth of the notch p. The slope of the hypotenuse was given by the ratio l/p.
When steel surfaces are clean, water will wet the steel. When the steel surfaces are not very clean, the wetting quality (wet or not wet) is unevenly distributed and thus unpredictable. The surface of the mock-up - particularly the engraved code - was therefore cleaned with alcohol before its immersion in water. This test was thus only representative of identification in sodium when the subassembly has been wet by sodium, e.g. 48 hours at 400°C.
To simplify the draining of sodium and avoid retention when the subassembly is removed from the sodium, the notches are oriented in the opposite direction to that represented in Fig. 3: the horizontal side of the notch is located upwards. To be representative of sodium, the water test was performed with the mock-up upside down compared with the drawing in Fig. 3.
V. PARAMETERS
The following dimensions of the engraved code markings were used as test parameters:
• depth of the notches p so that the ratio l/p corresponded to the following values: 2, 3 and 4;
• width of notches l (equal to the spacing between the notches) corresponding to the following values: d/2, d and 2d, with d = 2σeau–6dB (i.e. 0.8 mm, 1.6 mm and 3.2 mm).
The three engraved codes included 12 notch locations. This is not a definitive choice. This number will be reviewed according to the needs defined by the safety or the operator. In our case, all the locations were taken up by notches. The depth
p was the only parameter that varied for each full engraved
code. All notches of the same code therefore shared the same width and were all equally spaced. The notches of the same depth were grouped next to each other (see Fig. 3).
The second parameter: the width of the notches (and also the spacing between notches since these two dimensions were made the same) was varied from one engraved code to the next. There were therefore three full codes to cover three values: 0.8 mm, 1.6 mm and 3.2 mm (see Table I).
TABLE I.SUMMARY OF THE CHARACTERISTICS OF THE THREE CODES
Code N°1 N°2 N°3 Number of notches 12 12 12 Width of notches (mm) 0.8 1.6 3.2 Spacing between notches 0.8 1.6 3.2 (mm)
Depth of notches (mm) 0.4;0.27;0.2 0.8;0.53;0.4 1.6;1.1;0.8 Height of code in water 18.4 36.8 73.6 (mm)
Height of code in sodium ∼31 ∼62 ∼123 (mm)
The height considered for the code represented the sum of the lengths of all 12 notches and 11 spaces. The free height required for the subassembly head (height of code + margin on each side of the code) is expected to be increased in the case additional criteria of redundancy or error detection/correction require increasing the number of coding bits.
VI. RESULTS
As shown in section II, the output data of this test is the one-dimensional C-scan of the amplitude obtained with the ultrasonic shots performed during a full vertical scan of the mock-up comprising three codes. To construct this C-scan, the peak-to-peak amplitudes of the echoes reflected by the mock-up and recorded by the TUSHT depending on the vertical position of the latter are plotted. Each point corresponds to an ultrasonic shot and a given position of the transducer. Each point is thus separated by the distance representing the transducer's displacement increment.
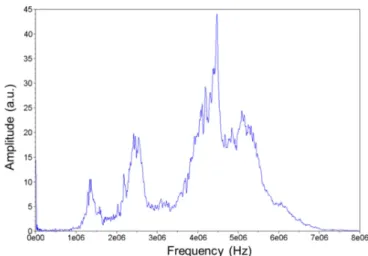
To avoid overloading the acquisition PC's memory, the acquisition software only recorded the time signal (amplitude in Volts as a function of time) of each shot in a small time window covering the reflected echo. The duration of the window was 50 µs (see Fig. 4). The peak-to-peak amplitude was therefore calculated by determining the difference between the maximum and minimum amplitude in this window. In the Fourier transform (see Fig. 5) of the echo in Fig. 4, the predominance of the resonance peak at 4.5 MHz appears very clearly.
Fig. 4. Time window covering the echo reflected by the mock-up.
The C-scan of the amplitude obtained with intervals of 0.1 mm without is shown in Figure 6. The vertical axis, z, was oriented towards the bottom on the water bench. Consequently, the position 0 mm in the graph, corresponding to the starting position of the scan, is actually the highest position. The test therefore corresponds to a vertical displacement of the sensor towards the bottom over 220 mm. The mock-up was 208.8 mm long in total, with the scan starting slightly above it and ending slightly below it.
From left to right, the three codes - No. 3, No. 2 and No. 1 (see Table 1) - can be clearly distinguished. At both ends of the mock-up and between each code, the smooth areas (no engravings) are 20 mm long and are clearly visible since they are represented by high amplitude plateaus.
These plateaus appear to be aligned along an elliptical arch. The inclination of the mock-up was very difficult to adjust with the support that was available at the time of the test. The experimenter tried as best possible to align the axis of the
mock-up so it was parallel with that of the sensor's displacement. The experimenter then made sure the amplitude maximum (generatrix at the maximum energy of the focal spot, i.e. about 200 mm from the sensor) was roughly located in the middle of the mock-up - at 110 mm in the graph - so that amplitude offset due to parallelism error was as low as possible between the start and end of the scanning operation.
Fig. 5. Fourier transform of the echo reflected by the mock-up.
The bumpy profile of the first plateau can be explained by the high roughness of this area. The manufacturer of the mock-up seems to have taken less care when machining this end of the mock-up.
Fig. 6. One-dimensional C-scan of the amplitude with two sets of thresholds. Solid line: high threshold. Dashed line: low threshold.
With a sensor displacement increment that is ten times smaller (0.01 mm instead of 0.1 mm), the spatial sampling of the C-scan proves to be much more precise but the reading resolution is not improved. The 0.1 mm increment therefore seems largely sufficient for the acoustic resolution of the method.
A. Parameter: notch width
Ideally, the on/off nature of this coding should result in a maximum amplitude signal Ap-pmax equal to that measured in
the smooth areas 20 mm long between the notches and zero amplitude (no echo reflected) on the notches. The real situation is not far from the ideal case for code No. 3 whose notches were 3.2 mm wide. The maximum values corresponding to the peaks between each notch is located between 1.6 and 1.75 V of peak-to-peak amplitude, compared with 1.6 and 1.8 V for the plateaus. Though the minimum values never reach zero, they are very low: between 0.1 and 0.25 V. Therefore, the mean difference between the positions corresponding to a notch, and the spacing between two notches, is around 1.5 V for code No. 1, i.e. almost 90% of the ideal case (1.7 V).
For code No. 2, the minimum corresponding to the notch is higher than that for the previous code: around 0.5 V, i.e. about 30% of the maximum signal. The reading quality deteriorates compared to code No. 3 because the amplitude was further from zero. The mean difference between the maximum and minimum is about 0.8 V, i.e. a little less than 50% of the ideal case. The 1.6 mm wide notch is therefore not as well detected as the 3.2 mm wide notch, even though its existence clearly appears on the C-scan.
For code No. 3, the results prove to be too poor. Though the existence of a code can be seen, it is not possible to clearly differentiate the different notches. A code with notches and free spaces (no notches) would be impossible to decipher.
Logically, it can be inferred that the lateral resolution is directly related to the lateral size of the focal spot. It is not surprising that the C-scan obtained with code No. 3 is very similar to the ideal on-off case (Ap-pmax or 0) insofar as the width of the notches (3.2 mm) practically reaches the diameter of the focal spot 2σeau ≈ 3,9 mm at 4.5 MHz (frequency at which the ultrasonic energy is preponderant). For the same reason, the reading dynamics is significantly degraded for the other codes whose width becomes significantly smaller than this diameter.
The wave length in water at 4.5 MHz is about 0.3 mm. The diffusion conditions for the three notch widths (3.2 - 1.6 - 0.8) are specular (or geometrical), though the conditions for the 0.8 mm width came close to resonant. At this width, in addition to the fact that the size of the focal spot makes it impossible to correctly separate two notches, some of the ultrasonic energy is lost by diffraction (and wrongly sent back to the sensor whereas it should be outside its field of vision).
To avoid deteriorating the lateral resolution of the reading, the notch width must therefore be wider than the wave length, but also and especially not smaller than the diameter of the focal spot. To be able to reduce the code length (by reducing the width of the notches or the spacing), a solution would be to increase the ultrasonic frequency. Furthermore, it is possible to consider modifying the TUSHT design. Indeed, a larger piezoelectric crystal diameter φ would be a solution as shown in formula (5). Lastly, a simpler solution would be to choose a sensor with a smaller focal depth Fac.
B. Parameter: notch depth
Regardless of the code, the impact of the notch depth seems insignificant. This parameter is indeed only meant to influence
the minimum values. In theory, the notches would no longer be able to completely deviate the ultrasonic beam outside the sensor's field of view if the notch slopes were too small, therefore resulting in a non-zero value. And the smaller the slope, the greater the value. Fig. 6 shows that amplitude variations appear between the notches of a same code, yet these variations are not clustered together by groups of four notches (as they were for the p values). In light of the amplitudes for the clearest code (code No. 3), the smallest slope, corresponding to the smallest depth: p = 0.8 mm and a
l/p ratio of 4, proves to be sufficient because it is as efficient
as the others in making the echo's amplitude drop. This value of p = 0.8 mm can therefore be applied for a focal depth of 200 mm. However, it must be checked that it is independent of this focal depth. This value may prove insufficient for a shorter focal depth.
C. Example of a simple reading method
For the cases covered in this study where the notch width was equal to that of the spacing between the notch locations, the following reading method was recommended. This method consisted in recording the minimum and the maximum amplitude within a small vertical window framing the centre of each location and comparing them respectively to two thresholds: a low and a high threshold. The high threshold is much higher than the low threshold. The minimum must be lower than the low threshold and the maximum must be lower than the high threshold for a notch to be detected. The maximum must be higher than the high threshold and the minimum must be higher than the low threshold to detect an empty location (no notch). The two other cases would not make it possible to decide whether there was a notch or not and would prevent subassembly identification. In the example given in Fig. 6, the set of red thresholds for which the high threshold corresponds to (1⁄2 Ap-pmax + 0.2 Ap-pmax) and the low threshold to (1⁄2 Ap-pmax – 0.2 Ap-pmax), can be used to correctly identify code No. 3 but not code No. 2 because at least one notch dip is not below the low threshold. As for the green thresholds where the high threshold corresponds to (1⁄2
Ap-pmax + 0.15 Ap-pmax) and the low threshold to (1⁄2 Ap-pmax – 0.15 Ap-pmax), both codes were correctly identified: No. 2 and No. 3.
VII. CONCLUSION
Ultrasound is being considered for the purpose of identifying subassemblies within the scope of preventing handling errors. This identification is based on reading an engraved code on the subassembly by an emitting/ receiving ultrasonic sensor. This reading is carried out in sodium by a sensor directly immersed in sodium. It is thus not necessary to uncover part of the subassembly before being able to identify it.
The CEA has high-temperature ultrasonic transducers (TUSHT) capable of operating in sodium under handling conditions (about 200°C). Furthermore, these sensors are also capable of resisting nominal power conditions and therefore to remain in sodium for several years.
The use of ultrasound therefore appears to be a promising solution. However, ultrasound (at least for methods not using roughness-based diffusion) is sensitive to alignment defects. Furthermore, the ultrasonic trajectory is sensitive to heterogeneities in the sodium environment, i.e. temperature gradients, sodium velocity and bubbles. These disruptive phenomena are complex which makes them difficult to quantify. The test, whose results are reported in this document, therefore aimed at being representative of a "pragmatic" identification configuration in which the disruptive aspects were limited as much as possible:
• Measurement (reading) as close as possible to the code,
• Subassembly freed from the lattice to limit off-centring and inclination of the subassembly in relation to the ultrasonic beam,
• No liquid wave guide (potential bubble trap),
• Reading at the top of the subassembly to take advantage of less "agitated" sodium than that near the core outlet. The objective of this water test was to first demonstrate the feasibility of reading a code under these favourable conditions, i.e:
• low off-centring and inclination,
• linear movement of the code in relation to the ultrasonic beam,
• displacement increment between each well-controlled ultrasonic pulse.
The objective was also to determine the reading resolution of the code markings, i.e. reading resolution as a function of the width (and spacing between these marks) and the depth of the code markings.
Good similarity between sodium and water is obtained by using a scale factor of 0.6 for the subassembly head mock-up and by maintaining the sensor's focal depth (different lens curvature radii between sodium and water tests). The test consisted in reading three engraved codes, i.e. scanning a focused TUSHT beam down a generatrix of a mock-up (essentially a cylindrical tube). Each engraved code was composed of 12 triangular-shaped notches which each deviated the beam outside the sensor's “field of view”. The resulting one-dimensional C-scan for each code can be likened to a binary code expressing the subassembly type and number.
The two parameters investigated were related to the sizes of the notches: width and depth. The C-scan obtained shows that the lateral resolution is most probably related to the lateral size of the focal spot. The C-scan obtained with code No. 3 is very similar to the ideal on-off case insofar as the width of the notches (3.2 mm) practically reaches the diameter of the focal spot 2σeau ≈ 3,9 mm at 4.5 MHz (frequency at which the ultrasonic energy is preponderant). For the same reason, the reading dynamics were significantly degraded for the other codes whose width became significantly smaller than this diameter. The code nevertheless remained legible for notches twice as thin (1.6 mm wide). Yet in this case, the set of thresholds integrated into the reading process made the identification less robust. The impact of the notch depth parameter seemed to be minor in the range under investigation, regardless of the core.
This test therefore allows us to be optimistic in terms of the feasibility of such a method in sodium in ASTRID. The robustness of the method now needs to be assessed in subsequent water tests. For this reason, additional tests in water will be carried out in 2015. Their objective will be to assess the maximum off-centring and inclination above which code reading becomes impossible. This data is needed to define the feasibility limits of the method and to compare these limits with the uncertainties on the positioning of the different handling machine components. Finally, sodium tests will be conducted to qualify the method for reactor conditions.
REFERENCES
[1] C. Lhuillier et al., "Generation IV nuclear reactors: under sodium ultrasonic transducers for Inspection and Surveillance", 3rd International Conference on Advancements in Nuclear Instrumentation, Measurement Methods and their Applications (ANIMMA), Marseille, France, 23-27 June 2013.
[2] J.-L. Berton and G. Loyer, "Continuous monitoring of the position of two subassemblies head of Phénix at 350 MWth power and 550°C temperature", SMORN VII Conference, 19-23 June 1995 in Avignon (France).
[3] Afnor, Normalisation française, "Essais non destructifs – Ultrasons – Faisceaux acoustiques – Généralités", A 09-325, September 1987.