38 doi:10.1017/S1551929513001089 www.microscopy-today.com • 2013 November
Huygens STED Deconvolution Increases Signal-to-Noise
and Image Resolution towards 22 nm
Vincent Schoonderwoert,
1* Remko Dijkstra,
1Grazvydas Luckinavicius,
2Oliver Kobler,
3and
Hans van der Voort
11Scientific Volume Imaging bv, Laapersveld 63, 1213VB, Hilversum, The Netherlands
2Ecole Polytechnique Fédérale de Lausanne, Institute of Chemical Sciences and Engineering (ISIC), 1015 Lausanne, Switzerland 3Leibniz-Institute for Neurobiology, Combinatorial Neuroimaging (CNI), Brenneckestrasse 6, 39118 Magdeburg, Germany
Introduction
Image restoration aims to make optimal use of the data provided by the light microscope to recover the object being imaged; in other words, to “figure out what the microscope is actually trying to tell us.” To achieve this, the distortions introduced by the imaging process need to be undone insofar possible.
The most important one of these distortions is the resolution-limiting effect of diffraction. In most microscope types diffraction results in a hard limit to which high spatial frequencies, corresponding to fine details in objects, are transmitted to the image. The success rate in restoring an object by deconvolution depends on the following: (a) 3D shape, (b) extent of this limiting bandpass region, (c) the need to and success rate in recovering lost frequencies beyond the bandpass region, and (d) the object itself.
Stimulated emission depletion (STED) microscopy can extend the practical bandpass region of the confocal system that—in theory—is unlimited. The absence of a hard limit would seem to make deconvolution of STED data an easy job with potentially a huge gain in resolution over the raw data, gracefully limited by the noise level. However, the noise level in STED data tends to be high because of the limited number of photons available per pixel. Two more issues stand in the way of success: the point spread function (PSF) shape does not depend only on stable factors from the optics, but also on more volatile factors such as laser power and the fluorescent behavior of the specimen itself. Furthermore, thermal drift is often seen to cause the PSF to be deformed by sheering.
The Huygens software described in this article corrects the sheering and uses a measured or computed STED PSF to deconvolve and thereby improve image contrast and resolution. We describe here new STED image data before and after deconvolution, showing after deconvolution a signal increase of eight times and an improvement of the lateral full width at half maximum (FWHM) resolution toward 22 nm. In many practical cases a resolution improvement of two times in the axial and lateral direction can be obtained, allowing more reliable visualization and quantification of 3D-4D multichannel image data.
Deconvolution
The spatial resolution of a classical wide-field microscope is limited to the light optical diffraction limit, which is at best 200 nm for the smallest practical wavelength. This limit is still orders of magnitude larger than the size of cellular organelles, for example synaptic vesicles (30–50 nm) or single proteins (~2 nm on average) [1], making it very difficult to resolve
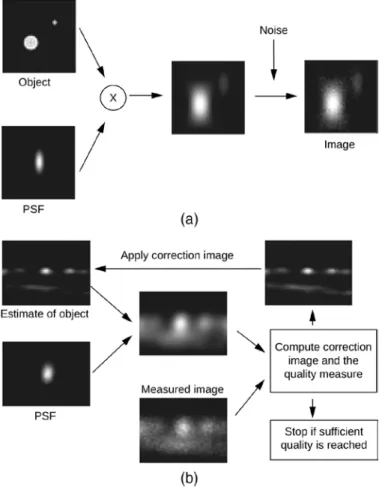
dynamic cellular processes or distinguish individual labeled proteins. With the introduction of confocal scanning and spinning disk microscopes that reject out-of-focus light, higher spatial resolution in the axial direction became possible. However, lateral resolution is only modestly improved as compared to wide-field imaging [2], and a diffraction limit remains. Diffraction-induced resolution loss is typical for all existing optical systems; this makes fluorescent light sources within the sample appear as blurred objects in the image. The blurring process can be described as a convolution whereby each point in the image is substituted by a three-dimensional PSF weighted by the intensity of every point (see Figure 1a). However, there are more distortion factors added to the
Figure 1: Huygens Deconvolution. (a) The convolution process (indicated by the “x”) blurs the object by replacing every point in the sample with the PSF. Additional noise is introduced during the actual recording of the signal. (b) Huygens non-linear deconvolution reverses this process.
the most precise sectioning...
incomparable durability
Free Customer Service
Sectioning tests with biological and
material research specimens of all
kinds. We send you the sections
along with the surfaced sample, a
report on the results obtained and a
recommendation of a suitable knife.
Complete discretion when working
with proprietary samples.
Re-sharpening and
Reworking Service
A re-sharpened Diatome diamond knife
demonstrates the same high quality as
a new knife. Even knives purchased in
previous years can continue to be
re-sharpened. The knives can be reworked
into another type of knife for no extra
charge, e.g. ultra to cryo or 45° to 35°.
Exchange Service
Whenever you exchange a knife we
offer you a new Diatome knife at an
advantageous price.
DiATOME US • P.O. Box 550 • 1560 Industry Rd. • Hatfield, Pa 19440
Tel: (215) 412-8390 • Fax: (215) 412-8450 • email: [email protected] • www.emsdiasum.com
diamond knives
ultra 45° • cryo • histo • ultra 35° • STATIC LINE II cryo-P • cryo immuno • ultra sonic
cryotrim 45 and 25 ultra • AFM & cryo AFM • cryo 25°
40 years of development,
manufacturing, and
customer service
40 www.microscopy-today.com • 2013 November STED Deconvolution
deconvolution highly valuable for STED imaging. Therefore, we developed a special STED deconvolution module for the Huygens software. By calculating the physical PSF based on the microscopic (STED) parameters (Figure 3), or by using an experimentally measured PSF, Huygens can perform non-linear iterative deconvolutions on STED image data (see Box). In this article, we describe a few STED examples and how they benefit from Huygens STED deconvolution.
Signal-to-Noise Ratio
As mentioned above, STED images tend to be very noisy. Combining a priori knowledge of both the PSF and the Poisson behavior of the photon noise in the collected data allows iterative recorded image, the most prominent one being noise, which is
mainly caused by the limited number of photons recorded in each pixel, causing the noise to follow a Poisson distribution.
Because blurring is equivalent to attenuation of fine spatial frequencies by the microscope, it can to some extent be undone by back-amplification. However, the problem with such an inverse filtering technique is that it only takes the blurring into account and not the noise. To deal with both the deterministic and the stochastic distortions, we need to use more advanced algorithms [3]. The basic idea of iterative image restoration methods is to estimate the object using some kind of quality measure. A very simple example of this is the “Van-Cittert” method [4], where a synthetic image of a (smart) initial estimate of the object is compared to the measured image (Figure 1b). The outcome of this comparison is used to improve the estimate of the object, from which again a new synthetic image is computed by convolution with a PSF. This synthetic image is again compared to the measured image, and so on. When the “difference” between the synthetic image and the measured image reaches a predefined criterion, the procedure is stopped. In general, the comparison method used defines a quality mea- sure and ultimately determines the quality of the final result.
This process of deconvolution can be applied to all light optical images but requires accurate knowledge of the PSF to be effective. The PSF structure can be determined through either empirical measurements by imaging a point source object such as a sub-resolution bead, or it can be modeled according to the properties of the optics employed, as specified within the stored image meta-data.
STED Deconvolution
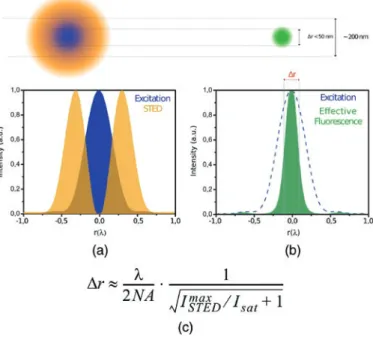
Within the last twenty years, researchers have tried to overcome the diffraction-limited resolution barrier by developing novel nanoscopic techniques that are minimally invasive, that are suited for studies in living cells and other dynamic systems, and that offer high spatial resolution. In 1994, Stefan Hell presented the STED theory by which the diffraction limit in microscopy can be circumvented [5]. A STED microscope much resembles a confocal microscope, but it has an additional laser with a focus deformed into a doughnut shaped distribution (see Figure 2). The wavelength of this laser is chosen so that it stimulates emission of the excited fluorophores to a wavelength that is filtered out, thereby depleting the fluorophores in the outer region of the diffraction-limited excitation spot. By increasing the intensity of the depletion beam, the outer regions are depleted more, reducing the size of the remaining spot of excited fluorophores.
Because of its high spatial resolution and relatively fast image acquisition, STED has proven to be one of the most promising super-resolution light optical techniques. The first commercially available STED system was introduced by Leica Microsystems GmbH in 2007. The latest TCS SP8 STED system with gated-STED technology combines a continuous wave (CW)-STED laser with time-gated detection and has a specified optical resolution below 50 nm (Figure 3).
Many STED images have a low signal-to-noise ration (SNR) because many excited fluorophores are excluded from detection by a limited window in space (due to the depletion beam) and time (due to gating). This, together with the blurring characteristics of the STED microscope and optics, makes
Figure 2: STED theory. (a) The doughnut-shaped STED beam (orange) depletes excited fluorophores in the outer region of the excitation spot (blue), confining the fluorescent volume (green). FWHM (Δr) of the effective fluorescence probability h(r) decreases by STED (b) and approximately scales with the inverse square root of the STED intensity (c). If the STED intensity (ISTED) = 0, this equation reduces to Abbe’s diffraction limit. ISAT is the saturation intensity and is fluorophore-dependent.
Figure 3: STED PSFs. PSFs show a lateral FWHM of 210 nm, 80 nm, and 50 nm for a confocal, CW-STED, and gated-CW-STED system, respectively. PSF size is not reduced in the axial direction by STED.
vortex-type STED imaging and remains at equivalent confocal values (Figure 3).
With all STED images tested so far, a resolution improvement of at least two times in both the lateral and also axial direction can be achieved with deconvolution. A prerequisite for obtaining such good results is that the sampling of the images should meet the Nyquist criterion. As mentioned earlier, the STED microscope does not have a hard band-limit, algorithms to effectively reduce the noise while boosting the
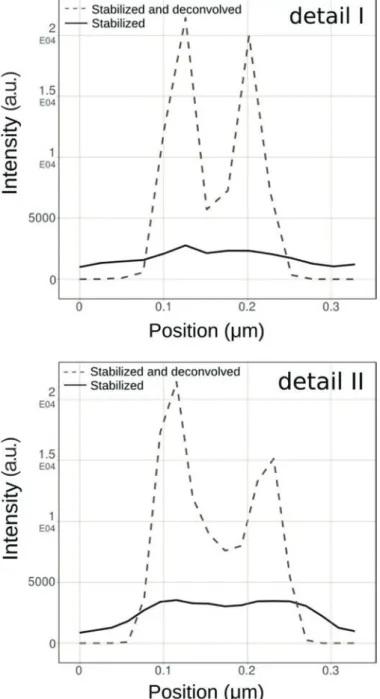
contrast of the structures of interest. The Huygens classical maximum likelihood estimation (CMLE) deconvolution algorithm uses a regularization parameter to penalize solutions that amplify any photon noise, thereby significantly reducing the presence of artifacts in the final deconvolution result. Application of CMLE deconvolution to STED images, obtained from several of our customers, frequently displayed a signal-to-noise increase of more than eight times. Figure 4 shows an example of pulsed-STED images of doughnut-shaped structures within the neuromuscular junction of Drosophila melanogaster larvae that had been stained with the presynaptic active zone marker Brp (2nd antibody conjugated to Atto647N) [6]. After image stabilization and deconvolution, clear “holes” can be observed within these structures that can hardly be identified from the raw STED data. This is even more apparent in the two detailed views (Figure 4) and their corresponding line intensity plots through the doughnut-shaped structure (Figure 5). These plots also confirm the observed signal gain.
Resolution
Resolution measurements in STED data of around 80 nm have been frequently reported, and with gated-STED tech- nology lateral resolution values of at least 50 nm are within reach [7]. Still, these data remain subject to blurring by the STED PSF, setting a practical lower limit of structures to about 50 nm. Furthermore, the axial resolution is not improved by the
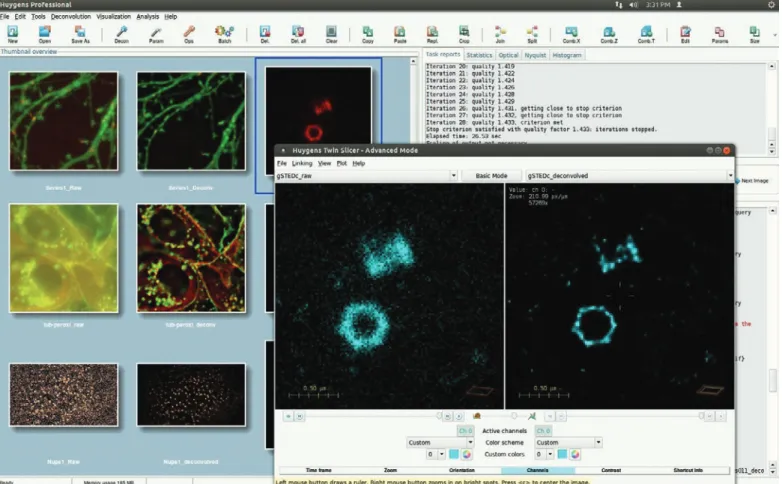
Box: Deconvolution at work. STED image parameters are automatically read by Huygens and can also be extracted from bead images using the PSF Distiller wizard. The Deconvolution Wizard supports histogram inspection, automatic stabilization, background subtraction, and parameter optimization. Results can be easily compared with the Twin Slicer.
Figure 4: STED deconvolution reveals more biological detail. Presynaptic active zone marker Brp (2nd antibody conjugated to Atto647N) in the neuromuscular junction of D. melanogaster larvae displays clear holes in doughnut-shaped structures after stabilization and Huygens STED deconvolution.
42 www.microscopy-today.com • 2013 November STED Deconvolution
Object Stabilization
The high resolution obtainable in STED microscopy makes image acquisition susceptible to any small drift or movement between the sample (stage) and the objective while scanning. Consequently, a STED image stack is easily sheered along Z. Without drift correction on such images, deconvolution will not be able to provide an optimal result, because the applied PSF will not match with the sheered blurring within the image. We therefore developed a specific option in Huygens that is dedicated to the stabilization of 3D STED images prior to deconvolution. An example of a 3D pulsed-STED image (sampling interval: 25 × 25 × 126 nm, XYZ) subjected to lateral drift during image acquisition is shown in the left panel of Figure 8. Deconvolution of this image will improve the resolution and SNR but will not correct for the drift. If the image is stabilized with the Huygens Object Stabilizer prior to deconvolution, drift is corrected and a significant improvement of both the SNR so there is no well-defined Nyquist sampling rate, but for
current systems sampling distances between 15 and 25 nm in
XY and 130 nm in Z [8] yield optimal results. For example,
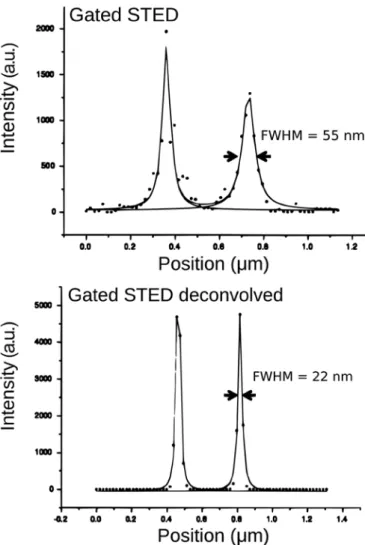
with a single-plane STED image (sampling intervals: 18.9 nm in XY) from a centriole structure, a respectable resolution of 55 nm was obtained with a Leica gated-STED system that could be two times further improved with STED deconvolution toward an ultimate resolution of 22 nm (Figures 6 and 7). The fact that these centriole structures are axially elongated greatly benefits the signal from these structures and thus the STED imaging and deconvolution. Nevertheless, we anticipate that the acquisition of additional Z planes will push the resolution after deconvolution below 22 nm.
Figure 5: Line intensity plots of detailed views in Figure 4 indicate a signal increase (>8 times) after deconvolution. Image brightness was adjusted for optimal visualization.
Figure 6: FWHM improvement toward 22 nm. Single-plane image recorded with a point-scanning confocal. Same specimen shows more detail with gated-STED imaging, before and after Huygens STED deconvolution. Images show a centriole structure that is stained (2nd antibody conjugated to Chromeo488).
ideal PSF model. For wide-field or confocal imaging, typically 110–200 nm beads are recommended. Multiple beads recorded will be automatically detected and averaged by the Huygens PSF Distiller. This distiller uses a reverse deconvolution method to extract the PSF. As a bonus, possible chromatic shifts will be estimated and can be subsequently corrected with a Huygens Chromatic Shift Correction tool. For STED imaging, the bead diameter needs to be less than the expected raw resolution, which is less than 50 nanometers. It might be specifically interesting to investigate the saturation curve (inverse square root law) of the STED system so that the STED saturation factor can be experimentally determined. Alternatively, the Huygens Distiller is able to automatically estimate the STED-specific parameters (saturation factor, immunity fraction) from PSF measurements, which can be included in the deconvolution process to further optimize the results.
Conclusion
STED microscopy has proven to be a valuable super- resolution technique for resolving objects that are smaller than the diffraction-limited resolution. Deconvolution of these STED images with Huygens pushes this even further. Typically, Huygens offers two-fold improvements of STED images in X,
Y, and Z resolution and increases SNRs by a factor of eight.
Deconvolution can be applied to all 2D-4D STED images, including those from pulsed, CW, and gated STEDs from Leica Microsystems GmbH. Stabilization of 3D STED images is essential for deconvolution because this corrects for lateral drift, which would normally distort the structure of the STED PSF and affect the deconvolution result. STED image parameters, necessary for modeling the STED PSF correctly, are read from the (Leica Lif) image metadata but can also be extracted from fluorescent bead images.
Similar to wide-field and confocal deconvolution, we are confident that STED deconvolution will prove to be an important tool for microscopy data interpretation. Moreover, the significant SNR increase that can be gained with Huygens deconvolution allows researchers to redesign their (live cell) imaging experiments using shorter exposure times and minimizing bleaching and photo-toxicity issues.
and axial resolution may be obtained. The improvement in structural detail is very clear from the 3D iso-surface rendered image (see Figure 8). Because of the change of the structure after stabilization, quantification of the improvement in Z using a line intensity plot cannot be accurately performed. A rough estimation, however, suggests that a two-times axial improvement with deconvolution can be obtained (from 540 to 230 nm), which can be even further optimized by ~20% if the image is first stabilized (approximately 180 nm).
PSF Distiller
The PSF can be automatically computed based on a model of the microscope and the microscope parameters such as lens numerical aperture (NA), wavelength of the used fluorophores, and pinhole size and spacing (the latter only for confocal and spinning disk systems). Usually, these parameters are read from the metadata of the image file. If a refractive index (RI) mismatch between sample and lens medium exists, spherical aberration will be more severe with increasing imaging depth, and the PSF shape will change accordingly. Huygens can automatically take depth-specific PSFs into account during deconvolution, which is the preferred approach in case of a RI mismatch when samples are thicker than 25 microns. If this situation does not apply, the experimental PSF would be a better choice. Such a PSF can be measured experimentally from bead images and will include all the physical deviations from the
Figure 8: Image stabilization is essential for STED deconvolution. A 3D pulsed-STED image of centrioles was subjected to Huygens STED deconvolution without, and with, prior image stabilization. 3D stacks iso-surface rendered with the Huygens Surface Renderer show the importance of image stabilization prior to deconvolution.
Figure 7: A line intensity profile through the centriole ring (diameter 240 nm), of the structure shown in Figure 6, was fitted to a Lorentzian function.
44 www.microscopy-today.com • 2013 November STED Deconvolution
Note added in proof: Huygens offers a newly developed PSF generator for the upcoming Leica STED-3D.
Acknowledgment
The authors from Scientific Volume Imaging b.v. would like to thank all the people from Leica Microsystems for the fruitful collaboration and sharing of data, especially Dr. Jochen Sieber, Dr. Nathalie Garin, Dr. Tanjef Szellas, Dr. Arnold Giske, and Ulf Schwarz are gratefully acknowledged. We also want to express our appreciation to our colleague Marja van Aken (SVI) for making the figures and to all Huygens users that have discussed their (preliminary) STED image data with us. References
[1] For references see http://bionumbers.hms.harvard.edu. [2] G Cox and CJR Sheppard, Microsc Res Techniq 63 (2004)
18–22.
[3] PJ Verveer and TM Jovin, J Opt Soc Am A 14 (1997) 1696–1706.
[4] PH Van Cittert, Zeitschrift für Physik 69 (1931) 298–308. [5] SW Hell and J Wichmann, Opt Lett 19(11) (1994) 780–82. [6] RJ Kittel, C Wichmann, TM Rasse, W Fouquet, M Schmidt,
A Schmid, DA Wagh, C Pawlu, RR Kellner, KI Willig, SW Hell, E Buchner, M Heckmann, and SJ Sigrist, Science 312(5776) (2006) 1051–54.
[7] G Donnert, J Keller, R Medda, MA Andrei, SO Rizollo, R Lührmann, R Jahn, C Eggeling, and SW Hell, P Natl
Acad Sci USA 103(31) (2006) 11440–45.
[8] For more information see http://www.svi.nl/ NyquistCalculator.