HAL Id: hal-02399402
https://hal.archives-ouvertes.fr/hal-02399402
Submitted on 9 Dec 2019HAL is a multi-disciplinary open access archive for the deposit and dissemination of sci-entific research documents, whether they are pub-lished or not. The documents may come from teaching and research institutions in France or abroad, or from public or private research centers.
L’archive ouverte pluridisciplinaire HAL, est destinée au dépôt et à la diffusion de documents scientifiques de niveau recherche, publiés ou non, émanant des établissements d’enseignement et de recherche français ou étrangers, des laboratoires publics ou privés.
ReAsH/tetracystein-based correlative light-electron
microscopy for HIV-1 imaging during the early stages of
infection
Iryna Lysova, Coralie Spiegelhalter, Eleonore Real, Sarwat Zgheib, Halina
Anton, Yves Mély
To cite this version:
Iryna Lysova, Coralie Spiegelhalter, Eleonore Real, Sarwat Zgheib, Halina Anton, et al.. ReAsH/tetracystein-based correlative light-electron microscopy for HIV-1 imaging during the early stages of infection. Methods and Applications in Fluorescence, IOP Science, 2018, 6 (4), pp.045001. �10.1088/2050-6120/aacec1�. �hal-02399402�
1
ReAsH/tetracystein-based Correlative Light-Electron Microscopy for HIV-1
imaging during the early stages of infection
Iryna Lysova1,, Coralie Spiegelhalter2,, Eleonore Réal1, Sarwat Zgheib1 , Halina Anton1*, Yves Mély1*
1 Laboratoire de Bioimagerie et Pathologies, CNRS UMR 7021, Strasbourg University, Faculty of Pharmacy, 74 route du Rhin, Illkirch, France
2 Institut de Génetique et de Biologie Moléculaire et Cellulaire , CNRS UMR 7104 - Inserm U 1258, 1 rue Laurent Fries, Illkirch, France
*Corresponding authors: halina.anton@unistra.fr; yves.mely@unistra.fr Equally contributed to this work
Abstract :
Visualization of viruses in the host cell during the course of infection by correlative light-electron microscopy (CLEM) requires a specific labelling of the viral structures in order to recognize the nanometric viral cores in the intracellular environment. For Human immunodeficiency virus type 1 (HIV-1), the labelling approaches developed for fluorescence microscopy are generally not suited for transmission electron microscopy (TEM), so that imaging of HIV-1 particles in infected cells by CLEM is not straightforward. Herein, we adapt the labeling approach with a tetracystein tag (TC) and a biarsenical resorufin-based label (ReAsH) for monitoring the HIV-1 particles during the early stages of HIV-1 infection by CLEM. In this approach, the ReAsH fluorophore triggers the photo-conversion of 3,3-diaminobenzidine tetrahydrochloride (DAB), generating a precipitate sensitive to osmium tetroxide staining that can be visualized by transmission electron microscopy. The TC tag is fused to the nucleocapsid protein NCp7, a nucleic acid chaperone that binds to the viral genome. HeLa cells, infected by ReAsH-labeled pseudoviruses containg NCp7-TC proteins exhibit strong fluorescent cytoplasmic spots that overlap with dark precipitates in the TEM sections. The DAB precipitates corresponding to single viral cores are observed all over the cytoplasm, and notably near microtubules and nuclear pores. This work describes for the first time a specific contrast given by HIV-1 viral proteins in TEM images and opens new perspectives for the use of CLEM to monitor the intracellular traffic of viral complexes.
2
Introduction
Imaging of human immunodeficiency virus 1 (HIV-1) in an infected cell during the early stages of infection represents a challenging task. Photon or electron microscopies both require specific labeling of viral structures that does not alter their functions or decrease the infectivity of the virus. Genetic fusions of viral proteins (Vpr, Integrase or Matrix) with fluorescent proteins or tags have been used to track HIV-1 in the early steps of infection by fluorescence microscopy [1-5]. More recently, simultaneous labeling of viral DNA by click chemistry or FISH (Fluorescence In Situ Hybridization) and viral capsid by high affinity peptides or antibodies permitted to investigate the uncoating process [3, 6-10]. However, fine modifications of the viral structures and their location relative to celullar organelles could not be observed in these studies due to the resolution limits of fluorescence microscopy.
Such information can in principle be provided by electron microscopy (EM) techniques. While a number of EM studies focused on the late stages of infection and notably on the assembly process at the plasma membrane, where newly synthetized virions are easily identifiable by their morphology [11-16], only a few EM studies [17] reported on the early stages of infection, due to the paucity of specific labeling strategies for monitoring the viral complexes by EM. To circumvent this limitation, EM is used in combination with other imaging techniques in a correlative approach (CLEM) [18]. A pioneering photonic-Cryo-TEM (transmission electron microscopy) correlative study was applied to image HIV-1 during fusion to the plasma membrane and shortly after the release of the viral core into the infected cell [19]. In cells infected with HIV-1 pseudotyped viruses, the correlation of the Vpr-eGFP fluorescence images with the EM images of the typical conical capsid allowed the uncoating process to be followed as a function of time. This study showed that already after 40 minutes of infection, more than 50% of theVpr-containing fluorescent particles did no longer contained a conical capsid in TEM images, and were thus already uncoated. Similarly, the fluorescence signals of HeLa cells infected with HIV-1 pseudotyped viruses containing mCherry-Vpr were correlated to electron dense curved or conical shapes in a set of multiresolution focused ion beam scanning electron microscopy (FIB-SEM) images [20]. The same approach was also used to study the topography of virus-containing compartments after cell to cell transmission of HIV-1 viruses via virological synapses [21]. In all these studies, the HIV cores do not provide a specific EM signal, so that their identification is only based on the recognition of their characteristic conical shapes, limiting the observations to events prior to the capsid disassembly (uncoating). Therefore, EM observation of uncoated HIV-1 cores needs previous structure identification through the photonic image of a CLEM study.
3
In order to solve this problem, we applied herein, an experimental approach that generates a specific contrast for both photonic and electron microscopy. To produce fluorescent HIV-1 particles that provide EM contrast, we fused a tetracystein (TC) tag to the nucleocapsid domain of the Gag polyprotein precursor [22]. After Gag cleavage by the viral protease, the TC tag is at the C-terminus of the mature nucleocapsid protein (NCp7) in the infectious mature viral particle. NCp7 is a nucleic acid chaperone protein that plays key roles throughout the HIV-1 viral cycle [23-29]. In the mature virion, approximately 2000 NCp7 molecules coat and protect the viral genome. After cell entry, the nucleic acid chaperone activity of NCp7 stimulates the reverse transcription (RTion) process [25, 30-33]. Though NCp7 molecules may partly dissociate from the viral core during RTion [34], a fraction of the NCp7 molecules remains likely bound to the retrotranscribed viral DNA (vDNA) together with other cellular and viral proteins and notably the integrase. The dissociation of NCp7 molecules is thought to be also associated with the uncoating of the viral core during its traffic to the nucleus. To image this traffic in a context mimicking real infection, the pseudoviruses containing NCp7-TC were labeled by ReAsH just before being incubated with HeLa cells. ReAsH, a biarsenical derivative of resorufin, becomes highly fluorescent when it binds to the TC tag [35]. This fluorophore can also be used for the oxidation and polymerization of 3,3-diaminobenzidine tetrahydrochloride (DAB), generating a precipitate sensitive to osmium tetroxide staining that can be visualized by TEM [36]. ReAsH was already used to image by CLEM the cellular traffic of connexins and the dynamics of Golgi assembly [36, 37].
Our study reports the first CLEM visualization of HIV-1 viruses, using the TC/ReAsH labelling. As a result of the ReAsH-mediated DAB photooxidation, HIV-1 viral particles could be visualized in the cytoplasm of infected HeLa cells by both confocal fluorescence microscopy and TEM. The co-localization of the photonic and electronic contrasts clearly indicated that the observed structures were viral cores. Electron dense precipitates of different sizes and morphologies were observed. The 200-500 nm precipitates surrounded by membrane vesicles were assigned to pseudoviruses within endosomes, lysosomes or cellular peroxisomes. The ~200 nm precipitates without external membrane were assigned to individual free viral cores. The latter were observed in the cytoplasm close to microtubules. In the perinuclear area, the DAB precipitates were observed near nuclear pores, suggesting that the viral particles docked to nuclear pores still contain a significant pool of NCp7 proteins.
4
Cell culture
HeLa and 293T cells were cultured in Dulbecco’s modified Eagle medium (1g/L glucose for HeLa cells and 4.5 g/L glucose for 293T cells) supplemented with 10% fetal calf serum (Invitrogen Corporation, France) and antibiotics penicillin and streptomycin (100 U/mL) at 37°C in a 5% CO2 atmosphere.
Production of vectors and viruses
The packaging pCMV_dR8.91 plasmid used for lentiviral production was modified according to Perreira et al. [22] in order to insert the AG-CCRECC-ERQUAN sequence, containing the tetracystein tag, to the C-terminus of the NC domain in the Gag coding sequence. The protease cleavage site at the C-terminus of the NC domain was conserved by duplicating the last 5 amino acids of the mature protein NCp7 coding sequence [22] .
HIV-1 pseudotyped viruses were prepared using a protocol based on Arhel et al. 2006 and Lelek et al 2012 [1, 4]. Briefly, 4x10⁶ 293T cells were plated on to 100 mm diameter plastic petri culture dishes in complete DMEM and 24 h later co-transfected by the VSV-G coding plasmid pMD2-G (3 µg), the modified packaging plasmid pCMV_dR8.91 (6 µg) and the transfer vector pSicor-luciferase (12 µg) using jetPEI® (PolyPlus transfection, France) according to supplier’s recommendations. At 24 h post transfection, the culture medium was replaced by serum-free medium. The cell supernatant collected 48 h post transfection was filtered through 0.45 µm low binding filters (Millipore, France) in order to eliminate large cellular debris and was further concentrated by centrifugation on Vivaspin collection tubes with a cutoff of 50 kDa (Sartorius, Intec, France).
The concentration of p24 antigen was measured by a p24 ELISA test (Innotest HIV Antigen mAb, InnoGenetics, Belgium). The aliquots of viral particles were stored at -80°C.
The infectivity of the pseudoviruses was quantified by luciferase luminescence measurementsat 24 h post-infection. Briefly, HeLa cells were plated in a 96-well plate (5.103 cells /well) and infected with a quantity of each virus corresponding to the same amounts of equivalent p24 (0.13, 0.38, 1.14, 3.43 and 10.3 ng equivalent of p24 ) in complete DMEM containing 8 µg/mL of polybrene. For each condition the cells were plated in triplicate. After 24 h, the cells were washed with PBS and lysed using a cell culture lysis buffer (Promega, France) supplemented with 0.5 % Triton-X100 during 20 min at room temperature. Luciferase activity was measured with a luciferase assay (Promega, France) according to supplier’s recommendations in a Berthold TriStar luminometer (LB941, Berthold Technologies, Germany).
5
ReAsH labeling of the pseudoviruses and infection
The viral supernatants (containing ~0.5 µg of p24) were labeled at room temperature (RT) with 1 µM ReAsH-EDT2 (Molecular Probes, France), 1 µM beta-mercaptoethanol, 1 µM Tris (2 carboxyethyl) phosphine (TCEP) and 10 µM 1,2-ethanedithiol in a total volume of 1 mL of serum-free medium. The unbound fluorophores were washed out by an ultracentrifugation step (100 000 g for 30 min at 4°C). Virus-containing pellets were resuspended in 200 µL of PBS and deposited on HeLa cells. After 2 hours the infected cells were washed with PBS and incubated in complete medium for additional 3 hours.
Confocal microscopy
Confocal microscopy experiments were performed on a Leica SPE II microscope equipped with a 63× oil immersion objective (HXL PL APO CS ,63 × oil, NA 1.4, Leica). ReAsH fluorophores were excited with a 561 nm laser line. The emitted fluorescence was detected by a PMT with a 580-700 nm detection window.
CLEM
50x103 HeLa cells were deposited in complete DMEM medium in a 12 well plate containing a laser micro-patterned Aclar® support [38]. 24 h later, cells were infected with labeled pseudoviral
particles. After 2 h of infection at 37°C, cells were washed in PBS, incubated for additional 3 h at 37°C and fixed with 2% glutaraldehyde at RT. ReAsH-induced DAB photooxidation was realized following a protocol adapted from Gaietta et al [39]. Cells were pre-treated in an ice-cold blocking buffer containing 10 mM potassium cyanide, 10 mM aminotriazole and 20 mM glycine in 0.1 M sodium cacodylate for 20-30 min. Directly after substitution of the blocking buffer with an ice-cold solution of 10 mg/mL 3,3’-Diaminobenzidine tetrahydrochloride (DAB) in 0.1 M cacodylate buffer, cells were illuminated by a metal halide Leica EL6000 lamp with an excitation bandpass filter (510-560 nm) for 10-15 min until total photobleaching of the fluorophore and appearance of brownish precipitates. The ice-cold drop of DAB solution was changed every 5-7 min. After DAB photoconversion, the samples were washed 3-5 times during 5 min with 0.1 M cacodylate buffer and post-treated for EM by the following procedure. First, cells were fixed 30 minutes in a 0.1 M sodium cacodylate buffer containing 2% glutaraldehyde at RT. They were then rinsed two times with cacodylate buffer and postfixed for 30 min in 1% osmium tetroxide in the dark on ice. After extensive rinses with distilled water, an en bloc staining was carried out by incubation in 1% uranyl acetate overnight at 4°C and rinsing with
6
distilled water. Dehydration was performed in graded series of ethanol solutions (50%, 70%, 90% and 3x 100% ; quickly rinsed and incubated during 10 min each on ice). The dehydrated samples were then embedded in an epoxy resin (50% in ethanol overnight, and 2x 100% 2 h). The blocks were finally polymerized at 60°C for at least 48 h. Ultrathin serial sections (80 nm) of selected cells were cut with a Leica ultracut UCT. Sections were examined using a Philips CM12 transmission electron microscope (CM12, Philips; FEI Electron Optics, Eindhoven, the Netherlands) operated at 80 kV and equipped with an Orius 1000 CCD camera (Gatan, Pleasanton, USA).
The z sections of the photonic and electronic images of the whole cell were superimposed. The viruses were then identified from the DAB precipitates corresponding to fluorescent spots. Next, these precipitates were imaged with a higher magnification. Since the identification of the pseudoviruses was straightforward due to their high contrast as compared to the cellular background in both fluorescence and TEM images, no specific algorithm was used for the correction of the sample distortion.
2. Results
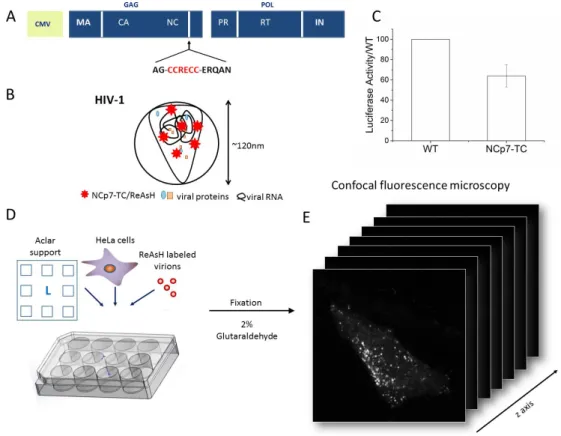
Addition of a fluorescent tag to NCp7 while preserving the protein function and HIV-1 infectivity is challenging due to the small protein size (7 kDa), its highly conserved structure and key functions, and the fact that each virion contains a tightly packed viral RNA coated by more than 2000 copies of NCp7 To minimally perturb the structure and function of NCp7, we fused it to a small tetracystein tag (CCRECC) labeled with a biarsenical resorufin-based label (ReAsH) [35, 40]. The tetracystein tag was inserted at the C-terminus of the NC domain in the polyprotein Gag coding sequence together with the last 5 amino acids of the mature protein in order to preserve the protease cleavage site [22] (Figure 1A,B). Moreover, during the labeling protocol, the fluorescent dye was added only after the virus production step to minimize possible perturbations on the viral assembly process. Coupling of the TC tag to NCp7 and ReAsH labelling preserved the virus infectivity, which was about 60% of the infectivity of the WT virus (Figure 1C).
In order to observe the ReAsH-labeled viral complexes in the host cells by CLEM, we adapted the DAB photooxidation protocol described by the Gaietta group [39, 41, 42]. HeLa cells were deposited on a custom gridded ACLAR film support adapted for the preparation of TEM samples [38, 43] and infected with ReAsH-labeled HIV-1 pseudoviruses containing NCp7-TC (Figure 1D). Two hours after infection, the pseudoviruses were washed out and the cells
7
were incubated in fresh complete medium for another 3 hours. After fixation with 2% glutaraldehyde, the samples were imaged by confocal microscopy (Figure 1E). Infected cells contained many fluorescent spots distributed in the cytoplasm and sometimes in the nuclear region.
Figure 1: Sample preparation for CLEM. (A) Packaging plasmid used for VSV-G pseudotyped HIV-1 particle production coding for NCp7-TC. (B) Scheme of ReAsh-labeled HIV-1 pseudovirus containing NCp7-TC. (C) Luciferase activity of HeLa cells infected for 24 h with pseudoviruses containing NCp7-TC relative to the activity of WT pseudoviruses. Plotted value represents the mean and SD of 5 infections at 5 different ng equivalent of p24: 0.13, 0.38, 1.14, 3.43 and 10.3 ng) (D) Sample preparation for CLEM experiments. HeLa cells cultured on custom gridded aclar supports were infected with ReAsH-labeled HIV-1 pseudoviruses containing NCp7-TC. Two hours after infection, the pseudoviruses were washed out and cells were incubated for another 3 hours in fresh complete medium. (E) After fixation, the cells were imaged by confocal microscopy.
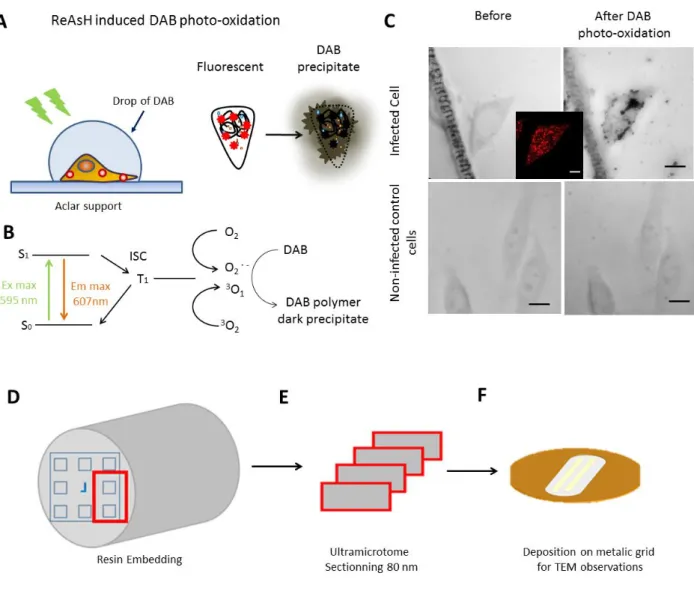
Following fluorescence imaging, the samples were incubated for 30 minutes on ice with a blocking buffer (see Materials and Methods) in order to minimize the non-specific oxidation of DAB by mitochondrial enzymes [37, 44]. The blocking buffer was replaced by a drop of fresh cold DAB solution and the samples were illuminated on the microscope stage with a xenon lamp using a rhodamine filter (510-560 nm) for 10-15 minutes (Figure 2A).
The principle of the photooxidation reaction is shown in Figure 2B. Excited ReAsH fluorophores can pass by intersystem crossing to the triplet state which is coupled to the generation of singlet oxygen and superoxide radical. These reactive species induce DAB
8
polymerization, forming a brownish precipitate that is sensitive to osmium staining. As a result, this reaction provides a dark TEM contrast at the location of the ReAsH-TC complexes. The crucial parameter in this photooxidation process is the intersystem crossing rate. Since this parameter varies inversely with the fluorescence quantum yield, many bright fluorophores are not suitable for photooxidation labeling. ReAsH appears as a good compromise, being bright enough for fluorescence microscopy, but also producing a high output of singlet oxygen.
Figure 2: ReAsH-triggered photoconversion of DAB. (A) The photoconversion is realized on a microscopy stage using a xenon lamp and a rhodamine excitation cube. (B) ReAsH specifically bound to the TC tag is excited by the light source. Through intersystem crossing, the probe passes to the triplet state, which triggers the production of reactive oxygen species. In turn, these species cause DAB oxidation and polymerization, generating a precipitate in close proximity to the ReAsH-TC complexes. Brownish DAB polymer is rendered electron dense upon treatment with osmium tetroxide [41, 45]. (C) Brightfield images of infected and non-infected cells before and after the photooxidation process. The insert shows a fluorescence microscopy image of the cells. Scale bar 10 µm (D). For electron microscopy, the sample is additionally fixed by osmium tetroxide, dehydrated and resin embedded. (E) ROIs with photooxidised cells are then cut into 80 nm slices by an ultramicrotome and deposited on a slot grid for TEM observation (F).
9
In order to check the generation of DAB precipitates, the samples were imaged by brightfield microscopy before and after photooxidation (Figure 2C). Infected cells with fluorescent cytoplasmic puncta corresponding to viral complexes (insert) showed a dense brownish precipitate of DAB after photooxidation. No significant difference was observed in photoxidized uninfected cells used as controls. Following photooxidation, the samples were stained by osmium tetroxide, dehydrated, embedded into a resin and sectioned by an ultramicrotome (Fig. 2D, E). Final slices of 80 nm thickness were deposited on a copper slot grid and imaged by transmission electron microscopy (Fig. 2F) without any additional poststaining.
Figure 3 shows confocal and electron microscopy images of the same cells. Non infected cells showed only low autofluorescence (Fig. 3A). Moreover, no dark puncta but only few large dark aggregates that are probably artifacts of sample preparation, were observed in the corresponding TEM images (Fig. 3 B). Unlike uninfected control cells, the infected cells contained numerous fluorescent spots in confocal images (Fig. 3 C) and dark spots in TEM images (Fig. 3 D). Since individual ReAsH fluorophores are not bright enough to provide sufficient contrast in confocal microscopy and can not generate enough ROS for efficient DAB photo-oxidation, the observed spots likely correspond to viral cores containing a large number of NCp7-TC/ReAsH complexes. As shown in the merged image (Figure 3E), most dark precipitates observed in TEM have their corresponding fluorescent spots in the confocal image (white arrows). The opposite is not true, because of the difference in the volume of the imaged sample in the two techniques. Indeed, the sample slice thickness for TEM is 80 nm, while the fluorescence signal is collected within a focal depth of 500 nm. As a result, much more NCp7-TC/ReAsH complexes are imaged by fluorescence microscopy than by TEM images. Despite the distortion introduced by the TEM preparation during the fixation and dehydration steps, it was possible to superimpose the photonic and TEM images and to identify corresponding individual virions (Figure 3 F and G).
10
Figure 3. CLEM observation of cells infected by ReAsH-labeled pseudoparticles containing NCp7-TC. Fluorescence microscopy images (A, C) and corresponding TEM images (B, D) of non infected (A, B) and infected (C, D) HeLa cells. (E) Merged image of (C) and (D). White arrows indicate the regions where the spots from fluorescence and TEM images are superimposed. Scale bar 10 µm. Confocal (F) and TEM (G) images of individual viral particles corresponding form the white rectangle in D. Scale bar 200 nm.
11
TEM micrographs of HeLa cells infected by ReAsH-labelled HIV-1 particles containing NCp7-TC proteins revealed different types of cytoplasmic vesicles densely marked by DAB precipitates. It should be kept in mind that, unlike the wild type HIV-1, the pseudoviruses used in this study contain VSV (Vesicular Stomatitis Virus) glycoproteins and enter the host cell via clathrin-mediated endocytosis. Once in the cytoplasm, when the endosomal pH decreases, they are released and transported to the perinuclear area via the microtubule network in the same way as wild-type viruses [46]. As a result of cell entry by endocytosis, the large (300-500 nm) cytoplasmic vesicles which contain dense black patches (Fig. 4A and B, red arrows), may correspond to viral particles entrapped in endosomes or lysosomes and/or to cellular peroxisomes containing reactive oxygen species which might oxidise DAB. Membraneless dark spots with a diameter of about 200 nm (varying between 100-300 nm) containing heterogeneous precipitates with fuzzy edges (Fig. 4A and B green arrows) most likely correspond to free individual viral complexes. To check whether these spots may not be part of a larger particle, several consecutive TEM sections were imaged. These viral complexes were found throughout the cytoplasm, and in the perinuclear area. Their difference in size with the average size (~ 100 nm) of an HIV-1 RTC is likely due to the fact that the singlet oxygen generated by photooxidation can diffuse in the cytoplasm before its de-excitation and generate DAB polymers distant from the ReAsH location. Taking into account the diffusion coefficient and lifetime of singlet oxygen in the cellular environment, the covered distance is approximately 100 nm, in line with the size of the observed precipitates [47-49] (Figure 4 C-F). DAB precipitates containing darker regions of conical shape may be the result of the hindered 1O2 diffusion in the viral cores with collisions with the viral proteins, and notably the capsid shell (Figure 4 H).
12
Figure 4. TEM micrographs of HeLa cells infected for 8 h by HIV-1 pseudoparticles containing ReAsH-labeled NCp7-TC. (A,B) DAB precipitates corresponding to free (green arrow) and peroxisomes or endosomes/lysosomes-trapped viral complexes (red). (C-H) Zoomed images of roundish heterogeneous precipitates (~200 nm) corresponding to free HIV-1 viral complexes. Scale bar 200 nm
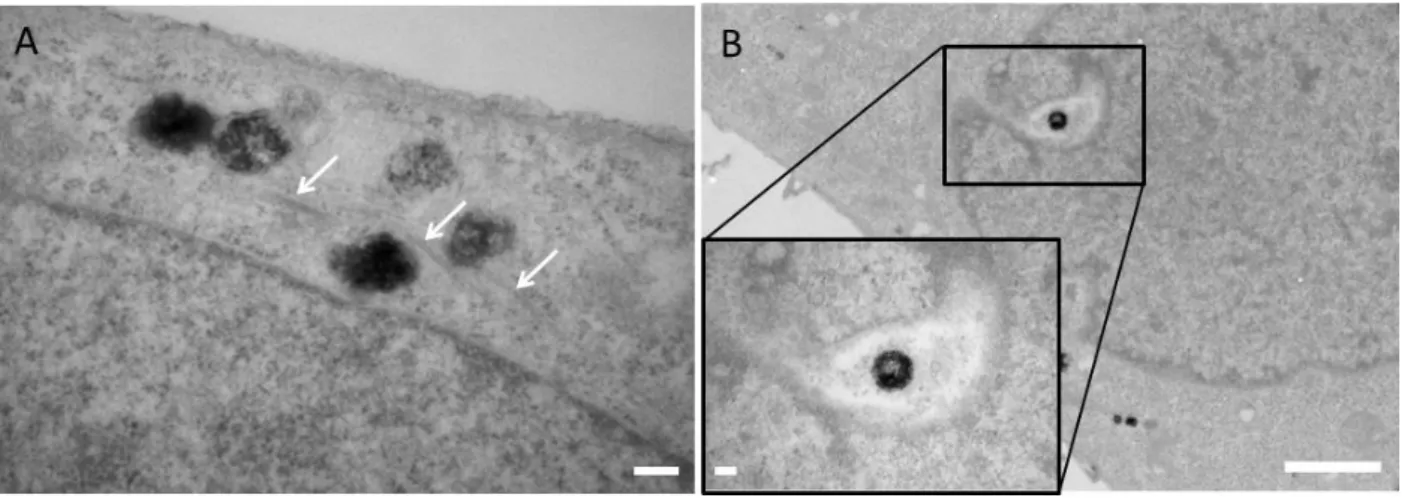
Membraneless viral complexes were sometimes observed in the proximity of microtubules (Figure 5A, white arrows). These complexes may represent free cytoplasmic RTCs that are being transported to the perinuclear area. No precipitate was observed in the nucleus, but
13
TEM microscopy clearly showed viral complexes invaginated in the nuclear envelope (Figure 5B).
Figure 5. (A) Viral complexes in proximity to microtubules (white arrows) or (B) invaginated in the nuclear envelope Scale bar is 200 nm in A and B insert , 2 µm in Bt.
Next, in order to check if NCp7 is present in viral complexes while entering the nucleus, we focused on the perinuclear area. Numerous viral complexes were found in close proximity to the nuclear envelope and nuclear pore complexes (Figure 6). Compared to the cytoplasmic DAB precipitates, the perinuclear ones were less regular. Their sizes ranged from 100 to 300 nm (Figure 6), and their shape varied from round (Figure 6B) to elongated (Figure 6 C,D). Even some asymmetric precipitates containing several small dark dots (Figure 6 A, C) were observed. We suppose that these precipitates reflect the concentrated ReAsH-labelled NCp7-TC proteins bound to viral RNA or DNA in partially uncoated cores.
Taken together, our data indicate that a significant amount of NCp7-TC proteins (necessary to efficiently photoconvert the DAB) is still present in viral complexes when they are about to enter the nucleus.
14
Figure 6. ReAsH-labeled viral complexes containing NCp7-TC in the perinuclear region. After 6-8 h of infection, numerous viral complexes were observed near to the nuclear envelope, in close proximity to nuclear pore complexes (yellow arrows), Scale bar in A, B, C, and D insert 200 nm, Scale bar in D is 500 nm.
Discussion
In this study, we introduced the first use of TC/ReAsH labelling for visualizing HIV-1 viruses during the early steps of infection by CLEM. HIV-1 VSV-G pseudotyped viruses containing the nucleocapsid protein fused to a tetracystein tag labeled by a ReAsH fluorophore were used as a relevant model system for HIV-1. This approach offers the unique advantage of combining specific functional labeling (TC-ReAsH) and nanometric resolution, and so allows to observe the intracellular distribution of viral particles by confocal fluorescence microscopy and the cell ultrastructure by TEM. The co-localization of bright fluorescent spots with dark electron dense precipitates in TEM images and the absence of both signals in non-infected cells, unambiguously indicate that the observed particles are ReAsH-labeled viral cores. Compared to previous reports where fluorescence images were crucial for the identification of viral cores in EM images [19-21, 50], the ReAsH-triggered photooxidation of DAB used in our study generates a specific contrast in TEM images that allows to identify the HIV-1 viral proteins even without the correlation with the photonic image. Therefore, due to the high contrast in both
15
photonic and TEM images given by the same probe, the correlation between the two images is highly simplified and does not require any sophisticated image treatment or fiducial marker.
The HIV-1 VSV-G pseudotyped viruses follow the cell internalization pathway of the vesicular stomatitis viruses and thus, enter the host cell via clathrin-mediated endocytosis [51, 52]. After decrease of the intravesicular pH, the reverse transcription complexes consisting of the conical capsid containing the NCp7-coated viral RNA and viral enzymes such as reverse transcriptase,Vpr and integrase are released in the cytosol [53] and follow the same early steps of replication as the wild-type HIV-1.
TEM images of cells infected by the ReAsH-labeled pseudoviruses containing NCp7-TC showed several types of DAB precipitates. Membrane vesicles of sizes between 200 and 500 nm containing black DAB precipitates most probably correspond to cellular peroxisomes or pseudoviruses trapped in endosomes, lysosomes, or any other type of cell vesicle. The main drawback of the DAB correlative studies is the loss of lateral resolution related to the diffusion of the ROS [54]. It is known that lipid membranes block the diffusion of singlet oxygen therefore, when used to identify the proteins present in membranous organelles such as Golgi apparatus, ER or lipid vesicles, DAB precipitates fill the whole lumen [55-57]. In our study, we suppose that the ReAsH-labelled pseudoviruses entrapped in membranous vesicles generated DAB precipitates that fill almost the whole lumen of the vesicle which consequently appears as a round dark and heterogeneous structure with no identifiable viral cores inside.
On the other hand, membraneless precipitates with fuzzy edges most probably correspond to free viral complexes. This type of precipitates is sometimes observed in the vicinity of microtubules, in line with a microtubule-mediated transport of HIV-1 to the nucleus [1, 5]. During its journey in the cytoplasm, the cone-shaped capsid disassembles and the viral RNA containing reverse transcription complex (RTC) is converted into the integration competent DNA-containing preintegration complex (PIC) that is internalized into the nuclear compartment. These processes take up to 16 hours for most virions [58], although the first nuclear PICs were observed by confocal and high resolution microscopy already 2 hours after infection [2, 4]. Therefore, in our conditions (5 hours post infection), different intermediates in the conversion of RTC to PIC must be present in the cytoplasm. This is fully consistent with our observations of different types of DAB precipitates, ranging from homogeneous and even cone-shaped structures (Figure 4) to irregular dotted structures (Figure 6). While the former probably correspond to RTC complexes, the latter are probably the result of the release of ReAsH-labeled NCp7-TC proteins during the RTC to PIC conversion. However it should be stressed that due to the diffusion of the ROS during the photooxidation (up to 100 nm) and the consequent loss of lateral
16
resolution, the morphology information should be interpreted cautiously [55]. In the ReAsH-labeled pseudoviruses, diffusing ROS may be hindered by collisions with other viral proteins and barriers such as the capsid structure. The diffusion would thus greatly depend on the capsid packaging which is variable as the capsid is progressively disassembled during the course of an infection. By consequence, the DAB precipitates do not fully reflect the actual structure of the viral complexes. Thus even if the resolution of TEM reaches nanometric level, it is not possible to clearly resolve the fine structure of the pseudoviruses by using the DAB approach.
It should be noted that fluorescent particles or DAB precipitates were not observed in the nucleus of infected cells. Possibly, the decrease of the number of ReAsH-labeled NCp7-TC proteins in the viral complexes prior to the nuclear entry limits their detection in the nucleus. Due to the small number of remaining NCp7-TC/ReAsH molecules and the rapid bleaching of the ReAsH fluorophores, confocal microscopy may fail to detect viral complexes and the oxygenated species produced may be insufficient to densely precipitate DAB for TEM detection in the nucleus. However, numerous viral cores were observed in proximity of the nuclear envelope and NPCs by both confocal and electron microscopy, which indicates that a significant number of NCp7-TC/ReAsH copies is still present in the viral complexes when they are about to enter the nucleus. Assuming that the release of NCp7 molecules is related to RTC conversion to PIC and capsid disassembly [6], these results favor for the observed particles the cytoplasmic uncoating model in which the capsid structure, inspite the possible loss of its integrity [19, 59], remains present during the transport of the viral core to the nuclear periphery [60].
Conclusion:
Taken together, we presented a first CLEM study of HIV-1 pseudoviruses labeled by the TC/ReAsH approach in infected HeLa cells. Co-localization of fluorescence particles in confocal images with dark spots in electron microscopy images clearly indicates that the structures observed are cytoplasmic viral cores. Compared to previous CLEM studies of HIV-1 infection, this work describes for the first time a correlative dye system that provides specific contrast in both fluorescence and electron microscopy images. This technique opens new perspectives for the study of the intracellular distribution of NCp7 and other viral proteins during the cytoplasmic trafficking of viral particles, which was not possible before, due to the lack of specific fluorescent markers giving a contrast in EM. By perturbing different steps of the viral cycle (reverse transcription, capsid disassembly, integration…), it will also be possible to obtain
17
fundamental information on the mechanism of viral infection. In addition, CLEM imaging will be beneficial in identifying the mechanism of action of new antiviral agents.
Acknowledgements:
This work was supported by the European Project THINPAD “Targeting the HIV-1
Nucleocapsid Protein to fight Antiretroviral Drug Resistance”(FP7 Grant Agreement 601969). SZ is supported by fellowships from the inist re de la Recherche and IL from the French Embassy in Ukraine (IL).
The authors have declared that no conflicting interests exist.
References
1. Arhel, N., et al., Quantitative four-dimensional tracking of cytoplasmic and nuclear HIV-1
complexes. Nat Methods, 2006. 3(10): p. 817-24.
2. Borrenberghs, D., et al., Dynamic Oligomerization of Integrase Orchestrates HIV Nuclear Entry. Sci Rep, 2016. 6: p. 36485.
3. Francis, A.C., et al., Second generation imaging of nuclear/cytoplasmic HIV-1 complexes. AIDS Res Hum Retroviruses, 2014. 30(7): p. 717-26.
4. Lelek, M., et al., Superresolution imaging of HIV in infected cells with FlAsH-PALM. Proc Natl Acad Sci U S A, 2012. 109(22): p. 8564-9.
5. Dixon, S., S. McDonald, and J. Roberts, The impact of HIV and AIDS on Africa's economic
development. BMJ, 2002. 324(7331): p. 232-4.
6. Hulme, A.E., O. Perez, and T.J. Hope, Complementary assays reveal a relationship between HIV-1
uncoating and reverse transcription. Proc Natl Acad Sci U S A, 2011. 108(24): p. 9975-80.
7. Ma, Y., et al., Real-Time Imaging of Single HIV-1 Disassembly with Multicolor Viral Particles. Acs Nano, 2016. 10(6): p. 6273-82.
8. Stultz, R.D., J.J. Cenker, and D. McDonald, Imaging HIV-1 Genomic DNA from Entry through
Productive Infection. J Virol, 2017. 91(9).
9. Xu, H., et al., Evidence for biphasic uncoating during HIV-1 infection from a novel imaging assay. Retrovirology, 2013. 10: p. 70.
10. Chin, C.R., et al., Direct Visualization of HIV-1 Replication Intermediates Shows that Capsid and
CPSF6 Modulate HIV-1 Intra-nuclear Invasion and Integration. Cell Rep, 2015. 13(8): p. 1717-31.
11. Briggs, J.A., et al., The mechanism of HIV-1 core assembly: insights from three-dimensional
reconstructions of authentic virions. Structure, 2006. 14(1): p. 15-20.
12. Briggs, J.A. and H.G. Krausslich, The molecular architecture of HIV. J Mol Biol, 2011. 410(4): p. 491-500.
13. Carlson, L.A., et al., Three-dimensional analysis of budding sites and released virus suggests a
revised model for HIV-1 morphogenesis. Cell Host Microbe, 2008. 4(6): p. 592-9.
14. Dussupt, V., et al., Basic residues in the nucleocapsid domain of Gag are critical for late events of
HIV-1 budding. J Virol, 2011. 85(5): p. 2304-15.
15. Kieffer, C., et al., Longitudinal imaging of HIV-1 spread in humanized mice with parallel 3D
immunofluorescence and electron tomography. Elife, 2017. 6.
16. Larson, D.R., et al., Visualization of retrovirus budding with correlated light and electron
18 17. Arhel, N.J., S. Souquere-Besse, and P. Charneau, Wild-type and central DNA flap defective HIV-1
lentiviral vector genomes: intracellular visualization at ultrastructural resolution levels.
Retrovirology, 2006. 3: p. 38.
18. de Boer, P., J.P. Hoogenboom, and B.N.G. Giepmans, Correlated light and electron microscopy:
ultrastructure lights up! Nat Methods, 2015. 12(6): p. 503-513.
19. Jun, S., et al., Direct visualization of HIV-1 with correlative live-cell microscopy and cryo-electron
tomography. Structure, 2011. 19(11): p. 1573-81.
20. Narayan, K., et al., Multi-resolution correlative focused ion beam scanning electron microscopy:
applications to cell biology. J Struct Biol, 2014. 185(3): p. 278-84.
21. Wang, L., et al., Visualization of HIV T Cell Virological Synapses and Virus-Containing
Compartments by Three-Dimensional Correlative Light and Electron Microscopy. J Virol, 2017.
91(2).
22. Pereira, C.F., et al., Labeling of multiple HIV-1 proteins with the biarsenical-tetracysteine system. PLoS One, 2011. 6(2): p. e17016.
23. Darlix, J.L., et al., Properties, functions, and drug targeting of the multifunctional nucleocapsid
protein of the human immunodeficiency virus. Adv Pharmacol, 2007. 55: p. 299-346.
24. Kafaie, J., et al., Mapping of nucleocapsid residues important for HIV-1 genomic RNA
dimerization and packaging. Virology, 2008. 375(2): p. 592-610.
25. Levin, J.G., et al., Nucleic acid chaperone activity of HIV-1 nucleocapsid protein: critical role in
reverse transcription and molecular mechanism. Prog Nucleic Acid Res Mol Biol, 2005. 80: p.
217-86.
26. Mirambeau, G., S. Lyonnais, and R.J. Gorelick, Features, processing states, and heterologous
protein interactions in the modulation of the retroviral nucleocapsid protein function. RNA Biol,
2010. 7(6): p. 724-34.
27. Muriaux, D. and J.L. Darlix, Properties and functions of the nucleocapsid protein in virus
assembly. RNA Biol, 2010. 7(6): p. 744-53.
28. Rein, A., L.E. Henderson, and J.G. Levin, Nucleic-acid-chaperone activity of retroviral
nucleocapsid proteins: significance for viral replication. Trends Biochem Sci, 1998. 23(8): p.
297-301.
29. Thomas, J.A. and R.J. Gorelick, Nucleocapsid protein function in early infection processes. Virus Research, 2008. 134(1-2): p. 39-63.
30. Godet, J., et al., During the early phase of HIV-1 DNA synthesis, nucleocapsid protein directs
hybridization of the TAR complementary sequences via the ends of their double-stranded stem. J
Mol Biol, 2006. 356(5): p. 1180-92.
31. Guo, J., et al., Human immunodeficiency virus type 1 nucleocapsid protein promotes efficient
strand transfer and specific viral DNA synthesis by inhibiting TAR-dependent self-priming from minus-strand strong-stop DNA. J Virol, 1997. 71(7): p. 5178-88.
32. Levin, J.G., et al., Role of HIV-1 nucleocapsid protein in HIV-1 reverse transcription. RNA Biol, 2010. 7(6): p. 754-74.
33. You, J.C. and C.S. McHenry, Human immunodeficiency virus nucleocapsid protein accelerates
strand transfer of the terminally redundant sequences involved in reverse transcription. J Biol
Chem, 1994. 269(50): p. 31491-5.
34. Lyonnais, S., et al., A protein ballet around the viral genome orchestrated by HIV-1 reverse
transcriptase leads to an architectural switch: from nucleocapsid-condensed RNA to Vpr-bridged DNA. Virus Research, 2013. 171(2): p. 287-303.
35. Adams, S.R., et al., New biarsenical ligands and tetracysteine motifs for protein labeling in vitro
and in vivo: synthesis and biological applications. J Am Chem Soc, 2002. 124(21): p. 6063-76.
36. Gaietta, G.M., et al., Golgi twins in late mitosis revealed by genetically encoded tags for live cell
imaging and correlated electron microscopy. Proc Natl Acad Sci U S A, 2006. 103(47): p.
17777-82.
37. Gaietta, G., et al., Multicolor and electron microscopic imaging of connexin trafficking. Science, 2002. 296(5567): p. 503-7.
19 38. Spiegelhalter, C., et al., From dynamic live cell imaging to 3D ultrastructure: novel integrated
methods for high pressure freezing and correlative light-electron microscopy. PLoS One, 2010.
5(2): p. e9014.
39. Gaietta, G.M., T.J. Deerinck, and M.H. Ellisman, Correlated live cell light and electron microscopy
using tetracysteine tags and biarsenicals. Cold Spring Harb Protoc, 2011. 2011(1): p. pdb top94.
40. Griffin, B.A., S.R. Adams, and R.Y. Tsien, Specific covalent labeling of recombinant protein
molecules inside live cells. Science, 1998. 281(5374): p. 269-72.
41. Gaietta, G.M., T.J. Deerinck, and M.H. Ellisman, Fluorescence photoconversion of
biarsenical-labeled cells for correlated electron microscopy (EM). Cold Spring Harb Protoc, 2011. 2011(1): p.
pdb prot5548.
42. Gaietta, G.M., T.J. Deerinck, and M.H. Ellisman, Labeling tetracysteine-tagged proteins with
biarsenical dyes for live cell imaging. Cold Spring Harb Protoc, 2011. 2011(1): p. pdb prot5547.
43. Jimenez, N., et al., Gridded Aclar: preparation methods and use for correlative light and electron
microscopy of cell monolayers, by TEM and FIB-SEM. J Microsc, 2010. 237(2): p. 208-20.
44. Deerinck, T.J., et al., Fluorescence photooxidation with eosin: a method for high resolution
immunolocalization and in situ hybridization detection for light and electron microscopy. J Cell
Biol, 1994. 126(4): p. 901-10.
45. Maranto, A.R., Neuronal mapping: a photooxidation reaction makes Lucifer yellow useful for
electron microscopy. Science, 1982. 217(4563): p. 953-5.
46. Anderson, J.L. and T.J. Hope, Intracellular trafficking of retroviral vectors: obstacles and
advances. Gene Ther, 2005. 12(23): p. 1667-78.
47. Cussler, E.L., Diffusion Mass transfer in fluid systems. 1997, New York: Cambridge University Press.
48. Egorov, S., et al., Rise and decay kinetics of photosensitized singlet oxygen luminescence in
water. Measurements with nanosecond time-correlated single photon counting technique.
Chem. Phys. Letters, 1989. 163: p. 421-24.
49. Jori, G., et al., Photobiology in Medecine Series A: Life Science. 1994, New York: Springer Science, Business Media New York.
50. Russell, M.R., et al., 3D correlative light and electron microscopy of cultured cells using serial
blockface scanning electron microscopy. J Cell Sci, 2017. 130(1): p. 278-291.
51. Matlin, K.S., et al., Pathway of vesicular stomatitis virus entry leading to infection. J Mol Biol, 1982. 156(3): p. 609-31.
52. Sun, X., et al., Role of clathrin-mediated endocytosis during vesicular stomatitis virus entry into
host cells. Virology, 2005. 338(1): p. 53-60.
53. Gruenberg, J. and F.R. Maxfield, Membrane transport in the endocytic pathway. Curr Opin Cell Biol, 1995. 7(4): p. 552-63.
54. Meisslitzer-Ruppitsch, C., et al., Photooxidation technology for correlated light and electron
microscopy. J Microsc, 2009. 235(3): p. 322-335.
55. Ladinsky, M.S., et al., HVEM tomography of the trans-Golgi network: structural insights and
identification of a lace-like vesicle coat. J Cell Biol, 1994. 127(1): p. 29-38.
56. Mironov, A.A., R.S. Polishchuk, and A. Luini, Visualizing membrane traffic in vivo by combined
video fluorescence and 3D electron microscopy. Trends Cell Biol, 2000. 10(8): p. 349-53.
57. Cortese, K., A. Diaspro, and C. Tacchetti, Advanced Correlative Light/Electron Microscopy:
Current Methods and New Developments Using Tokuyasu Cryosections. Journal of
Histochemistry & Cytochemistry, 2009. 57(12): p. 1103-1112.
58. Mohammadi, P., et al., 24 hours in the life of HIV-1 in a T cell line. Plos Pathogens, 2013. 9(1): p. e1003161.
59. Mamede, J.I., et al., Early cytoplasmic uncoating is associated with infectivity of HIV-1. Proc Natl Acad Sci U S A, 2017. 114(34): p. E7169-E7178.
60. Campbell, E.M. and T.J. Hope, HIV-1 capsid: the multifaceted key player in HIV-1 infection. Nat Rev Microbiol, 2015. 13(8): p. 471-83.