HAL Id: hal-01502737
https://hal.archives-ouvertes.fr/hal-01502737
Submitted on 7 Apr 2017
HAL is a multi-disciplinary open access
archive for the deposit and dissemination of
sci-entific research documents, whether they are
pub-lished or not. The documents may come from
teaching and research institutions in France or
abroad, or from public or private research centers.
L’archive ouverte pluridisciplinaire HAL, est
destinée au dépôt et à la diffusion de documents
scientifiques de niveau recherche, publiés ou non,
émanant des établissements d’enseignement et de
recherche français ou étrangers, des laboratoires
publics ou privés.
Artificial Regulatory Networks Evolution
Yolanda Sanchez-Dehesa, Loïc Cerf, Jose Maria Pena, Jean-François
Boulicaut, Guillaume Beslon
To cite this version:
Yolanda Sanchez-Dehesa, Loïc Cerf, Jose Maria Pena, Jean-François Boulicaut, Guillaume Beslon.
Artificial Regulatory Networks Evolution. Proc 1st Int Workshop on Machine Learning for Systems
Biology MLSB 07, Sep 2007, Evry, France. pp.47-52. �hal-01502737�
Artificial Regulatory Networks Evolution
Yolanda S´anchez-Dehesa1, Lo¨ıc Cerf1, Jos´e-Mar´ıa Pe˜na2, Jean-Fran¸cois
Boulicaut1, and Guillaume Beslon1
1 INSA-Lyon, LIRIS CNRS UMR5205, F-69621 Villeurbanne, France 2 DATSI, Universidad Polit´ecnica de Madrid, 28660, Spain
Abstract. Genetic network inference is one of the main challenges for computer scientists in cellular biology. We propose to use in silico exper-imental evolution to guide the development of inference algorithm by (i) developing general knowledge about genetic networks structure (and use this knowledge to develop inference heuristics), and (ii) generate large realistic benchmarks to support validation of inference algorithms. For this purpose, we develop the RAevol model which aims at simulating the evolution of regulatory networks.
1
Introducing the challenge of network inference
Gene network dynamics is supposed to explain most of the cellular behaviors such as cell differentiation, cell response to stress or cell proliferation in cancer. Regulation activity is the core of cell behavior and it could become a key element in many research lines, either in specific cells/organisms or in a more general way. A plethora of algorithms and tools have been proposed to reconstruct the actual cell regulatory network from transcriptomics data (see, e.g., [6,7]) or, less ambitiously, to classify or cluster transcriptomics data. However, all these algorithms have to deal with a least two main difficulties.
The first difficulty is the under-determination of regulatory networks: Any transcription data set can be produced by an infinity of different genetic net-works. Thus, when inferring the networks, the algorithms must use a priori knowledge to choose between networks that would be equivalent on a sole data basis. Most of the time, a parsimony criterion is used. This criterion, coming from epistemology (Occam’s razor) and machine learning, is ubiquitous in sci-ence. However, genetic networks have not been constructed by a rational en-gineering process. They have been slowly and incrementally built by a blind tinkerer: Evolution. Yet, there is no obvious reason for evolution to choose the parsimonious way.
The second difficulty is the algorithm validation. Lots of inference algorithms are based on heuristics (e.g., parsimony), over-simplistic assumptions (interac-tions between genes are generally additive), or on a priori biological hypothesis that are still under debate (e.g., the assumption that network dynamics is visi-ble in data gathered from thousands of unsynchronized cells). To validate these algorithms, one can compare their results with previously established knowledge or use artificially generated data sets to compare the inferred network with the
2 Y. Sanchez-Dehesa et al.
one that has been used to generate the data [12,13]. However, this approach is entangled with our lack of knowledge about the hidden network structure. Both challenges thus meet on a same question: How are regulatory networks orga-nized? Lots of studies have shown that they own a very specific topology [4] and that specific motifs are over-represented in such networks [2].
2
Artificial evolution as a benchmark generator
As Dobzhansky said 30 years ago: “Nothing in biology makes sense except in the light of evolution”. Following this idea, we argue that taking evolution into account would help us to better understand the iterative process by which these networks are constructed. Yet, it is well known that networks generative process has a strong influence on the final network structure and dynamics [4]. However, genetic networks evolution cannot be easily studied in vivo due to their kinetic aspects. So, many authors have estimated the evolutionary mechanism by using bio-informatics tools and models, i.e., by inferring networks history from today structures [16]. We propose the reversed approach: By modeling in silico the evo-lutionary dynamics of genomes and regulatory networks, we try to estimate the most probable structure. This knowledge will then be used as a priori knowledge in inference tools.
Moreover, such a model could provide plausible networks to lately generate large data sets which can be used as benchmarks for data mining and inference algorithms. Yet, evaluating data mining algorithms aiming at describing dynamic properties of regulatory networks (e.g., [9]) is difficult today. Dynamic real-life data remain rare compared to what will be possible to collect within a few years. Thus, researchers tend to evaluate their algorithms at best on data issued from other research fields (e.g., ad-hoc patches on synthetic data generators like the popular basket data generator from IBM), at worst from randomly generated data. In both cases, looking for relevant patterns or models within the generated data is somehow useless. Moreover, it remains unclear whether such an experimental validation methodology (e.g., measures w.r.t. scaling issues) is fair. Our thesis is that studying realistic simulated networks is obviously a better alternative.
3
RAevol: In silico evolution of regulatory networks
There is a large amount of models dealing with evolution of regulatory networks [5,1,15,3,8]. However, all these models make the unrealistic hypothesis of a direct evolution of networks: The network is either directly altered by mutations or it is directly selected (e.g., on the basis of its topology). To study evolution in bio-logical systems “in silico”, we need to build models gathering the main basis of evolution: Genetic mutations, genotype-phenotype mapping, and phenotypic se-lection. Moreover to study evolution of regulatory networks, we should take into account that mutations do not affect directly the network. Obviously, mutation occurs on the genome, thus modifying indirectly the genetic network. Similarly
the genetic network is not submitted to any direct selection pressure. The net-work contributes to the cell phenotype. So it is indirectly selected if and only if it produces selectable phenotypic traits. Yet, while many evolutionary studies directly select the networks for their topological (e.g., small world or scale free connectivity) or kinetic properties (e.g., stability or robustness), it is not clear whether such properties have a real impact on the phenotype.
Thus, we need to create an integrated model including evolution of genotype-phenotype mapping and enabling the evolution of a genetic network inside such a system. This biological model should also include the main biological facts about regulation. It should be stratified on different organization levels from genome to organism phenotype and be compliant with some minimal known characteristics of real regulatory networks: Different activation levels, auto-regulation, different degrees of protein production, different binding levels, and all these characteris-tics must be evolvable by mutation of the “primary” genetic sequence. Finally, the organisms should be selected at the phenotypic level.
To build such a model we started from the integrative evolutionary model Aevol [10,11]. Aevol integrates a genotype-phenotype mapping, with a transcrip-tion/translation process to compute proteins from the genes. Each organism in Aevol owns its own genome which is translated into a set of proteins. These proteins form a simple metabolic network giving the organism phenotype. Aevol can manage large population of such individuals: They are selected on the basis of the set of metabolic processes they are able to achieve. Aevol has been ini-tially developed to study robustness and evolvability in artificial organisms. For the sake of simplicity, it does not include a regulatory process. Each protein has its own production rate that gives its basal concentration level. The phenotype results from the interactions of basic functional elements encoded by genes, con-sidering the concentration of these elements (i.e., their basal level). For studying evolution of regulatory networks a regulatory system has been included in Aevol to build the Regulatory-Aevol Model (RAevol). In RAevol, protein production level is calculated from the matching level between the protein promoter and all other proteins sequences (see below). The main element of the model is the protein. It can behave in three different ways giving three artificial codes:
Genetic code used to find transcribed regions along the binary genome se-quence and to translate them into a sese-quence of amino-acids (there are six amino-acids in the Aevol model).
Metabolic code. Given the protein sequence, it enables us to compute its func-tion (funcfunc-tions are described as fuzzy sets in an arbitrary funcfunc-tional space). All protein functions are summed-up to compute the organism metabolism. Regulatory code used to compute the affinity of any protein with any genetic sequence and its influence on the transcription process (activation or inhibi-tion). When a protein matches the regulatory region of a gene, it regulates its transcription, thus modifying its concentration in the metabolic network. Details about the RAevol platform can be found in [14].
4 Y. Sanchez-Dehesa et al.
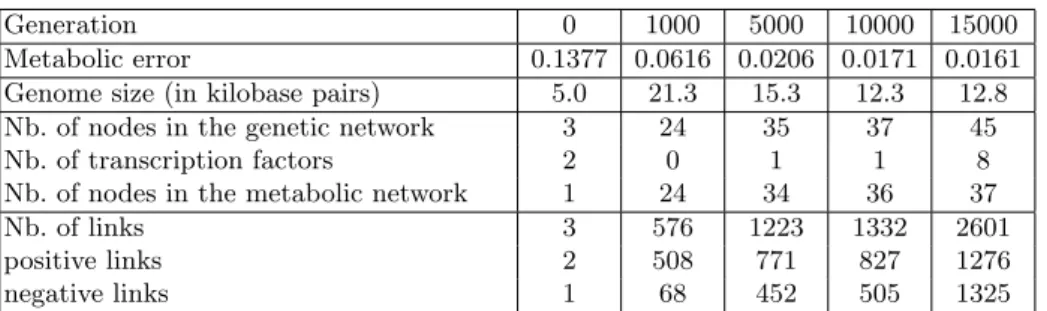
Generation 0 1000 5000 10000 15000 Metabolic error 0.1377 0.0616 0.0206 0.0171 0.0161 Genome size (in kilobase pairs) 5.0 21.3 15.3 12.3 12.8 Nb. of nodes in the genetic network 3 24 35 37 45 Nb. of transcription factors 2 0 1 1 8 Nb. of nodes in the metabolic network 1 24 34 36 37 Nb. of links 3 576 1223 1332 2601 positive links 2 508 771 827 1276 negative links 1 68 452 505 1325
Table 1. Structure of the organisms at five evolutionary stages. The metabolic error quantifies the difference between the organism metabolism and the ideal metabolism given the environment; The fitness of an organism is inversely proportional to its metabolic error. Transcription factors are nodes connected to the regulation network but not to the metabolic network.
4
First results and open issues
We have used the RAevol platform to simulate long term evolution of an artificial organism. The organism must perform three different metabolic functions but, depending on the incoming of an external signal (i.e., a protein added manually), it must stop performing one of these process. Table 1 shows the main genetic and metabolic parameters at five stages of the evolution as well as the global network characteristics. During the 5000 last generations, the network size increases. It is due to the appearance of transcription factors (i.e., proteins taking part to the regulatory network but with no effect on the metabolism). This shows that the regulatory network has developed its own structure in parallel with the metabolic network. The emergence of the regulatory network is illustrated on Fig. 1: During the 5000 last generations, the network acquires a lot of new links (due to the addition of new nodes). Moreover these links are not randomly distributed: High-valued (mainly negative) links have appeared and the distribution of the links is multi-modal. This distribution is clearly different from the one that would have been obtained by a random generation. We now plan to develop inference algorithms that exploit such properties learned from the model.
The first simulations show that our model can generate large data sets. The next step will be to complexify the metabolism dynamics in the model by increas-ing the number of environmental conditions. Since we can control the complexity of the evolved network (data not shown), RAevol can generate a collection of benchmarks of different sizes (either in terms of network size or in terms of dy-namics complexity). In parallel, we plan to extract knowledge directly from the data generated by RAevol to improve mining and inference algorithms (e.g., by choosing realistic heuristic criterion). Both directions are to help practitioners to better take-up the challenge of network inference from data.
Fig. 1. Histogram of links in the regulatory network at three evolutionary stages. They show the progressive partitioning of the links in two normal distributions and the emergence of high-valued links in the network.
Acknowledgments. This work is partly funded by EU contract IST-FET IQ FP6-516169.
6 Y. Sanchez-Dehesa et al.
References
1. M. Aldana, E. Balleza, S. Kauffman, and O. Resendiz. Robustness and evolvability in genetic regulatory networks. J Theor Biol, 2006.
2. U. Alon. Network motifs: theory and experimental approaches. Nature Reviews
Genetics, 8(6):450–461, june 2007.
3. W. Banzhaf. On evolutionary design, embodiment and artificial regulatory net-works. Embodied Artificial Intelligence, pages 284–292, 2004.
4. A.-L. Barabasi and Z. N. Oltvai. Network biology: Understanding the cell’s func-tional organization. Nat. Rev. Genet., 5:101–113, 2004.
5. S. Ciliberti, O.C. Martin, and A. Wagner. Robustness can evolve gradually in complex regulatory gene networks with varying topology. PLoS Computational
Biology, 3(2), February 2007.
6. F. d’Alch´e Buc and V. Schachter. Modeling and indentification of biological net-works. In Proc. Int. Symp. on App. Stochastic Models and Data Analysis, 2005. 7. V. Filkov. Handbook of Computational Molecular Biology, chapter Identifying Gene
Regulatory Networks from Gene Expression Data. 2005.
8. P. Francois and V. Hakim. Design of genetic networks with specified functions by evolution in silico. Proc. Natl. Acad. Sci. USA, 101(2):580–585, 2004.
9. D. Jiang, J. Pei, M. Ramanathan, C. Tang, and A. Zhang. Mining coherent gene clusters from gene-sample-time microarray data. In KDD ’04: Proc. of the 10th
ACM SIGKDD Int. Conf. on Knowledge Discovery and Data Mining, pages 430–
439, 2004.
10. C. Knibbe. Structuration des g´enomes par s´election indirecte de la variabilit´e
muta-tionnelle, une approche de mod´elisation et de simulation. PhD thesis, INSA-Lyon,
2006.
11. C. Knibbe, O. Mazet, F. Chaudier, J.-M. Fayard, and G. Beslon. Evolutionary coupling between the deleteriousness of gene mutations and the amount of non-coding sequences. J. Theor Biol, february 2007.
12. A. Medina, A. Lakhina, I. Matta, and J. Byers. BRITE: Universal topology gen-eration from a user’s perspective. Technical Report 2001-003, Boston University, Comp. Sc. Dept., january 2001.
13. P. Mendes, W. Sha, and K. Ye. Artificial gene networks for objective comparison of analysis algorithms. Bioinformatics, 19 Suppl 2, October 2003.
14. Y. Sanchez-Dehesa, G. Beslon, and J.M. Pe˜na. Modeling evolution of regulatory networks in artificial organisms. In A. Feelders, editor, Proceedings 3rd Int. Symp.
CompLife 2007. American Institute of Physics, October 2007. To appear.
15. O. S. Soyer and S. Bonhoeffer. Evolution of complexity in signaling pathways. Proc
Natl Acad Sci U S A, October 2006.
16. S. A. Teichmann and M. M. Babu. Gene regulatory network growth by duplication.