HAL Id: inserm-00323966
https://www.hal.inserm.fr/inserm-00323966
Submitted on 23 Mar 2009HAL is a multi-disciplinary open access archive for the deposit and dissemination of sci-entific research documents, whether they are pub-lished or not. The documents may come from teaching and research institutions in France or abroad, or from public or private research centers.
L’archive ouverte pluridisciplinaire HAL, est destinée au dépôt et à la diffusion de documents scientifiques de niveau recherche, publiés ou non, émanant des établissements d’enseignement et de recherche français ou étrangers, des laboratoires publics ou privés.
Air pollution and asthma severity in adults.
Estelle Rage, Valérie Siroux, Nino Künzli, Isabelle Pin, Francine Kauffmann
To cite this version:
Estelle Rage, Valérie Siroux, Nino Künzli, Isabelle Pin, Francine Kauffmann. Air pollution and asthma severity in adults.. Occupational and Environmental Medicine, BMJ Publishing Group, 2009, 66 (3), pp.182-8. �10.1136/oem.2007.038349�. �inserm-00323966�
Occupational and Environmental Medicine 2008 (in press)
Air pollution and asthma severity in adults.
Estelle Rage1,2, Valérie Siroux3,4, Nino Künzli5, Isabelle Pin3,6 , and Francine Kauffmann1,2, on behalf of the Epidemiological Study on the Genetics and Environment of Asthma (EGEA) CORRESPONDING AUTHOR
E. Rage Inserm U780
16 avenue Paul-Vaillant Couturier 94807 Villejuif Cedex France Email : [email protected] Tel (33) 1 45 59 53 57 Fax (33) 1 45 59 51 69 AFFILIATIONS
1Inserm, U780, Epidemiology and Biostatistics, Villejuif, France; 2Univ Paris-Sud, IFR69, Villejuif, France;
3Inserm, U823, Centre de Recherche Albert Bonniot, Epidémiologie des cancers et des
affections graves, La Tronche, F-38706 France;
4Univ Joseph Fourier, Grenoble, F-38041 France;
5Centre for Research in Environmental Epidemiology, (CREAL), Municipal Institute of
Medical Research (IMIM-Hospital del Mar), CIBER Epidemiologia y Salud Pública (CIBERESP), ICREA, Barcelona, Spain;
6CHRU Grenoble, Michalon Hospital, Department of Pneumology, Grenoble, France.
KEYWORDS: air pollution; asthma severity; ozone. WORD COUNT: 4441
ABSTRACT
Objectives - There is evidence that exposure to air pollution affects asthma, but the effect of air pollution on asthma severity has not been addressed. The aim was to assess the relation between asthma severity during the past 12 months and home outdoor concentrations of air pollution.
Methods - Asthma severity over the last 12 months was assessed in two complementary ways among 328 adult asthmatics from the French Epidemiological study on the Genetics and Environment of Asthma (EGEA) examined between 1991 and 1995. The 4-class severity score integrated clinical events and type of treatment. The 5-level asthma score is based only on the occurrence of symptoms. Nitrogen dioxide (NO2), sulphur dioxide (SO2) and
ozone (O3) concentrations were assigned to each residence using two different methods.
The first was based on the closest monitor data from 1991-1995. The second consisted in spatial models that used geostatistical interpolations and then assigned air pollutants to the geo-coded residences (1998).
Results - Higher asthma severity score was significantly related to the 8-hour average of ozone during April-September (O3-8hr) and the number of days (O3-days) with 8-hour ozone
averages above 110 !g.m-3 (for a 36-day increase, equivalent to the inter quartile range, in O3-days, odds ratio (95% confidence interval) 2.22 (1.61-3.07) for one class difference in
level did not alter results. Asthma severity was unrelated to NO2. Both exposure assessment
methods and severity scores resulted in very similar findings. SO2 correlated with severity but
reached statistical significance only for the model based assignment of exposure.
Conclusions - The observed associations between asthma severity and air pollution, in particular O3, support the hypothesis that air pollution at levels far below current standards
increases asthma severity. INTRODUCTION
Evidence of adverse effects of current air pollution on human health substantially increased in recent years.[1,2] Despite improvements in air quality in many regions of the world, primary and secondary pollutants from traffic and other sources of fossil fuel combustion such as particulate matter, diesel soot, or ozone remain of particular concern. Photochemical air pollution represented by ozone, oxides of nitrogen produced by vehicles and respirable fine and ultrafine particulates are of interest due to their toxic properties, and asthmatics are a particularly sensitive subgroup.[1] Associations between daily changes in air pollution and various acute respiratory outcomes including sub-clinical functional changes, symptoms, doctors or emergency room visits, hospitalisations and death[3] have been reported among asthmatics.[4,5] Evidence of acute effects is based on several panel studies conducted in children, and to a lesser extent in adults. Greater susceptibility to acute effects of ambient air pollution in asthmatics with more severe asthma was observed in children[6] but were not consistent in adults.[5,7] A challenge and potential source for inconsistent results is the complex interrelationship of asthma symptoms, its triggers, and subjects coping strategies through adaptation of treatment. As the typically moderate daily changes in air quality may lead to fluctuations in the expression of the disease, it is of interest to evaluate markers of asthma severity on a clinically relevant scale along the continuum between non-symptomatic not regularly treated asthma and symptomatic asthma despite regular treatment.
The concept of the definition of asthma severity has evolved over the past years. Despite development of guidelines for clinical practice, it remains difficult to define asthma severity in epidemiology. While different definitions of asthma severity are in use,[8,9] the concept is certainly clinically relevant. Determinants of asthma severity are not much investigated[10] and, to our knowledge, no study investigated the effect of air pollution on asthma severity.
The aim of the present study was to investigate the relationships between individually assigned exposure to ambient air pollution and asthma severity assessed in two complementary ways. First, we use a clinically relevant score that integrates both symptoms and treatment. Second, we use a simpler score based on symptoms alone. We hypothesize that severity among adult asthmatics from the Epidemiological study on the Genetics and Environment of Asthma, bronchial hyperresponsiveness and atopy (EGEA) correlates with the average air quality at the residential location.
MATERIAL AND METHODS
Study population and asthma severity
The EGEA study combines a case-control study and a family study.[8,11,12] The protocol has been described elsewhere.[13] Asthmatics, living in pre-defined geographical areas were recruited from chest clinics in five French cities (Paris, Lyon, Marseille, Montpellier, and Grenoble) between 1991 and 1995. Within each city, subject’s residences spread across large geographic areas, ranging from 300 km2 (for the area of Lyon) to 9300
km2 (for the area of Marseille). Cases were classified as living far from the university hospital based on a distance of at least 10-15 km. Asthmatic probands were those who answered positively to the four following standardized questions: Have you ever had attacks of breathlessness at rest with wheezing? Have you ever had asthma attacks? Was this
diagnosis confirmed by a physician? Have you had an asthma attack in the last 12 months? Among relatives from the families of asthmatic probands, asthma was defined by a positive answer to at least one of the first two questions. The present analysis concerned 328 adult asthmatic subjects from 255 families (188 asthmatic cases and 140 asthmatic relatives). Information was recorded for respiratory symptoms, environment, smoking habits and treatment by a detailed face to face interview administered international standardized questionnaire.[14]
We used two operational definitions of ‘asthma severity’. The first approach consists in a 4-class asthma severity score defined for the last 12 months that is based on the concept of 2002-2004-GINA (Global Initiative for Asthma) international guidelines.[15] First, asthma severity was assessed using a clinical severity score derived from frequency of asthma attacks, symptoms between attacks, and hospitalisation for asthma.[11,12,16,17] Secondly, the 4-class asthma severity score was developed,[8] which combined the above clinical score, with information about the occurrence of any attack in the last 12 months, and treatment reported in the past 12 months (no treatment, treatment without inhaled corticosteroids and treatment with inhaled corticosteroids)..
The second definition of severity corresponded to the 5-level asthma score introduced by the European Community Respiratory Health Study.[9] The score, allowing assessing the activity of asthma, was derived as the sum of affirmative responses to any of the following five asthma-like symptoms: breathless when wheezing, woken up with a feeling of chest tightness, woken by attack of shortness of breath (SOB), attack of SOB at rest, and attack of SOB after exercise. All questions referred to the occurrence of symptoms during the last 12 months.
The independence of asthma severity with the distance from the university hospital was checked, as it could have biased the association of air pollution with asthma severity.
Air pollution
Two approaches were used to assign air pollution exposure to each individual: The first assessment of air pollution relied on the 1991-1995 data from the French Agency for Environment and Energy (ADEME) monitoring network. In case of NO2 and SO2, annual
arithmetic means were used. In case of O3 we derived both the 8-hour average (O3-8hr)
across the six summer months (April to September) and the number of days with 8-hour averages above 110 !g.m-3 (O
3-days). No data were available for particulate matter (PM) for
the period under study. The individual assignment of exposure is described in the appendix. In brief, annual mean concentrations (Ozone, NO2, SO2) from the closest monitor were
assigned to each residence. For subjects living in proximity to busy roads we used NO2 and
SO2 data from the closest traffic monitor station. In all other cases, only data from
background monitors were used.
In the second approach we derived concentration estimates from a geo-statistical model carried out by Geovariances for the French Institute of Environment (IFEN) and ADEME for the year 1998.[18]. A validation of the procedure has been performed. Modelled data were compared with classical interpolation algorithms such as inverse distance or univariate kriging. High correlation coefficients (r > 0.73) between interpolated and measured values, together with low mean quadratic errors, confirm the validity of the multivariate geostatistical models (Nicolas Jeannée, personal communication). The geostatistical interpolation techniques (kriging-like techniques [19]) are commonly applied since several years to estimate air pollution at unsampled locations;[20,21] the estimation process, based on measured concentrations, takes into account the spatial structure of each pollutant. The better the spatial continuity of the pollutant, the better the confidence one can have in the estimate. The interpolation is realized for annual mean concentrations coming from background monitoring stations on a 4km x 4km grid covering France. Land cover was
integrated to the interpolation process as well as specific cofactors correlated to the pollutants: altitude and North-South concentration gradient for ozone, emission registries of nitrogen oxides, road network and population density for NO2, and industrial emissions of
SOx for SO2. Residential addresses of all participants were geo-coded to assign estimated
annual means for NO2, SO2 as well as summer ozone(O3-summer) assessed from the
monthly means from April to September.
Data Analysis
Pearson correlation coefficients were derived across individually assigned air pollution concentrations. Univariate relationships between variables were explored with "2 tests and
analyses of variance. Ordinal logistic regressions and when appropriate multinomial regressions (see appendix) were performed. Odds ratios were given for one class difference in the scores and for an increase of one inter quartile range (IQR) in air pollution concentrations. Final models took into account age, sex, smoking habits, educational level and occupational exposures. Smoking habits, previously associated to asthma severity[11] were grouped into never, ex- and current smokers. Education was classified in primary, secondary and university level. Occupational exposure was assessed with a job exposure matrix for eighteen asthmogens completed by expert review.[8,22] Environmental tobacco smoke (current smoking of parents or spouse at home) and indoor air pollution, assessed by considering current use of gas heating or gas cooking and water damage in the last 12 months were considered but not retained in the final model. In order to test the sensitivity of results, analyses were repeated in subgroups defined by sex, age, smoking habits, occupational exposure, and education level as well as by city. Odds ratios were expressed for an increase of 10 days of O3-days.
In France, ozone seasons are by and large restricted to the summer period, thus summer time O3 reflects exposure much better then annual concentrations. While severity
was assessed for the last 12 months, one may argue that patients would primarily report the more recent experience. Therefore, if ozone affects asthma severity in an acute or sub-acute manner, associations between severity and ozone may be stronger among subjects answering the questionnaire during the mid summer to fall season. We thus stratified the analyses by season of participation (April to September versus October to March). Familial dependence between observations was taken into account using generalized estimated equations (GENMOD procedure) and a random population with one subject per family were performed, but results did not change (data not shown). More details are presented in the appendix. The statistical software package SAS was used (SAS Institute, Cary, NC, USA).
RESULTS
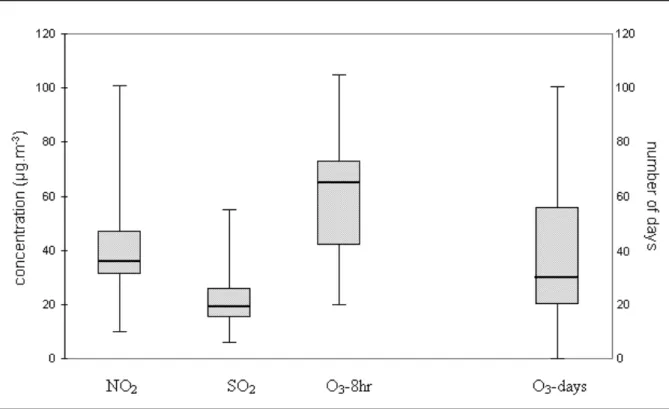
Clinical characteristics of the population are reported in table 1 and environmental exposures in table 2. With the first approach (i.e. ‘closest monitor’) we were able to assign annual mean concentrations to most but not all subjects: 88.4% for NO2, 77.7% for SO2,
64.0% for O3-8hr and 88.1% for O3-days. The distribution of assigned pollutant
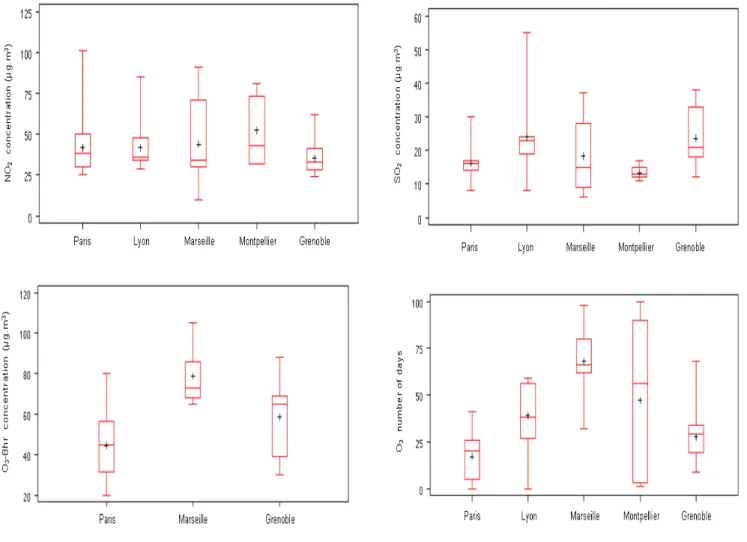
concentrations is presented in figure 1. Figure S1 in the appendix presents data by city. The second exposure assignment approach allowed assigning concentrations to 93.9% of subjects.
Table 1 Clinical characteristics of the asthmatic adults
Clinical characteristic
Value
Age (n=328)
Mean ±
SD, yrs
37.3 ± 13.3
Sex (n=328)
Men, %
50.9
4-class asthma severity score * (n=328)
Class 1, %
32.6
Class 2, %
22.6
Class 3, %
15.2
Class 4, %
29.6
5-level asthma score * (n=314)
Level 0, %
15.0
Level 1, %
10.2
Level 2, %
11.8
Level 3, %
16.2
Level 4, %
18.1
Level 5, %
28.7
Treatment (n=328)
Inhaled corticosteroids, %
54.3
FEV
1% predicted (n=325)
Mean ± SD
93.3 ± 20.8
FEV
1< 80% predicted, %
22.8
Bronchial hyperresponsiveness (n=166)
PD
20! 4 mg, %
74.1
PD
20: provocative dose of methacholine causing a 20% fall in FEV
1.
*For definitions, see methods.
Table 2 Environmental characteristics of the asthmatic adults
Environmental characteristic
Value
Smoking habits (n=324)
Never smokers, %
49.7
Ex-smokers, %
30.2
Current smokers, %
20.1
Passive smoking (n=290)
Current smoking parents or spouse, %
31.4
Educational level (n=259)
Primary, %
32.4
Secondary, %
27.0
University, %
40.6
Occupational exposure (n=260)
Exposed to asthmogens, %
19.6
Indoor exposure
Current gas heating, (n=323), %
34.4
Current gas cooking, (n=324), %
80.9
Water damage in the last 12 months (n=283), %
8.5
Outdoor air pollution (1
stmethod: annual concentrations based on
1991-1995 nearby background and traffic monitoring stations data )
NO
2(n=290)
mean ± SD, !g.m
-340.2 ± 14.7
25
th-75
thpercentiles (IQR), !g.m
-331-45 (14)
SO
2(n=255)
mean ± SD, !g.m
-321.3 ± 8.6
25
th-75
thpercentiles (IQR)
,!g.m
-315-27 (12)
O
3-8hr (n=210)
mean ± SD
,!g.m
-360.5 ± 19.4
25
th-75
thpercentiles (IQR)
,!g.m
-342-73 (31)
O
3-days (n=289)
mean ± SD
,days
37.8 ± 24.4
25
th-75
thpercentiles (IQR)
,days
20-56 (36)
Outdoor air pollution (2
ndmethod: model-based annual concentrations
assessed for the 1998 year)
NO
2(n=308)
mean ± SD
,!g.m
-335.9 ± 9.3
25
th-75
thpercentiles (IQR),
!g.m
-328.8-38.7 (9.9)
SO
2(n=308)
mean ± SD
,!g.m
-39.9 ± 5.6
25
th-75
thpercentiles (IQR)
,!g.m
-35.3-13.5 (8.2)
O
3-summer (n=308)
mean ± SD
,!g.m
-363.0 ± 10.4
25
th-75
thpercentiles (IQR)
,!g.m
-356.9-67.8 (10.9)
IQR: interquartile range; SD: standard deviation
Correlations between assigned pollutant concentrations across the two indicators of ozone based on the first method were strong (r = 0.79, p ! 0.0001). The correlation between NO2 and SO2 was lower (r = 0.48, p ! 0.0001). O3-days and NO2 as well as O3-days and SO2
were not correlated (r = -0.05 and -0.04 respectively). Regarding the two different methods of air pollution assignment, the Pearson coefficients showed significant correlations for NO2
concentrations (p=0.48), for SO2 concentrations (p=0.33) and for ozone (p=0.66 between O3
-days and O3-summer and p=0.76 between O3-8hr and O3-summer).
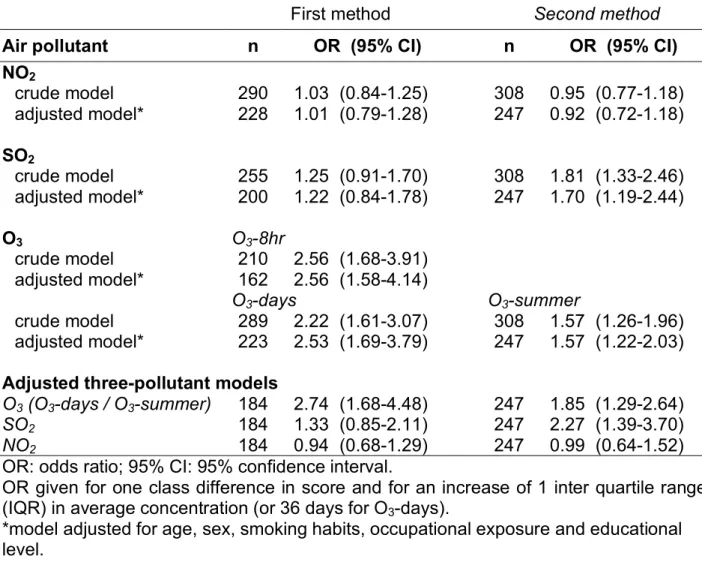
All pollutants assigned from the closest monitors (first approach) were positively associated with the integrated 4-class asthma severity score, but the associations reached statistical significance only for the two indicators of ozone. Results remained significant for both O3-8hr
and O3-days also in models adjusting for age, sex, smoking habits, occupational exposure,
and educational level (table 3). Taking into account the duration of residence did not change the results. Associations between ozone and the 4-class asthma severity score remained significant among the 94.8% of the subjects living since at least 1 year at the current address (OR =2.64 (1.74 – 4.00) for O3-days and 1.65 (1.27 – 2.14) for O3-summer). Results were
unchanged when adjusting on the number of years in the current residence.
Effect estimates of ozone were similar in three-pollutant models including O3, SO2, and NO2
(odds ratio (OR) for O3-days (95% confidence intervals (CI)) 2.74 (1.68-4.48). Relations with
ambient NO2 were not affected by gas cooking and no association was observed between
asthma severity score and cooking or heating with gas. Exposure values assigned from the IFEN model correlated with the 4-class asthma severity score in a similar way, and the positive association observed with annual SO2 became statistically significant.
Table 3 Associations between air pollution and the 4-class asthma severity score per
each increase of one IQR in air pollutant concentrations
First method
Second method
Air pollutant
n
OR (95% CI)
n
OR (95% CI)
NO
2crude model
290
1.03 (0.84-1.25)
308
0.95 (0.77-1.18)
adjusted model*
228
1.01 (0.79-1.28)
247
0.92 (0.72-1.18)
SO
2crude model
255
1.25 (0.91-1.70)
308
1.81 (1.33-2.46)
adjusted model*
200
1.22 (0.84-1.78)
247
1.70 (1.19-2.44)
O
3O3-8hr
crude model
210
2.56 (1.68-3.91)
adjusted model*
162
2.56 (1.58-4.14)
O3-days
O
3-summercrude model
289
2.22 (1.61-3.07)
308
1.57 (1.26-1.96)
adjusted model*
223
2.53 (1.69-3.79)
247
1.57 (1.22-2.03)
Adjusted three-pollutant models
O3 (O3-days / O3-summer)
184
2.74 (1.68-4.48)
247
1.85 (1.29-2.64)
SO2
184
1.33 (0.85-2.11)
247
2.27 (1.39-3.70)
NO2
184
0.94 (0.68-1.29)
247
0.99 (0.64-1.52)
OR: odds ratio; 95% CI: 95% confidence interval.
OR given for one class difference in score and for an increase of 1 inter quartile range
(IQR) in average concentration (or 36 days for O
3-days).
*model adjusted for age, sex, smoking habits, occupational exposure and educational
level.
Results for the simpler 5-level asthma score were very similar for all pollutants and both exposure assessment approaches (table S1 in the appendix). In the three-pollutant model with pollutants from the closest monitor, the 5-level asthma score was significantly associated only with O3 days (OR=2.02 (1.26-3.23) per one IQR of O3-days). With the IFEN
model values, O3-summer correlated significantly with severity (2.20 (1.54-3.15)).
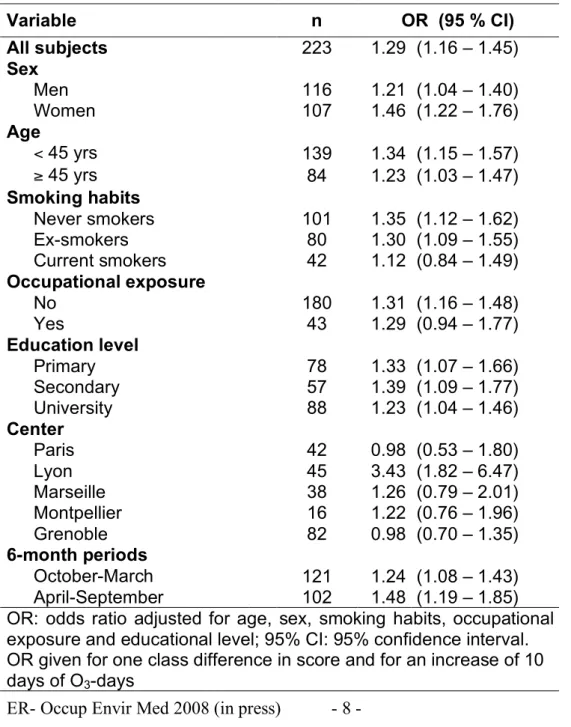
Table 4 presents relationships between the 4-class asthma severity and ozone (O3-days)
among subgroups. Associations remained robust among strata defined by sex, age, smoking habits, occupational exposure, and education level. None of the interaction terms was significant. Stratification on periods of examination showed significant associations of ozone exposure to asthma severity score among subjects participating both from October to March as well as from April to September (OR =1.24 (1.08-1.43) and 1.48 (1.19-1.85) respectively). Consistent results regarding stratification by the previous factors were observed for the 5-level asthma score (data not shown). For the 5-5-level asthma score, stratification was further studied according to treatment. There was no interaction with treatment (Odds ratios were 1.04 (0.73- 1.49) and 1.11 (0.99-1.25) for an increase of 10 days of O3-days, for untreated
and treated respectively; interaction p value =0.35).
Table 4 Relationship between the asthma severity score and ozone within subgroups
per each increase of 10 days of O
3-days
Variable
n
OR (95 % CI)
All subjects
223
1.29 (1.16 – 1.45)
Sex
Men
116
1.21 (1.04 – 1.40)
Women
107
1.46 (1.22 – 1.76)
Age
< 45 yrs
139
1.34 (1.15 – 1.57)
" 45 yrs
84
1.23 (1.03 – 1.47)
Smoking habits
Never smokers
101
1.35 (1.12 – 1.62)
Ex-smokers
80
1.30 (1.09 – 1.55)
Current smokers
42
1.12 (0.84 – 1.49)
Occupational exposure
No
180
1.31 (1.16 – 1.48)
Yes
43
1.29 (0.94 – 1.77)
Education level
Primary
78
1.33 (1.07 – 1.66)
Secondary
57
1.39 (1.09 – 1.77)
University
88
1.23 (1.04 – 1.46)
Center
Paris
42
0.98 (0.53 – 1.80)
Lyon
45
3.43 (1.82 – 6.47)
Marseille
38
1.26 (0.79 – 2.01)
Montpellier
16
1.22 (0.76 – 1.96)
Grenoble
82
0.98 (0.70 – 1.35)
6-month periods
October-March
121
1.24 (1.08 – 1.43)
April-September
102
1.48 (1.19 – 1.85)
OR: odds ratio adjusted for age, sex, smoking habits, occupational
exposure and educational level; 95% CI: 95% confidence interval.
OR given for one class difference in score and for an increase of 10
days of O
3-days
Effects of O3 across centers were statistically not heterogeneous (p for interaction: 0.07). The
size of the geographic areas where subjects lived was unequal with subjects from Marseille residing across a region some thirty times the size of the Grenoble area due to the hospital based sampling. Accordingly, the range of O3 concentrations across subjects also varied
across areas. E.g., among participants in Paris the IQR of the O3-days was only 5-26 but
rather wide in Montpellier (IQR: 3-90) (fig S1 in the appendix). Excluding the center with the highest value of ozone (Marseille) or the center with significant effect (Lyon) did not affect the effect estimates for O3-days (OR=1.28 (1.10-1.48) and 1.23 (1.10-1.38) respectively).
Defining ‘city’ as a random effect did not alter the results (OR=1.24 (1.08-1.42)). DISCUSSION
In the well characterized sample of more than 300 adult asthmatics from the EGEA study, higher residential concentrations of ozone were associated with more severe asthma. The findings were very similar for the integrated score of clinical symptoms and treatment over the past 12 months and the novel 5-level asthma symptom score. Moreover, results were not sensitive to the chosen exposure assessment approach nor to adjustment for age, sex, smoking habits, occupational exposure to asthmogens and educational level. Results were also similar for asthmatics with or without treatment, and for smokers or non-smokers. To the best of our knowledge, this is the first study using asthma severity scores to investigate effects of air pollution. As one score is anchored on symptoms and treatment, it better integrates the course of this disease where deteriorations of the state are usually coupled with adaptations in treatments among well managed patients. The consistent associations observed in this study consolidate the findings. While several panel studies and time series studies suggest the course of asthma to be correlated with ambient oxidant concentrations in adults, the severity score is a promising integrated outcome.
The interpretation of the temporal nature of the observed association between O3 and
asthma severity is challenging and must be put in context of the study design. Depending on the assessment of outcomes and exposures, cross-sectional analyses may investigate not only long-term effects but also sub-acute or acute effects. Our questionnaires asked about the occurrence of symptoms and treatment in the last 12 months, thus results may be interpreted as a summary of all acute effects experienced during the past year. In this case, results are comparable to similar findings in panel studies showing asthma symptoms among adults to increase with atmospheric pollutants, both in North America and in Europe[23] although some heterogeneity was observed in European cities. Deleterious effects of O3 in
moderate/severe adult asthmatics studied over one year have been reported from the Paris area.[5] The asthma severity score used in the present analysis includes frequency of attacks as well as symptoms between attacks and adaptive treatment. A complementary interpretation of the observed cross-sectional associations could be that asthma severity is increased as a consequence of chronic processes due to repeated long-term exposure. The fact that subjects who participated during winter showed similar associations with summer time ozone concentrations as those participating during the summer period may be an indication of sub-acute or longer term effects of ozone on asthma severity, as the ozone seasons in France are by and large restricted to the summer period. However, a conclusive distinction of acute, sub-acute or long-term effects of ambient O3 exposure cannot be made
with this cross-sectional approach nor in panel studies but would require large cohort studies. It would be particularly relevant to have repeated measurements at various seasons in large cohorts to disentangle subacute and chronic effects.
The association between acute, sub-acute, and carry-over chronic pathologies due to O3 exposure is also not fully elucidated in experimental studies. Nevertheless, plausible
biological mechanisms could explain the association of ozone with asthma severity. The powerful oxidant capacity of inhaled ozone is well known and could play a role for both acute and chronic effects by maintaining airway inflammation. Ozone has also been shown to
favour a Th2 pattern[24] and increase eosinophils[25] but neither IgE nor eosinophils in our population were related to asthma severity.[26] Endogenous and exogenous determinants of susceptibility to the adverse effects of ozone are most likely important, and a source of random noise if not controlled in the analyses. Interactions of ozone with genes involved in the regulation of oxidative stress, such as glutathione S-transferases have already been observed in children[27] and may play an important role in adults as well. Beyond acute effects, the pulmonary inflammatory response to inhaled ozone and other oxidants, such as cigarette smoke, is a mechanism which could explain sustained effects of these environmental factors. Acute and chronic effects of air pollution may be interrelated, especially among asthmatics, as the repeated acute inflammatory effects may contribute to the chronic processes of airway remodelling and to severity of asthma.[28] The importance of the various inflammatory patterns in severe and persistent asthma has recently been underlined[10] and further studies are needed to understand which pathways may be implicated, by combining environmental exposure, inflammatory markers and relevant genetic polymorphisms. Further studies should be conducted to improve exposure assessment in order to disentangle acute and chronic effects of air pollution. Information on the activity of the asthmatic disease over short periods, such as the last 15 days or 3 months should be collected as well. Indeed, the last recommendations of GINA which focus on asthma control, will favour such data collection.[29]
Strengths and limitations
A strong asset of the EGEA study is the detailed phenotypic characterisation of the sample recruited through chest clinics, allowing studying a wide range of asthma activity and severity. It can never be totally excluded that some subjects, especially among severe asthmatics do have a mixed form of chronic obstructive pulmonary disease (COPD) and asthma. However, in the context of the EGEA study, in which asthmatics were specifically recruited in specialized chest clinics, it is rather unlikely that COPD patients were misdiagnosed as asthma. Population based studies usually lack sufficient numbers of severe asthmatics. Evidence is increasing regarding the heterogeneity of asthma and severe asthma.[10]Asthma severity combining clinical items and treatment was assessed in close accordance to the 2002-2004 GINA guidelines principles,[15] but using the type of treatment rather than the daily doses of treatment. Our asthma severity score has previously been shown to be associated with other risk factors in the EGEA study as occupational exposure[8] and body mass index in women[12] and linked to the 2p23 genetic region.[30]
It is interesting that we see no difference between results based on the integrated severity score and the simpler symptoms score, reflecting more the activity of the disease. The continuous asthma score based on symptoms has recently been recommended following observations from the European Community Respiratory Health survey as a relevant phenotype to assess associations with environmental determinants.[31] While this score is simpler to assess as it requires no treatment information one may argue to encounter difficulties to assess the effect of air pollution on severity due to the interaction between exposure, symptom occurrence, and changes in treatment. In our sample of asthmatics, effects of O3 were similar for those with or without treatment. More research is
needed to understand the strength and limitations of the two scores and their use in etiologic research.
The association of asthma severity with air pollution could have been biased by recruitment characteristics. All hospitals were homogeneous regarding their recruitment. They were all secondary hospitals with a relatively high proportion of severe asthmatics. If greater distance from the main city was related to greater severity, it could have biased the association of asthma severity with ozone. Indeed, the severity was independent of the distance from the hospital and therefore such bias is unlikely.
The estimation of long-term exposure is a challenge. Estimates of concentrations differed between the two approaches due to the inherently differed methods and data used. Both approaches have their strengths and limitations and it is impossible to evaluate which
approach provides estimates closer to the true ambient concentrations. Having two approaches available is a strength of our study and the similarity in the O3 and NO2 results
across methods support our findings. As mentioned in methods, the IFEN model was available for 1998. Thus for participants in the early 1990’s, the assigned exposure may be less accurate than for participants during the later years. In line with this assumption, OR’s were slightly smaller among early (1991-1993) participants compared to late (1994-1995) participants, but remained significant in both groups (data not shown). Most importantly though, ozone effects remained unchanged even in three-pollutant models including adjustment for NO2 as a marker of traffic related emissions.
The null findings for NO2 must be put in context of the exposure assignment methods.
NO2 concentrations are affected by local traffic sources, and concentrations may
substantially differ within the first 100 meters of busy roads. The two approaches used in the present study were not designed to capture these local contrasts. Our ‘simpler approach’, i.e. the use of the closest monitor, did take into account the closest traffic monitor of NO2 for
people living close to streets, while the IFEN model, based on background monitors only, and a 4x4 km grid, is less sensitive to proximity to traffic. However, the 4x4 km grid model was refined with network traffic and emission registries of NOx. Thus, to investigate effects of
traffic emissions on asthma severity, other exposure assignments may be needed such as personal measurements taken with passive samplers, traffic or land use data within narrow buffers around the residence, or geo-spatial models using higher spatial resolution. It is worthwhile to conduct projects targeted at traffic related exposures given the large number of people in Europe living very close to often extremely busy roads.[32] Moreover, we only assigned exposure to residential address as no information on work place or time activity patterns were available, as in most studies conducted in adults.[33] In the first approach using the closest monitor, the maximum distance chosen between residential address and monitor was 40 km and this distance varies among studies with some studies going as far as 80 km,[34] but most of our subjects (93%) lived within 10 km of a monitor. While this rather short distance minimizes the error in assigned exposure for homogenously distributed pollutants such as O3 or SO2, errors are expected to be larger for spatially heterogeneous
pollutants such as NO2. We expect these errors to be non-systematic, thus biasing
associations toward the null.
The contrast in the assigned exposure was rather low in case of NO2 and SO2, with
respectively a 1.5-fold and 1.8-fold change across the inter-quartile range (IQR) of concentrations (31-45 and 15-27 respectively; closest monitor approach), thus affecting the statistical power to observe effects. In case of O3,power was clearly better with a 2.8-fold
difference (IQR: 20-56). The IFEN model resulted in similar contrasts for NO2 whereas those
for SO2 were stronger (2.5-fold increase). This may explain why associations became
significant in this model. IQR for O3 was lower in the IFEN model (1.2-fold increase),
nevertheless results remained statistically significant and support the interpretation that oxidant pollutants indicated by ambient ozone affect asthma severity.
We found some evidence for heterogeneity of effects across centers with far smaller estimates in some cities. Both analyses performed adding center as a random effect or after exclusion of the centers possibly driving the association in relation to the highest ozone exposure, did not change the main estimate. However, due to the limited sample size within cities, it is not possible to further elucidate whether effects of O3 to be center specific, driven,
for example, by other environmental or population factors present in only a few locations, or whether heterogeneity to be a random finding. It is of note though that the size of the geographic areas was unequal across these cities and that the within-city contrasts of pollutants also differed across cities. These factors may all contribute to heterogeneity.
The question is whether the observed associations reflect an effect of O3 or whether
we have personal measurements of O3 exposure. There is some argument that personal O3
exposure may be more strongly correlated with ambient particles than with ambient O3
concentrations.[35] This finding, while not universally true, may be due to the well known heterogeneity between indoor and outdoor concentrations of O3 with usually very low
concentrations indoors where people spend 70-80% of their time.[36] Our estimates for O3
were not sensitive to the inclusion of ambient NO2 in the three-pollutant model. Based on
other studies one may expect substantial correlations between ambient PM and NO2[37] thus
explaining the O3 findings with particles does not seem to be very plausible in our study. Air
conditioning was not assessed, but was not frequently used in France at the time of the survey. To what extent O3 may be a marker of other constituents in the toxic mixture of
ambient air cannot be answered with our study and the heterogeneity across centers may partly be explained by O3 indicating in part different characteristics of air pollution across
these regions.
In conclusion, we observed significant associations between ambient O3
concentrations and asthma severity in adults. Results were consistent across two approaches of individual assignment of exposure, as well as for two complementary markers of asthma severity. More studies are needed to elucidate the time sequence of pollution effects and to evaluate the impact of exposure of air pollution on asthma severity. But the present results add to the evidence of adverse effects of O3 at levels far below current air
quality standards among susceptible people, namely those with asthma, supporting more stringent regulations of ambient O3,[38] thought to be set to protect public health. The use of
asthma severity scores to investigate the contribution of environmental factors to this complex and dynamic disease appears very promising.
Main messages:
- Ambient ozone concentrations were significantly associated to asthma severity in adults. - These effects remained stable with adjustment for urban background pollution.
- Sulphur dioxide - but not nitrogen dioxide - taken as a marker of urban background pollution correlated with asthma severity as well.
Policy implications:
- The study suggests that asthmatics are affect by ozone at concentrations far below current standards set to protect public health.
- Asthmatics are expected to benefit from further reductions of summer ozone concentrations.
EGEA Cooperative group
Coordination : F Kauffmann; F Demenais (genetics); I Pin (clinical aspects).
Respiratory epidemiology : Inserm U 700, Paris M Korobaeff (Egea1), F Neukirch (Egea1); Inserm U 707, Paris : I Annesi-Maesano ; Inserm U 780, Villejuif : F Kauffmann, N Le Moual, R Nadif, MP Oryszczyn ; Inserm U 823, Grenoble : V Siroux.
Genetics : Inserm U 393, Paris : J Feingold ; Inserm U 535, Villejuif : MH Dizier ; Inserm U 794, Paris : E Bouzigon , F Demenais ; CNG, Evry : I Gut , M Lathrop.
Clinical centers : Grenoble : I Pin, C Pison; Lyon : D Ecochard (Egea1), F Gormand, Y Pacheco ; Marseille : D Charpin (Egea1), D Vervloet ; Montpellier : J Bousquet ; Paris Cochin : A Lockhart (Egea1), R Matran (now in Lille) ; Paris Necker : E Paty, P Scheinmann ; Paris-Trousseau : A Grimfeld, J Just.
Data and quality management : Inserm ex-U155 (Egea1) : J Hochez ; Inserm U 780, Villejuif : N Le Moual, C Ravault ; Inserm U 794 : N Chateigner ; Grenoble : J Ferran.
Acknowledgements: The authors thank all those from AASQA (certified air-quality monitoring agencies), and S. Bouallala, H. Desqueyroux, and C. Elichegaray from the
ADEME, for their help in the assessment of air pollution in the areas of Lyon, Grenoble, Marseille, Montpellier and Paris.
The authors thank M. Ba and all those from the French Institute for Environment, and particularly N. Jeannée from Géovariances, for their work on the geo-spatial models.
Partially supported by the European Associated Laboratory on Respiratory Epidemiology, a joint initiative of INSERM, Paris and CREAL, Barcelona.
Competing interests None declared
Funding
Supported in part by Inserm, ADEME (French Environment and Energy Management Agency), AFSSET (French Agency for Environmental & Occupational Health Safety) N° ES-2005-015, ANR (French National Agency for Research) N° 05-SEST-020-02/05-9-97, European Commission as part of the Ga2len project, Global Allergy and Asthma European Network (contract n° FOOD-CT-2004-506378)
Copyright
The Corresponding Author has the right to grant on behalf of all authors and does grant on behalf of all authors, an exclusive licence (or non-exclusive for government employees) on a worldwide basis to the BMJ Publishing Group Ltd and its Licensees to permit this article (if accepted) to be published in Occupational and Environmental Medicine and any other BMJPGL products to exploit all subsidiary rights, as set out in our licence
(http://oem.bmjjournals.com/misc/ifora/licenceform.shtml).
REFERENCES
1. Brunekreef B, Holgate ST. Air pollution and health. Lancet. 2002;360:1233-1242. 2. Pope CA 3rd, Dockery DW. Health effects of fine particulate air pollution: lines that
connect. J Air Waste Manag Assoc. 2006;56:709-742.
3. Künzli N, Tager IB. Air pollution: from lung to heart. Swiss Med Wkly. 2005;135:697-702.
4. Boezen HM, Vonk JM, van der Zee SC, et al.. Susceptibility to air pollution in elderly males and females. Eur Respir J. 2005;25:1018-1024.
5. Desqueyroux H, Pujet JC, Prosper M, et al. Short-term effect of low-level air pollution on respiratory health of adults suffering from moderate to severe asthma. Environ Res Section A. 2002;89:29-37.
6. Gent JF, Triche EW, Holford TR, et al. Association of low-level ozone and fine particles with respiratory symptoms in children with asthma. JAMA. 2003;290:1859-1867.
7. Hiltermann TJN, Stolk J, van der Zee SC, et al. Asthma severity and susceptibility to air pollution. Eur Respir J. 1998;11:686-693.
8. Le Moual N, Siroux V, Pin I, et al on behalf of the Epidemiological Study on the genetics and Environment of Asthma (EGEA). Asthma severity and exposure to occupational asthmagens. Am J Respir Crit Care Med. 2005;172:440-445.
9. Pekkanen J, Sunyer J, Anto JM, et al; European Community Respiratory Health Study. Operational definitions of asthma in studies on its aetiology. Eur Respir J. 2005;26:28-35.
10. Wenzel SE. Asthma: defining of the persistent adult phenotypes. Lancet. 2006; 368:804-813.
11. Siroux V, Pin I, Oryszczyn MP, et al. Relationships of active smoking to asthma and asthma severity in the EGEA study. Epidemiological study on the Genetics and Environment of Asthma. Eur Respir J. 2000;15:470-477.
12. Varraso R, Siroux V, Maccario J, et al on behalf of the Epidemiological Study on the genetics and Environment of Asthma (EGEA). Asthma severity is associated with body mass index and early menarche in women. Am J Respir Crit Care Med. 2005;171:334-339.
13. Kauffmann F, Dizier MH, Pin I, Paty E, Gormand F, Vervloet D et al. Epidemiological study of the genetics and environment of asthma, bronchial hyperresponsiveness, and atopy: phenotype issues. Am J Respir Crit Care Med 1997;156:S123-S129. 14. Kauffmann F, Annesi-Maesano I, Liard R, et al. Construction et validation d'un
questionnaire en épidémiologie respiratoire. L'exemple du questionnaire de l'Etude Epidémiologique des facteurs Génétiques et Environnementaux de l'Asthme, l'hyperréactivité bronchique et l'atopie (EGEA). Rev Mal Respir. 2002;19:323-333. 15. National Heart Lung and Blood Institute. Global initiative for asthma. Global strategy
for asthma management and prevention. NHLBI/WHO workshop report. Bethesda (Md): National Institutes of Health, 1995. Update 2002. NIH publication #02-3659. 16. Pin I, Siroux V, Cans C, et al. Familial resemblance of asthma severity in the EGEA
study. Am J Respir Crit Care Med. 2002;165:185-189.
17. Siroux V, Kauffmann F, Pison C, et al. Caractère multidimensionnel de la sévérité de l'asthme dans l'enquête EGEA. Rev Mal Respir. 2004;21:917-924.
18. Jeannée N. Cartography of atmospheric pollution at the France national scale for the atlas of air quality monitoring. Geovariances, ADEME/IFEN (French Institute of Environment), France, 2006, 98 p.
19. Chilès JP, Delfiner P. Geostatistics: modelling spatial uncertainty, Wiley Series in Probability and Mathematical Statistics. 1999:695 p.
20. Jeannée N, Mosqueron L, Nedellec V, et al. Evaluation de l’exposition des populations à la pollution atmosphérique: méthodologies existantes et application aux PM10 à l’échelle de la France métropolitaine. Pollution Atmosphérique. 2006;190:197-209.
21. Jeannée N, Nedellec V, Bouallala S, et al. Geostatistical assessment of long term human exposure to air pollution. In geoENV V - Geostatistics for Environmental Applications, eds. Renard, Demougeot-Renard & Froidevaux, Kluwer Academic Publishers. 2004:161-172.
22. Kennedy SM, Le Moual N, Choudat D, et al. Development of an asthma specific job exposure matrix and its application in the epidemiological study of genetics and environment in asthma (EGEA). Occup Environ Med. 2000;57:635-641.
23. Sunyer J, Spix C, Quénel P, et al. Urban air pollution and emergency admissions for asthma in four european cities : the APHEA project. Thorax. 1997;52:760-765.
24. Neuhaus-Steinmetz U, Uffhausen F, Herz U, et al. Priming of allergic immune responses by repeated ozone exposure in mice. Am J Respir Cell Mol Biol. 2000;23:228-233.
25. Peden DB, Boehlecke B, Horstman D, et al. Prolonged acute exposure to 0.16 ppm ozone induces eosinophilic airway inflammation in asthmatic subjects with allergies. J Allergy Clin Immunol. 1997;100:802-808.
26. Oryszczyn MP, Bouzigon E, Maccario J, et al. Interrelationships of quantitative asthma-related phenotypes in the EGEA study. J Allergy Clin Immunol. 2007;119:57-63.
27. Romieu I, Ramirez-Aguilar M, Sienra-Monge JJ, et al. GSTM1 and GSTP1 and respiratory health in asthmatic children exposed to ozone. Eur Respir J. 2006;28:953-959.
28. Frey U, Bordbeck T, Majumdar A, et al. Risk of severe asthma episodes predicted from fluctuation analysis of airway function. Nature. 2005;438:667-670.
29. Global strategy for asthma management and prevention (update 2006): Global Initiative for Asthma (GINA). URL: http://www.ginasthma.org. Date last update November 2006, date last accessed 14 march 2007].
30. Bouzigon E, Siroux V, Dizier MH, et al. Scores of asthma and asthma severity reveal new regions of linkage in EGEA families. Eur Respir J. 2007:30;253-259.
31. Sunyer J, Pekkanen J, Garcia-Esteban R, et al. Asthma score: predictive ability and risk factors. Allergy. 2007;62:142-148.
32. Gauderman WJ. Air pollution and children--an unhealthy mix. N Engl J Med. 2006;355:78-79.
33. Künzli N, Tager B. Long-term health effects of particulate and other ambient air pollution : research can progress faster if we want to it. Environ Health Perspect. 2000;108:915-918.
34. Schildcrout JS, Sheppard L, Lumley T, et al. Ambient air pollution and asthma exacerbations in children: an eight-city analysis. Am J Epidemiol. 2006;164:505-517. 35. Levy JI, Chemerynshki SM, Sarnat JA. Ozone exposure and mortality. An empiric
Bayes metaregression analysis. Epidemiology. 2005;16:458-468.
36. Schweizer C, Edwards RD, Bayer-Oglesby L, et al. Indoor time-microenvironment-activity patterns in seven regions of Europe. J Expo Sci Environ Epidemiol. 2006;17:170-181.
37. Schindler C, Künzli N, Bongard JP, et al. Short-term variation in air pollution and in average lung function among never-smokers (SAPALDIA). Am J Respir Crit Care Med. 2001;163:356-361.
38. U.S. EPA. Air Quality Criteria for Ozone and Related Photochemical Oxidants (Final). U.S. Environmental Protection Agency, Washington, DC, 2006. EPA/600/R-05/004aF-cF.
Figure 1 Legend
The bottom and top of the box represents the 25th and 75th percentiles, respectively. The
upper and lower whiskers represent the maximum and minimum, respectively. The horizontal line through the middle of the box is the median.
Median values were 36 !g.m-3 for NO
2, 19 !g.m-3 for SO2, 68 !g.m-3 for O3-8hr and 30 days
for O3-days.
Figure 1 - Box plot of assigned pollutant concentrations among the studied asthmatics according to the 1st method with annual concentrations based on 1991-1995 nearby background
APPENDIX
AIR POLLUTION ASSESSMENT BY THE FIRST METHOD
Air pollution concentrations were derived from the French Agency for Environment and Energy (ADEME) data bank using both background and traffic monitor stations. Air pollution was assigned to subjects residences in two steps. First, the residential address of subjects and air pollution monitors were located on maps by plane coordinates (after transformation of geographical coordinates if needed). Although subjects were recruited through patients consulting in five city hospitals, the residential areas covered a region more than twenty times larger than the city areas. A total of 69 monitors (54 background stations and 15 traffic stations) were used for the assignment of residential concentrations. Second, assignment of the closest monitor to each residence was done in two ways: for subjects living within 100m of main roads, values of the closest NO2 or SO2 traffic station were used.
17% of subjects were assigned with data of traffic stations (14% of subjects in Paris area, 12% in Lyon area, 28% in Marseille area, 45% in Montpellier area, and 13% in Grenoble area). Traffic stations do not monitor O3. For all other subjects and for O3, assignment was
based on concentrations recorded at the closest background station (urban, suburban or rural station). A total of 93% or subjects lived within 10 km of a monitor. The maximum distance was 40 km. If more than two monitors were equally distant, the mean value of these monitors was assigned.
Air pollution exposure could not be assessed for 38, 73 and 39 subjects for NO2, SO2
and O3-days respectively for whom there was no station within 40 km. For O3-8hr, there was
no available data for two areas covering the region of Lyon and Montpellier. Air pollution monitoring has been expanded in France during the past years but increased since 1995. If no data was available at the time of the survey, we used the air pollution trends as observed during later years to linearly extrapolate to earlier years. Long-term changes in air quality usually follow similar trends over several years. SO2 concentrations have dramatically
decreased during the 1990’s, while NO2 decreased very slightly and O3 increased also very
little.[1] In this context, back extrapolation was the most accurate approach in presence of missing data, which assumes that a consistent evolution over the period of interest. For O3
concentrations 70% of subjects got assigned back-extrapolated values, according to a pattern with slight increase of O3 between 1991 and 1995. In case of NO2 and SO2 regular
monitoring started earlier, thus 55% and 25% of subjects’ locations required back-extrapolation. Health assessments were conducted throughout the year. Therefore, the annual mean concentrations of the same year would poorly reflect past exposure (during the 12 months prior the visit) among subject participating early in the year. Therefore participants during January-June were assigned the annual mean of the previous calendar year and those with assessments during July-December, with the mean of the current calendar year. ANALYSIS
Ordinal logistic regression was performed to assess association between air pollution and the 4-class asthma severity score. Tests of the proportional odds assumption were systematically performed. For NO2, SO2 and O3-8hr, the hypothesis of proportionality was not
rejected. As the test appeared significant for O3-days and O3 summer, we also performed the
analysis based using multinomial regression, which does not assume proportional odds ratios. The global association between ozone and asthma severity was significant and all OR were higher than 1, supporting associations between asthma severity and ozone, independently of the model.
Taking into account familial dependence was complex and it was clarified with two analyses: First, mixed logistic regression models were performed considering a dichotomous asthma severity score defining mild asthmatics by the 1st or the 2nd class and moderate to
severe asthmatics by the 3rd or the 4th class (Genmod procedure from SAS). Second, both
logistic regression models and ordinal logistic regression models were run in a random population of 182 subjects (one subject per family). Familial aggregation had no impact on results.
REFERENCES:
1. European Environment Agency report. Air pollution in Europe 1990-2004. Available at: 84phttp://reports.eea.europa.eu/eea_report_2007_2/en/Air_pollution_in_Europe_1990_2004. pdf (accessed on April 2008).
Table S1 Associations between air pollution and the 5-level asthma score per each
increase of one IQR in air pollutant concentrations
First method
Second method
Air pollutant
n
OR (95% CI)
n
OR (95% CI)
NO
2crude model
279
0.96 (0.79-1.17)
295
0.95 (0.77-1.18)
adjusted model*
221
0.92 (0.73-1.17)
238
0.94 (0.74-1.21)
SO
2crude model
247
1.06 (0.78-1.44)
295
1.37 (1.01-1.84)
adjusted model*
194
0.98 (0.68-1.41)
238
1.39 (0.98-1.97)
O
3O3-8hr
crude model
201
2.21 (1.48-3.33)
adjusted model*
171
2.27 (1.41-3.63)
O3-days
O
3-summercrude model
278
1.93 (1.40-2.65)
295
1.57 (1.26-1.96)
adjusted model*
217
2.09 (1.42-3.09)
238
1.62 (1.26-2.09)
Adjusted three-pollutants models
O3 (O3-days / O3-summer)
179
2.02 (1.26-3.23)
238
2.20 (1.54-3.15)
SO2
179
1.08 (0.69-1.67)
238
1.41 (0.90-2.23)
NO2
179
0.79 (0.58-1.08)
238
1.41 (0.93-2.15)
OR: odds ratio; 95% CI: 95% confidence interval.
OR given for one class difference in score and for an increase of 1 inter quartile range in
average concentration (or 36 days for O
3-days).
*model adjusted for age, sex, smoking habits, occupational exposure and educational
level.
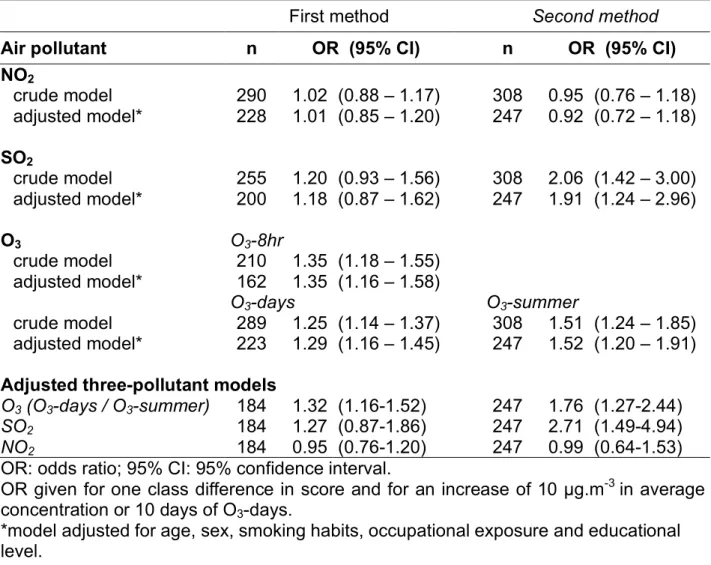
Table S2 Associations between air pollution and the 4-class asthma severity score per
each increase of 10 units of air pollutants
First method
Second method
Air pollutant
n
OR (95% CI)
n
OR (95% CI)
NO
2crude model
290
1.02 (0.88 – 1.17)
308
0.95 (0.76 – 1.18)
adjusted model*
228
1.01 (0.85 – 1.20)
247
0.92 (0.72 – 1.18)
SO
2crude model
255
1.20 (0.93 – 1.56)
308
2.06 (1.42 – 3.00)
adjusted model*
200
1.18 (0.87 – 1.62)
247
1.91 (1.24 – 2.96)
O
3O3-8hr
crude model
210
1.35 (1.18 – 1.55)
adjusted model*
162
1.35 (1.16 – 1.58)
O3-days
O
3-summercrude model
289
1.25 (1.14 – 1.37)
308
1.51 (1.24 – 1.85)
adjusted model*
223
1.29 (1.16 – 1.45)
247
1.52 (1.20 – 1.91)
Adjusted three-pollutant models
O3 (O3-days / O3-summer)
184
1.32 (1.16-1.52)
247
1.76 (1.27-2.44)
SO2
184
1.27 (0.87-1.86)
247
2.71 (1.49-4.94)
NO2
184
0.95 (0.76-1.20)
247
0.99 (0.64-1.53)
OR: odds ratio; 95% CI: 95% confidence interval.
OR given for one class difference in score and for an increase of 10 !g.m
-3in average
concentration or 10 days of O
3-days.
*model adjusted for age, sex, smoking habits, occupational exposure and educational
level.
Table S3 Associations between air pollution and the 5-level asthma score per each
increase of 10 units of air pollutants
First method
Second method
Air pollutant
n
OR (95% CI)
n
OR (95% CI)
NO
2crude model
279
0.97 (0.84 – 1.12)
295
0.95 (0.76 – 1.18)
adjusted model*
221
0.94 (0.80 – 1.12)
238
0.94 (0.74 – 1.21)
SO
2crude model
247
1.05 (0.81 – 1.35)
295
1.46 (1.02 – 2.10)
adjusted model*
194
0.98 (0.73 – 1.34)
238
1.49 (0.98 – 2.28)
O
3O3-8hr
crude model
201
1.29 (1.13 – 1.47)
adjusted model*
171
1.30 (1.12 – 1.52)
O3-days
O
3-summercrude model
278
1.20 (1.10 – 1.31)
295
1.51 (1.23 – 1.85)
adjusted model*
217
1.23 (1.10 – 1.37)
238
1.56 (1.24 – 1.96)
Adjusted three-pollutants models
O3 (O3-days / O3-summer)
179
1.22 (1.07-1.39)
238
2.06 (1.48-2.86)
SO2
179
1.06 (0.74-1.53)
238
1.53 (0.88-2.65)
NO2
179
0.85 (0.68-1.06)
238
1.42 (0.93-2.17)
OR: odds ratio; 95% CI: 95% confidence interval.
OR given for one class difference in score and for an increase of 10 !g.m
-3in average
concentration or 10 days of O
3-days.
*model adjusted for age, sex, smoking habits, occupational exposure and educational
level.
Figure S1
Box plot of assigned pollutant concentrations among asthmatics according to the centers with the first method.The bottom and top of the box represents the 25th and 75th percentiles, respectively.
The upper and lower whiskers represent the maximum and minimum, respectively.