READ THESE TERMS AND CONDITIONS CAREFULLY BEFORE USING THIS WEBSITE. https://nrc-publications.canada.ca/eng/copyright
Vous avez des questions? Nous pouvons vous aider. Pour communiquer directement avec un auteur, consultez la première page de la revue dans laquelle son article a été publié afin de trouver ses coordonnées. Si vous n’arrivez pas à les repérer, communiquez avec nous à [email protected].
Questions? Contact the NRC Publications Archive team at
[email protected]. If you wish to email the authors directly, please see the first page of the publication for their contact information.
NRC Publications Archive
Archives des publications du CNRC
This publication could be one of several versions: author’s original, accepted manuscript or the publisher’s version. / La version de cette publication peut être l’une des suivantes : la version prépublication de l’auteur, la version acceptée du manuscrit ou la version de l’éditeur.
Access and use of this website and the material on it are subject to the Terms and Conditions set forth at
Thermal performance of idealized double windows, unvented
Christensen, G.; Brown, W. P.; Wilson, A. G.
https://publications-cnrc.canada.ca/fra/droits
L’accès à ce site Web et l’utilisation de son contenu sont assujettis aux conditions présentées dans le site LISEZ CES CONDITIONS ATTENTIVEMENT AVANT D’UTILISER CE SITE WEB.
NRC Publications Record / Notice d'Archives des publications de CNRC:
https://nrc-publications.canada.ca/eng/view/object/?id=76268859-d63b-4a5b-a32c-5f11ff7183ac https://publications-cnrc.canada.ca/fra/voir/objet/?id=76268859-d63b-4a5b-a32c-5f11ff7183acSer
TH1
N21r2
Ino.
223
c. 2
iBLDG
1
NATIONAL
RESEARCH
COUNCIL
C A N A D A
DIVISION
OF BUILDING RESEARCH
THERMAL PERFORMANCE O F
IDEALIZED DOUBLE WJNDOWS, UNVENTED
BY
G.
CHRISTENSEN, W. P. BROWN AND
A.
G.
WILSON
PRESENTED AT THE AMERICAN SOCIETY OF HEATING,
71ST ANNUAL MEETING, CLEVELAND, OHIO, 1964.
\
NATIONAL R E S i , \ t t C H C O U N C I L
i
RESEARCH PAPER N O 2254
O F T H E
DIVISION O F BUILDING RESEARCH
PRICE 25 C E N T S
QTTAWA
T h i s publication i s being d i s t r i b u t e d by the Division of Building R e s e a r c h of the National R e s e a r c h Council. It should not be r e p r o d u c e d in whole o r in p a r t , without p e r m i s - s i o n of t h e o r i g i n a l p u b l i s h e r . T h e Division would be glad to be of a s s i s t a n c e i n obtaining s u c h p e r m i s s i o n .
Publications of the Division of Building R e s e a r c h m a y be obtained by m a i l i n g the a p p r o p r i a t e r e m i t t a n c e , ( a Bank, E x p r e s s , o r P o s t Office Maney O r d e r o r a cheque m a d e pay- able a t p a r in Ottawa, to the R e c e i v e r G e n e r a l of Canada, c r e d i t National R e s e a r c h Council) to the National R e s e a r c h Council, Ottawa. S t a m p s a r e not acceptable.
A coupon s y s t e m has been introduced to m a k e pay- m e n t s for publications r e l a t i v e l y s i m p l e . C ~ u p o n s a r e a v a i l - able i n denominations of
5,
2 5
and50
c e n t s , and m a y be ob- tained by m a k i n g a r e l n i t t a n c e a s indicated above. T h e s e coupons m a y be used f o r the p u r c h a s e of a l l National R e s e a r c h Council publications including specifications of the Canadian Government Specifications B o a r d .G.
CHRISTENSENW.
P.
BROWNA. G. WILSON
Member
ASHRAE
Thermal oerformance
of idealized double windows, unvented
Windows usually provide less resistance to heat flowthan other components of a building enclosure. I n win- ter, the lowest inside surface temperatures generally occur on windows, and the relative humidity that can be maintained in buildings is limited by condensation on these surfaces. Double windows are widely used in northern climates to reduce window heat losses and to increase the allowable relative humidity.
Heat transmission coefficients and inner surface temperatures of double windows depend principally on the geometry of the air space, the heat transfer condi- tions at inner and outer surfaces, and on the design of frames and sash. Extensive measurements have been made of average heat transmission characteristics of vertical air spaces.l Similarly, information is available on the average surface coefficients for natural convec- tion and various degrees of forced convection.'
With this information, it is possible to calculate the overall heat transmission and a mean value of the inside surface temperature. The actual inside surface tempera- tures, ho-cvever, are variable with height, due to vertical variations in the air space temperature and in surface heat transfer coefficients. With natural convection, or low air velocity at the inner surface, temperatures near the bottom may be significantly lower than those determined on the basis of average conductances. Published in-
G. Christensen is with the Danish National Building Research Institute, Copenhagen, Guest worker with Building Services Sec- tion, D B R / N R C , 1961-1962. W. P. Brown is Research Oficer, Building Services Section, D B R / N R C , Ottawa, A . G . Wilson is Head, Building Services Section, D B R / N R C , Ottawa. This paper was prepared for presentation at the A S H R A E 71st Annual Meeting, Clevelunzd, Ohio, June 29-July I , 1964.
formation on the nature of the inside surface temperature variations is very limited.
Where double windows incorporate metal frames, sash or track, the temperatures of the inner surfaces of these components can be considerably lower than those of the inner pane and can thus place a serious limitation on building humidity, unless the unit is care- fully designed. In addition, the overall heat flow through the window may be increased significantly. In order t o utilize fully the advantage of double windows in per- mitting higher interior humidity the temperature of all components of the window should be as high as the minimum temperature on the inner pane.
With the recent tendency toward humidified build- ings, it has become increasingly important to define the interior surface temperature characteristics of win- dows so that the windows, or the humidity, can b e selected so as to avoid serious condensation problems. The thermal performance of a double window can be no better than that of the glass-enclosed air space, so that this becomes a basic yardstick in designing windows and in their rating.
This paper reports the results of measurements of inside surface temperatures on a basic double win- dow arrangement consisting of two sheets of glass sur- rounded by insulated construction. Principal variables were air space width and height and overall tempera- ture difference. Carefully controlled natural convec- tion conditions were ~ r o v i d e d on the warm side, with forced convection on the cold side. The surface tem- peratures are related to temperatures measured in the air space and to the surface heat transfer conditions. I n addition, results are given of the average surface-to- surface thermal conductance of each configuration.
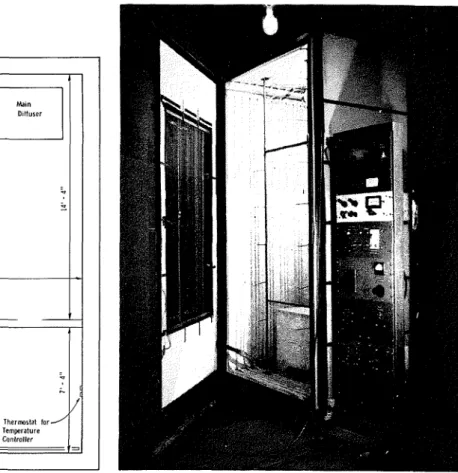
C O L D R O O M
Ceillng Height - 10 11.
Fig. I Plan view of cold room Fig. 2 Guarded lzot box bc!si.de ~tiindou: arrangenzent
TEST
ARRANGEMENT
All tests were carried out with a guarded hot box and associated cold room f a ~ i l i t y , ~ shown in Fig. 1. The cold room is divided by a wall into two compartments. The cold side can be controlled at temperatures from $40 F to -60 F with air temperature variations at any point less than k 0 . 1 F, and a floor to ceiling gradient of less than k 0 . 5 F. Air is discharged hori- zontally at ceiling level from the diffuser in use and returns through an opening in the front of the diffuser near the floor. Air velocity at the test wall is approxi- mately 5 mph in a downward direction. The warm side is heated by electric gravity baseboard convectors and is con~rolled to k 0 . 2 5 F at the thermostat.
The guarded hot box (Fig. 2 ) is designed to measure heat flow through a 4-ft-wide by 8-ft-high test section placed between the warm and cold sides. The box is lined with radiant heating panel through which constant temperature liquid is circulated to provide uniform surface tem~eratures. In these tests air circulation in the box was by natural convection. At the greatest
-
heat input required, the maximum air temperature gradient from top to bottom was about 4% F, although the maximum air temperature variation over the height of the test window was less than 3 F. The average air temperature was approximately 3 F lower ,than the box surface temperature. The average heat transfer coeffi- cients at th; specimen surface provided by the apparatus are close to the value for vertical surfaces given in the ASHRAE Guide And Data Book for natural convection conditions.The test window consisted of two sheets of 3/16in. glass, separated by an air space, mounted in an open-
ing, 3 ft wide by 5 ft high, which was centrally located in a panel of insulated construction, 4 f t wide by 8 ft high (Fig. 3 ) . The inner pane was permanently mounted flush with the inside surface of the panel. The outer pane was movable so that the air space thicknesses could be changed without moving the hot box. Air space thicknesses of
1/4, 1/2,
x,
1, 2, 4, and 6 in, were investigated for the 5-ft-high window. Measurements were also carried out on a 2%-ft-high window, for which the upper half of the opening was filled with rigid insulation; air space tliicknesses were1/4,
v2,
%,
1, 2, and 3 in. Inner a n d outer panes were sealed into
the opening with tape to prevent air leakage. A series of temperature measurements were made with a light plywood frame around the interior perimeter of the 5-ft-high window configuration, projecting 3 in. and 8 in. from the inside surface, so as to simulate recessing of a window into the wall in which it is installed.
Air temperatures on the warm and cold sides and in the air space were measured with 30-gauge copper- constantan unshielded thermocouples, positioned ve .- tically as shown in Fig. 3. On the warm and cold sides two thermocouples were located at each level, 1 ft on either side of the vertical centerline. For the 2%-ft- high window the air space thermocouples were located at the same relative heights as for the 5-ft-high window.
The air space thermocouple junctions were sup- ported by horizontal l/s-in. diameter solid brass rods soldered to a vertical %-in. dia brass tube, 8 in. away, through which the lead wires were carried. In this way flow conditions near the junctions were not aflected by the vertical support. The support was held in place by compression against the top and bottom surfaces of
35 f "
l
8 8 b Thermocouplei
Junction --0-0----
7
'
-
-
- 4F i g . 4 S~~rfacc? thc~rmocouple Eocatiorzs on 5-ft zciin-
dozc;, .viewed from warn1 sidc~
top of the air space and 1.5
F
too high at the bottomFig. 3 Test arrangenzent for the lowest cold room temperature.
Glass surface temperatures were measured with thermocouple junctions of 0.002-in.-thick copper-con- stantan ribbon fabricated as shown in Fig. 4. T h e the opening and was positioned so that the junctions junctions were soldered to 30-gauge copper-constantan
a t the center the air space- Air space tempera- lead wire. Junctions and connections were glued to the
tures are 1 in. and wider, since outside surface of each of the panes in the pattern shown. discrepancies due to positioning of the junctions be- , ~ h , error ,ith this type of junction was determined came excessive a t smaller air space thicknesses. and found to be small; using measured corrections i t Because of net radiation heat exchange between the possible to reduce it to less than +0.25
F
for sur- thermocouple junctions and adjacent glass surfaces, air face temperatures measured on the warm side.temperatures measured on the warm side could have All temperatures were measured with an electronic been as much as 1
F
lower than true air temperature self-balancing indicator capable of giving temperature at the lowest cold room temperature. The error in air difference with an accuracy of k 0 . 2F.
temperatures measured on the cold side was much less than this due to smaller temperature differences between
air and glass surface and forced convection at the junc-
TEST
tions. Errors in air space temperature measurements All 5-ft-high window configurations were tested at cold were due both to radiation exchange with adjacent glass room temperatures of +10
F,
-10F
and -30F
a n d surfaces and to inaccuracies in positioning of junctions. the 21/2-ft-high windows at +10F
a n d -30F.
T h e The error in positioning the junctions was about +1/32 .guarded hot box, which was positioned against the in. and the effect of this was more significant with the warm side of the insulated panel containing the window 1- and 2-in. air spaces in which horizontal temperature arrangement, was maintained at a constant tempera- gradients at the center were large. Measured tempera- ture of approximately 70F.
The box was sealed to the tures could have been as much a s 1.5F
too low at the panel surface with tape to prevent air leakage.TO
-*u
---,
LC\'1
4 " C-C1t
Pattern for 2; A High Window is SimilarI
T
4 " 1"- 1 TI
I T - T o l / 1 1 1 - T o 1 I T - T o ) / l T i - T o )
F i g . 5 Temperature index values at vertical center line
minimize edge heat leakage the average warm room air temperature surrounding the guarded hot box edge, measured with thermocouples, was controlled to within 0.5
F
of the average temperature of the air in the box.For each test condition measurements were made of all air and surface temperatures and power input to the guarded hot box. All measurements were made at steady- state heat flow conditions. The duration of steady-state prior to any reading was approximately 10 hr for all tests. During this period the power input to the guarded hot box was recorded. At steady-state, variations in power input were less than 2 watts; an average taken over sev- eral hours, therefore, provided good accuracy.
Prior to the window tests the insulated panel con- taining the window opening was calibrated to obtain the heat flow through it as a function of air-to-air tem- perature difference. This was done by installing a 4-in.- thick uniform blank of rigid insulation in the opening and measuring the heat flow through the panel-blank
combination with the guarded hot box at the same cold room temperatures as used for the window tests. The thermal conductivity of representative samples of blank material had been determined in a guarded hot plate over a range of mean .temperatures. The average tem- perature difference across the blank was measured with 11 thermocouples on each surface, and the heat flow through the blank was calculated from this temperature difference and the known conductivity.
The heat flow through the insulated panel contain- ing the blank was then determined for each cold room temperature by subtracting the heat flow through the blank, from the heat flow through the panel-blank com- bination. In the tests on the window arrangements the heat flow through the window was determined by sub- tracting the heat flow through the insulated panel, cal- culated from the calibration data, from the .total heat in- put to the guarded hot box. Heat flow through the in- sulated panel was 1 4 to 16% of the total heat flow through
the panel-window combination.
The warm surface temperatures on the insulated panel during all window tests were observed to be the same as during the calibration tests except within 3 in. of the window opening. Surface temperatures on the panel adjacent to the opening were measured at top, bottom, and one side and were found to be lower than over the remainder of the panel. These lower tempera- tures were due primarily to lateral heat flow from the panel across the boundary of the opening. During the calibration tests this lateral flow of heat was into the blank and around it to the cold room. With the narrow air space window arrangements the lateral heat flow largely bypassed the window; with the widest air spaces there was heat flow from the panel to the air space near the warm pane and from the air space to the panel near the cold pane; at intermediate air space thicknesses the lateral heat flow introduced a net heat gain to the air space.
Because of these differences in lateral heat flow the heat flow into the panel adjacent to the window opening was greater during the window tests than during the calibration tests. This heat flow was calculated from the temperature measurements and the average surface conductance. The average surface conductance was about 1.5 for the panel and about 1.35 Btu per ( h r ) (sk f t j (deg F ) for the windows. A mean value was assumed for the vicinity of the opening. The dif- ferences in heat flow into the panel adjacent to the opening amounted to 6 % of the heat flow through the 5-ft window with 6-in. air space, increasing to 7% for the %-in. air space. For the 2%-ft-high window the differences varied from 8 to 10% of the window heat flow.
The exten.t to which the lateral heat flow influenced the heat transfer through the window is indeterminate. In calculating the window heat flow as outlined above, the heat flow through the insulated panel, based on the calibration tests, was increased by an amount equal to one-half the calculated additional lateral heat flow during the window tests. This procedure limits the error in window heat flow due to lateral heat flow to about +-3 to 33$% for the 5-ft window and +-4 to 5% for the 2%-ft window.
The total error in the measurement of heat flow through the window arrangement depends upon the error in measuring heat flow through both the panel- blank and panel-window combinations as well as the error in determining heat flow through the blank. The total error is also dependent on whether the errors are systematic or random. Errors in heat flow measurement using the guarded hot box are due mainly to heat leak- age at the edge of the test area. When warm room air temperature around the edge of the box is approximately equal to box air temperature (within
1/2
F ) it has been shown .that edge heat leakage provides a systematic error of approximately 3 Cj6.3Since the box was operated a,t similar conditions for both window and calibration tests the svstematic errors due to edge heat leakage are subtractive. Random heat flow measurement errors in the guarded hot box were approximately 1 to
Ilk%.
It is estimated that the error in the determination of heat flow through the blank was approximately 376, although this error is not important since the heat flow through the blank wassmall compared to that through the window. Based on these considerations it is estimated that the error in the determination of heat flow through the window arrange- ment, exclusive of errors due to lateral heat flow in the insulated panel, were less than 21/z% for the 5-ft window and 4 x 7 6 for the 2y2-ft-high window.
TEMPERATURE RESULTS
The results of the vertical center line temperature meas- urements for the various basic window configurations are shown in Fig. 5. They are plotted non-dimensionally as the ratio of the difference in temperature between the surface or air mace and the cold room to the overall air-.to-air temperature difference. Height is given as the ratio of the distance from the bottom of the window to the total height of the window.
The results given for any one configuration are he average of the results obtained at the three cold room temperatures; the temperature index values at -10
F
are very close to the average values; those at -30F
and +10F
differ from the average by less than 1%.All of the inside surface temperature gradients
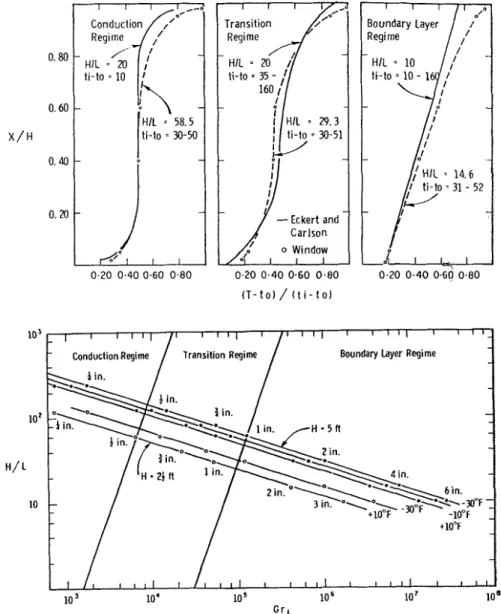
exhibit an S-shaped profile and reflect to some degree the temperature gradients in the air space. The vari- ations in both surface and air space temperatures from top to bottom are greatest for the larger air space thicknesses. It will be noted that the shape of the vertical air space temperature profiles varies with air space thick- ness. Eckert and Carlson have shown: for air spaces bounded by isothermal surfaces, that the shape of these profiles depends upon the non-radiative heat flow regime that exists in the air space.
These regimes, i n turn, depend on the value of the Grashof number, Grr.,, and on the height-to-thickness ratio, H/L. In the "conduction regime," obtained when G,r, is small and I-I/L is large, heat is transferred mainly by conduction and the temperature drop from the hot to the cold surface is linear over the central part of the space; convective effects occur at upper and lower edges of the layer only. When G,I, is large and H/L small, the heat is transported mainly by convection and the temperature gradient is concentrated in thermal boundarv lavers on both vertical surfaces. The tem- , , perature of the core is essentially constant along hori- zontal lines and conduction heat transfer is therefore very small. Conditions under which such a tempera- turk field exists are referred to as the "boundary layer regime." For intermediate Gr1, and H/L values the boundary layers appear to come together and the hori- zontal temperature profiles are curved over the width of the space at all levels; the heat transport is by both conduction and convection and the condition is called the "transition regime."
AIR SPACE TEMPERATURES
Typical vertical air space temperature profiles obtained
mimes
by Eckert and Carlson for the different heat flow re,' with isothermal bounding surfaces are given in Fig. 6. Some comparable window air space temperature gradi- ents obtained in this study are also shown. They are plotted non-dimensionally as the ratio of the difference in temperature between air and cold surface to the sur- face-to surface temperature difference across the space.
Fig. 6 Tbmperature pro- files at vertical center line of air space 0.20 0.40 0.60 0.80 ( T - t o ) / ( t i - t o ) Fig. 7 tive to Eckert Test resu,lts /low regimes, and Carlson rela- a f t e r
Boundary Layer Regime
-
-
--
- 10' 10 10 10' 10' G ~ LThese center line temueratures are essentiallv con- stant in the conduction regime for some distance above and below mid-height with temperature variations at the upper and lower boundaries only; the upper tempera- tures move toward the warm surface and the lower tem- peratures toward the cold surface temperature. These regions of varying temperature increase in size with increasing GrL until they meet at mid-height in the transition regime. In the boundary layer regime the vertical temperature profile is practically linear. The limits of the various regimes in terms of GrL and
H/L
as determined by Eckert and Carlson are given in Fig. 7, together with the results of the window air space tem- perature measurements.According to the limits given by Eckert and Carl- son, the results for the lh-in. air space fall within the conduction regime, those for the -
y2-,
y4-,
and 1-in. spaces fall generally within the transition regime, and those for the 2-, 3-, 4.) and 6-in. spaces are within the boundary layer regime. The actual shape of the centerline pro- files for the 1-in. air space suggests that it is closer to the conduction regime than is indicated by Fig. 7 when 5 ft high (Fig. 5 c ) , but is definitely in the transition regime when 21/2 ft high (Fig. 5 d ) . The 2-in. airspace, 5 ft high, which is geometrically similar to the 1-in. air space, 21,$ ft high, is also in the transition regime according to the temperature profiles. The shape of the profiles obtained for the 2-in.-thick by 2%-ft- high and the 4-in.-thick by 5-ft-high-air spaces (Fig. 5e) on the other hand indicate that they are within the boundary layer r e ~ i m e . The 3-in.- and 6-in.-thick air spaces (Fig. 5 f ) are also within the boundary layer regime. 1.t would seem that the transition regime in window air spaces extends to greater air space widths than in air spaces bounded by isothermal surfaces.
SURFACE TEMPERATURES
It has been pointed out that the inside surface vertical temperature profiles generally reflect the air space tem- perature pattern and result in inside surface temperatures being lower at the bottom than at the top. This applies even to the narrow air spaces with heat transfer in the conduction regime where convection effects, nevertheless, occur at the top and bottom. In this connection Eckert and Carlson point out that at the bottom edge of the warm surface the local heat transfer coefficient in the air space is significantly higher than in the central region and is lower at the corresponding top edge. The
4
5
0.4 0.6 0.8 1.0 1.2
h , , B T U I ( H R I ( S Q F T ) ( " F )
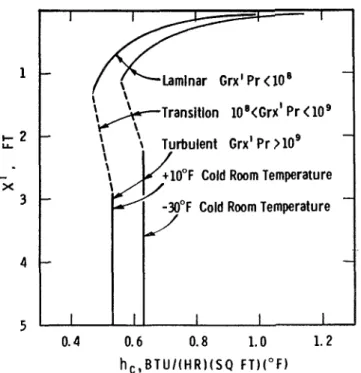
Fig. 8 Convection heat transfer coefficient over i n -
side surface of %-in. x 5-ft window
situation is reversed at the top and bottom edges of the cold surface. This further explains the inside sur- face temperature gradients in the vicinity of upper and lower edges of the window, as well as at the outside surface. It can be calculated4 that the height of the convection region from the bottom of the window is less than 1 in. for the Y4-in. air space, but increases significantly with increasing air space thickness. This is evident in the difference between the surface tempera- ture gradients at the bottom of the
?,&-
and +$-in. air spaces.In the case of the thicker air spaces, with heat transfer in the transition and boundary layer regime, the thickness of the laminar flow boundary layer in the air space adjacent to the warm surface increases with distance from the lower edge; similarly for the cold surface it increases with distance from the upper edge. The result is higher than average heat transfer coeffi- cients at the bottom adjacent to the warm surface, which are reflected in the large warm surface temperature gradients near the bottom for the wider spaces. At the very bottom, however, the gradient decreases. It is assumed that this is due to radiation exchange between the glass near the bottom and the adjacent insulated boundary which is relatively warm. With the narrow air spaces, the angle of view between the glass and the insulation is smaller and radiation exchange reduced.
Since this effect is not evident in the surface tem- peratures at the bottom edge of the narrow air spaces it is assumed that conduction into the glass from the insulation is not significant. It will be noted that the inside surface temperature for the narrow air spaces is fairly constant over a small central region consistent with the air space temperature profile for the conduction regime (Fig. 6 ) . With the 5-ft height, however, the temperature increases slightly from the center down- wards until the lower edge is approached. This rise
Transltlon 1 0 ' < ~ r x ' Pr
<
10' +lO°F Cold Room Temperaturecan be explained by consideration of the convection con- ditions on the warm side.
-
I
Natural convection air flow occurs in a vertical downward direction over the inside window surface. Natural convection can be described in terms of N,:, G,,', and
P,,
whereX'
is the vertical distance from the top of the pane. The variation in theP,
number is small over the range of air temperatures and can be assumed constant, equal to 0.71. When G,/.
P,
is less than aboutlos
the flow is laminar and the convection heat transfer rate is described by the following equation, taken from Reference ( 5 ) :When G,,'
.
P,
is greater than about 1 0 V h e flow becomes turbulent and in this range the heat transfer coefficient is described by the following equation, taken from Reference ( 5 ) : I K Nu,' = 0.1 ( P ,.
Grr')'13 or h = - 0.1 ( P ..
GrI')'13 X' ( 2 )-
I I IValues of the convective component of the surface conductance for the inside surface of the 5-ft window with 1/4-in. air space, calculated from Eq ( 1 ) and ( 2 ) for cold room temperatures of 10
F
and -30 F, are shown in Fig. 8. This indicates very high values near the top edge, rapidly decreasing in the downward direc- tion with transition from laminar to turbulent flow between 1 to 3 ft from the top, and a constant value when turbulent flow is established.The rise in heat transfer coefficient with turbulent flow causes the rise in surface temperature from the center downwards with the narrow air spaces of 5-ft height. This rise is most pronounced with the 1/4-in. air space where it can be assumed that there is little vertical temperature gradient in the air space, except adjacent to upper and lower boundaries, but is evident with air spaces up to 2 in. in width.
At greater air space widths, the effect of the tran- sition from laminar to turbulent flow in the boundary layer at the inside surface is masked by the influence of the large air space temperature gradients. No rise in inside surface temperature occurs toward the bottoms of the narrow air spaces of 21/2-ft height since laminar flow occurs over most or all of the height of the window. The large temperature gradients of warm surfaces at the top edge with all air space thicknesses would appear to be due in part to the high convective heat transfer coefficient at this edge, which rapidly decreases in the downward direction.
On the cold side, forced convection flow was pro- vided in a downward direction over the window surface at a velocity of approximately 5 mph. Outside surface conductances were about 3.5 for the 5-ft window and about 3.2 Btu per ( h r ) (sq ft) ( F ) for the 21h-ft window. It is almost certain that flow over the window was turbulent because of the turbulence of the free stream approaching the window due to the fan and impingement against the test partition. This would indi- cate a high value for the convection heat transfer coeffi- cient at the top edge of the cold surface, decreasing in a downward direction, and would tend to cause a
temperature rise in a downward direction on this surface. This is evident in the case of the narrow 5-ft-high air spaces except at the upper edge, where a local in- crease in surface temperature occurs due to recessing of the cold pane in the insulated opening. With the 6-in. air space, 5 f t high, where there is no recessing of the cold pane, the cold surface temperatures increase in a downward direction at the very top, as would be predicted. Over the remaining height of the window, however, the temperatures decrease toward the bottom due to the temperature gradients in the air space and on the warm surface. This also applies to the other wider air spaces.
MINIMUM SURFACE T E M P E R A T U R E S
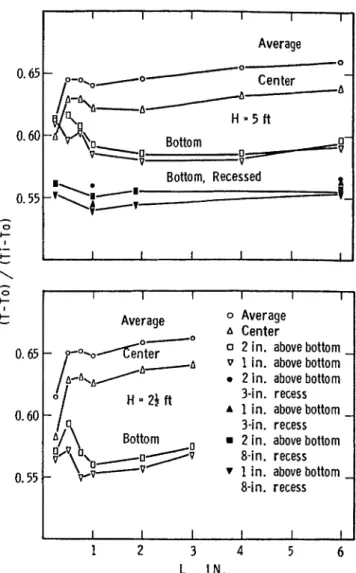
The value of double windows in permitting higher in- side relative humidities is cletermined by the minimum inside surface temperatures. For the basic window ar- rangements in this study temperatures on the vertical centerline were always lower than those measured at corresponding levels at other locations shown in Fig. 4. In Fig. 9, vertical center line surface temperatures near the bottom of the valious window configurations are compared with those at the center and with the weighted averages calculated from all surface temperatures. In- cluded are the inside surface temperatures measured near the bottom of the 5-ft-high windows with the simulated recessing of 3 in. and 8 in.
It will be noted that the lowest temperatures occur at the bottom of the window in all but the Ih-in. air space with the 5-ft height. The difference between tem- peratures 2 in. and 1 in. from the bottom is small. Furthermore, the effect of air space thickness on the value of the minimum surface temperature is not great; with the simulated recessing the differences become insignificant. Lower minimum surface temperatures occur on the 2y'-ft wiiidows than on the 5-ft ones, even though center and average temperatures are generally as high, or higher. Minimum inside surface tempera- tures are lower with the simulated recessing due to interference with convection conditions. The center temperature is lower than the average by about 2% of the overall temperature difference.
The surface temperature parameter used in Fig. 9 and in preceding figures is a convenient one for com- parison of window condensation performance and has been referred to as a "condensation i n d e ~ . " ~ It must have a value between 0 and 1. The values of this tem- perature index for the basic windows of this study pro- vide a useful yardstick for rating the performance of proprietary windows. The surface temperatures of a number of such windows have been measured under conditions similar to those in the present investigation. Several of these were horizontal sliding double windows, 2y2 to 3-ft high and with air space thicknesses from 2 to 4y2 in., having aluminum frames incorporatirig optimum thermal insulating breaks. These specimens had minimum inside surface temperatures corresponding to a temperature index of 0.55 to 0.57, which is in close agreement with values in Fig. 9 for the 21I2-ft window.
Providing optimum surface temperatures becomes more difficult with narrow air spaces due in part to the relatively high conductance of sash or spacer materials.
I I I I I I Average 0.65 Center H - 5 f t 0.60 Bottom Bottom, Recessed I I-
-
Average H - 2 J f t Bottom 0 Average A Center0 2 in. above bottom
v 1 in. above bottom
2 in. above bottom 3-in. recess
A 1 in. above bottom
3-in. recess 2 in. above bottom 8-in. recess
r 1 in. above bottom
8-in. recess
1
I I I I I II
1 2 3 4 5 6
L, I N .
Fig. 9 T e n ~ p e r a t ~ ~ r e i n d e x values for inside surface
The minimum temperature index of one specimen with y'-in. air space and all vinyl sash was 0.50, while that for another with $"-in. sealed double glazing enclosed in vinyl sash was 0.47. Published values7 of surface temperatures for a number of proprietary sealed double glazing units. about 20 in. high, in wood frames gave a minimum value of the temperature index of 0.33 and lower, at the junction of glass and frame; in this case there was a rechss of
lyL
to 2 in. at the point of tem- perature measurement. The surface temperature gradi- ents were very large near the bottom and top so that 1 in. above the lower frame member the temperature index was about 0.53.The temperature index of all windows can be im- proved by forced convection over inside surfaces but this of course increases overall heat transmission. LOW surface temperatures are difficult to overcome adjacent
Table I. Relative Humidity for Condensation
vs. Temperature lndex TI = 70 F, To
=
0 F Index RH, % 0.65 41 0.60 36 0.55 31.5 0.40 27 0.45 24Fig. 10 Tlz.ermal conductance of 5-ft-higlz air space
I I I I I
1 2 3 4
L. I N .
0.W
to a recess because of the interference with convection
I 2 1 4 5 6
L . IN.
heat transfer.
Values of the surface temperature index for the center of the various proprietary windows already re- ferred to correspond closely to the values shown in Fig. 9 for the basic window; in some instances the values were slightly higher due to increased heat flow through the frames into the air space. It is common practice to base the allowable building humidity on window sur- face temperatures calculated from average thermal con- ductance or
U
values. These calculated average surface temperatures correspond to a temperature index of about 0.65 which is close to the temperature index based on average surface temperatures in Fig. 9, compared witha minimum value of 0.55 for a well designed double window. Table I gives values of the humidity at which
-
condensation occurs for various values of the tempera- ture index, with inside air at 70F
and outside air 0F.
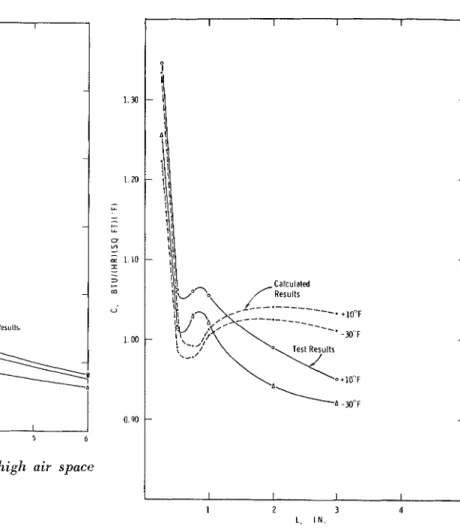
It will be noted that the relative humiditv that can be carried is significantly overestimated when based on average surface temperature.Fig. 1 1 Thermal conductance of 25;-ft-high air space
The variation of conductance with thickness for the basic window follows the same general pattern a s the calculated values. Agreement in absolute values f o r the narrower air space widths is well within the limits of error; the large discrepancy for the %-in. space is probably due to a greater uncertainty in average a i r space thickness. The decrease in conductance with thickness at air space thicknesses greater than 1 in. is larger for the basic window. The significance of this is not known.
Air space conductance calculated from a relation- ship in Reference (4) for the boundary layer regime, using the average of measured surface temperatures f o r the basic window with the cold room at -30 F, are essentially constant with thickness at a value of 0.99 Rtu per ( h r ) (sq ft) ( F ) for the 5-foot height. The relation- ship in Reference (4) is based on measurements with essentiallv isothermal surfaces and it mav be that the
THERMAL CONDUCTANCES
slope in the values for the basic window is related t othe non-isothermal nature of the surfaces. Tests were Air space conductances obtained for the 5-ft and 211'2-ft carried out on 5-ft
window with 6-in. air space with window configurations are given in Figs. 10 and 11. forced convection in the guarded hot box in order to These are compared with values calculated from pub- provide more uniform warm-pane temperatures. This lished data.l The conductance values for this present resulted in an increase in air space conductance of study were calculated from the window heat flow values about
7ro.
and from average values of the measured surface tem- peratures. In determining the average surface tempera-
tures the measured temperatures were weighted for area
-
CoNCLUS1oN
on the basis of plotted isotherm patterns. The conductances Under winter conditions, with natural convection on the were adjusted to account for the thermal resistance of warm side, basic double windows exhibit a significant
with lowest temperatures at the bottom. The shape of
the surface temperature gradient depends primarily on the air space temperature distribution and on the surface heat transfer conditions. The air space temperature con- ditions depend upon the type of heat flow regime, which is a function of the height-to-thickness ratio and the Grashof number based on thickness. The inside surface heat transfer coefficient for natural convection is de- pendent on the distance from the top edge of the window. Surface temperatures calculated from heat trans- mission coefficients in the ASHRAE Guide And Data Book2 are in close agreement with average surface tem- peratures obtained for the basic window in this study. The calculated values also approximate closely the sur- face temperatures at the center of the basic window and many proprietary windows. The relative humidities that can be tolerated, which depend on minimum sur- face temperatures, are significantly overestimated when based on calculated average values.
The ratio of the difference in temperature between the warm surface and outside air to the overall air-to-air temperature difference is a convenient index for describ- ing thermal characteristics of windows. It is essentially independent of overall temperature difference over a range of outside temperatures, provided that convection conditions are constant. The values of this index for the basic window of this study provide a useful yard- stick for rating the performance of practical window arrangements. For optimum performance the value of the index for sash, frame, and glass would be at least as high as the minimum values for the basic window of similar dimensions.
Practical window arrangements can be constructed for which the minimum values of the index are not less than those for the basic window. With metal windows this requires the incorporation of a substantial insulating separation in frames or sash. This becomes difficult with narrow air spaces due to space limitations. In practice there are a number of factors tending to lower the value of the index, for example, recessing of windows into the wall, stools, and blinds or drapes. Correspond- ingly, the introduction of heat and forced convection will tend to increase the temperature index at the expense of heat loss.
Air space conductances measured in this study show variations with thickness similar to those measured by other investigators. The conductances appear, how- ever, to decrease more rapidly with the wider thicknesses.
The work reported in this paper is part of a research program on the thermal performance of windows, in- tended to provide information for the improvement of design and for the development of standards. Results for vented window arrangements are being prepared for publication.
NOTATION
C
=
Thermal conductance, Btu per ( h r ) (sq ft)(F
temp diff)C,
=
Specific heat of air at constant pressure, Btu per (lb) ( F )8 = Local acceleration of gravity, ft per (sec) a
H
= Height of air space, fth,
=
Local convection heat transfer coefficient, Btu per ( h r ) (sq It) ( F temp diff)K = Thermal conductivity of air, Btu per (hr) (sq ft) ( F per ft of thickness)
L
= Thickness of air space, ft or in. T, t = Temperature of surface or air, FT i , average air temperature in guarded hot box To, average air temperature in cold room t i , average temperature of warm pane
t,,, average temperature of cold pane X = Distance from bottom edge of window, ft X' = distance from top edge of window, ft
Dimensionless Parameters
Gr1, = Grashof number based on
L,
,f3 8 P2L3
(ti - t,,)/p2, dimensionlessG,.,' = Grashof number based on
x',
P
8 p Xf3 ( T i - t i ) J$, dimensionlessN,,,' = Nusselt number based on X', h, X'/K, dimen- sionless
F,. Prandtl number, p C,/K, dimensionless
Greek Letters
,B = coefficient of thermal expansion of air,
(R
deg)-'
p = mass density of air, slugs per ( f t ) "p = dynamic viscosity of air, lb per ( h r ) ( f t )
REFERENCES
1. The Thermal Insulating Value of Air Spaces. Housing a n d Home Finance Agency, Housing Research Paper No. 32, April 1954.
2. ASHRAE Guide and Data Book, Fundamentals and Equip- ment, 1963.
3. A Unique Hot-Box Cold-Room Facility. W. P. Brown, K. R. Solvason and A. G. Wilson, ASHRAE Transactions, Vol. 67, 19G1, pp 561-577.
4. Natural Convection in an Air Layer Enclosed Between TWO Vertical Plates with Different Temperatures. E. R. G. Eckert and W. 0. Carlson, International Journal of H e a t Mass Transfer, Vol. 2, 1961 pp 106-120.
5. Heat and Mass Transfer. E. R. G. Eckert and R. M. Drake, Jr. McGraw-Hill, New York, 1959.
6. Unpublished Report to ASTM Committee E-6 by H. S. Wille. 7. Evaluation of Factory-Sealed Double Glazed Window Units. A. G. Wilson, K. R. Solvason and E. S. Nowak. ASTM Synl- posium on Testing Window Assemblies, Special Technical Publi- cation No. 251, 1959, pp 3-16.
R E P R I N T E D B Y P E R M I S S I O N O F T H E AlWERICAN S O C I E T Y O F H E A T I N G , R E F R I G E R A T I N G A N D A I R - C O N D I T I O N I N G E N G I N E E R S , I N C . A S H R A E D O E S NOT N E C E S S A R I L Y A G R E E W I T H T H E S T A T E M E N T S O R O P I N I O N S A D V A N C E D A T I T S MEETINGS O R P R I N T E D IN I T S P U B L I C A T I O N S .