HAL Id: hal-03120175
https://hal-cnrs.archives-ouvertes.fr/hal-03120175
Submitted on 1 Feb 2021HAL is a multi-disciplinary open access archive for the deposit and dissemination of sci-entific research documents, whether they are pub-lished or not. The documents may come from teaching and research institutions in France or abroad, or from public or private research centers.
L’archive ouverte pluridisciplinaire HAL, est destinée au dépôt et à la diffusion de documents scientifiques de niveau recherche, publiés ou non, émanant des établissements d’enseignement et de recherche français ou étrangers, des laboratoires publics ou privés.
Complex geometry macroporous SiC ceramics obtained
by 3D-printing, polymer impregnation and pyrolysis
(PIP) and chemical vapor deposition (CVD)
A. Baux, S. Jacques, A. Allemand, G.L. Vignoles, P. David, T. Piquero, M.-P.
Stempin, Georges Chollon
To cite this version:
A. Baux, S. Jacques, A. Allemand, G.L. Vignoles, P. David, et al.. Complex geometry macro-porous SiC ceramics obtained by 3D-printing, polymer impregnation and pyrolysis (PIP) and chemical vapor deposition (CVD). Journal of the European Ceramic Society, Elsevier, In press, �10.1016/j.jeurceramsoc.2021.01.008�. �hal-03120175�
Complex Geometry Macroporous SiC Ceramics obtained by 3D-printing, Polymer Impregnation and Pyrolysis (PIP) and Chemical Vapor Deposition (CVD)
A. Baux1*, S. Jacques1, A. Allemand1-2, G. L. Vignoles1, P. David2, T. Piquero2, M.-P. Stempin3, G. Chollon1
1 LCTS-CNRS, 3, allée de la Boétie, 33600 Pessac, France 2 CEA-DAM, Le Ripault, 37260 Monts, France
3 CANOE, 16 Avenue Pey Berland, 33600 Pessac, France
*Corresponding author. E-mail: anthony.baux@icmcb.cnrs.fr
Abstract: We present here an original route for the manufacturing of SiC ceramics based on 3D printing, polymer impregnation and pyrolysis and chemical vapor deposition (CVD). The green porous elastomer structures were first prepared by fused deposition modeling (FDM) 3D-printing with a composite polyvinyl alcohol/elastomer wire and soaking in water, then impregnated with an allylhydridopolycarbosilane preceramic polymer. After crosslinking and pyrolysis, the polymer-derived ceramics were reinforced by CVD of SiC using CH3SiCl3/H2 as precursor. The multiscale structure of the SiC porous specimens was examined by X-ray tomography and scanning electron microscopy analyses. Their oxidation resistance was also studied. The pure and dense CVD-SiC coating considerably improves the oxidation resistance. Keywords: Fused deposition modeling (FDM); Silicon carbide; Polymer-derived ceramics (PDC); Chemical vapor deposition (CVD); Oxidation resistance
1. Introduction
There is a growing demand for new or more efficient energy production technologies, in particular for alternative energy sources. Solar energy has the particularity to be both clean and unlimited. Among the technologies exploiting solar energy, concentrated solar power (CSP) with optical concentration is a particularly attractive process for producing electricity [1] [2]. In this technique, energy from solar radiation is accumulated in the solar receiver and then transferred to the cooling fluid (typically air). In CSP, the most common types of receivers are volumetric solar receivers (VSR), generally constituted of porous cellular ceramics, with good energy transfer properties [3]. In this type of receiver - and contrary to the tubular receiver - the volumetric effect is characterized by (i) a solid temperature that is higher at the exit of the receiver than at the entrance and (ii) a fluid temperature that reaches that of the solid at the exit
of the receiver [3] [4] [5]. An optimization of the pore volume geometry and material properties (mechanical strength/stiffness, thermal conductivity/expansion, oxidation and thermal shock resistance…) is necessary to obtain the volumetric effect and increase the efficiency of the receiver. Currently on the market, two major structures are well described: extruded structures (honeycombs by example) [6] [7] and isotropic reticulated foams [7] [8] [9] [10] [11]. For the second case, foams replication using a thermosetting resin followed by thermal treatment is a well-known technique [12]. For both categories, the control of the cell size is not easily adjustable; so, the geometry of the structure is limited. To overcome this, non-extrudable 3D periodic lattices are recently developed. These synthetic structures can be periodic or not [13]. Depending on their geometry, they can specifically demonstrate the volumetric effect on the solar receiver [14]. In this article we propose a processing route for a ceramic foam with complex shape as a first step in a roadmap which can eventually lead to a CSP application. The rapid growth of additive manufacturing in recent years has led us to consider this method as a practical solution. In 3D printing – or additive manufacturing – technique, a 3D computer-assisted design (CAD) model is generated. Then, using a compatible 3D-printer, a three-dimensional object is manufactured layer by layer. Some techniques like binder-jetting or robocasting are already used to print complex-shaped ceramic parts [15] [16] [17] [18] [19] [20]. Others technologies such as selective laser sintering, fused deposition modeling (FDM) and stereolithography allowed initially printing polymer materials [15]. For VSR application, the solid ceramic part constituting the porous structure has to resist (for long periods of time) to high temperatures in air (typically around 1000 °C, but up to 1200–1300 °C) [4] [6] [8]. It has also to support thermal shock and thermal gradients, i.e. to have a low coefficient of thermal expansion (CTE) and a high thermal conductivity. This excludes oxides and suggests silicon carbide (SiC), which is still considered as the reference material for the application. In recent works, Franchin et al. used FDM (with Polylactic acid - PLA) to develop a plastic structure which is then impregnated either by a preceramic slurry or resin to obtain the negative (porous structure) of the 3D printed structure after thermal treatments. This technique allows obtaining a dense ceramic material whose porous architecture can be completely adjusted [21]. Mohanty
et al. used the same concept but with a different 3D-printing wire. In this case, polyvinyl alcohol
(PVA), which dissolves in water, is used [22]. The 3D PVA printed structure is then filled with a PDMS resin (polydimethylsiloxane). After crosslinking and polymerization of the resin, the structures are soaked in water, to eliminate the PVA phase. It can be noted that in both cases, what is 3D printed is not the final material but actually its porous network. The final material is developed around this sacrificial architecture. These are so-called reverse or replication
methods. The original aspect of our work is to develop a direct method to transform 3D printing plastic structure into ceramic structure. In the literature, some samples have been produced with another type of 3D-printing wire, PORO-LAY [23] [24]. It is composed of two materials: an elastomeric polymer and PVA. The latter is soluble in water, which allows obtaining upon immersion in water a controlled micro-porosity of the structures (the term “micro-porosity” in the whole article does not refer to the IUPAC nomenclature for carbon materials but simply to a porosity at the micrometer scale). You et al. used this PORO-LAY wire to create microbial fuel cell membranes [25]. The interest of the wire consists in its micro-porosity which gives to the printed batteries interesting performances. Belka et al. used FDM with PORO-LAY to print sorption agents for the extraction of small molecules [26]. Starosolski et al. have printed models of complex tissues or organs that are used as flexible models for surgery [27]. However, transforming a printed structure (made of plastic) into a dense ceramic structure is a challenge that we propose to take up thanks to the process developed for this work. The idea here is to transform structure with complex geometry. Among the numerous porous architectures that have been proposed for solar receivers, triply periodic minimal surfaces (TPMS) [28] [29] [30] [31] and especially gyroid structures have attracted special interest. They form porous structures whose configurable topology can be compared to an open cell foam [32]. TPMS structures have the particularity of displaying null Gaussian curvature everywhere [28]; they can develop a high surface-to-volume ratio, therefore increasing heat transfer between solid and gas phases. Some of them separate their porous space in two non-connected subsets, which can be exploited for heat transfer between distinct fluids, for instance [33]. Finally, they display very interesting mechanical properties such as high strength-to-weight ratio [34]. An approximation of the equation defining the geometry of these structures can be described by Eq. 1 [35]:
F
(x,y,z) = sin(
2𝜋𝑥 𝑎)
cos(
2𝜋𝑦 𝑎)
+ sin(
2𝜋𝑦 𝑎)
cos(
2𝜋𝑧 𝑎)
+ sin(
2𝜋𝑧 𝑎)
cos(
2𝜋𝑥 𝑎)
= t
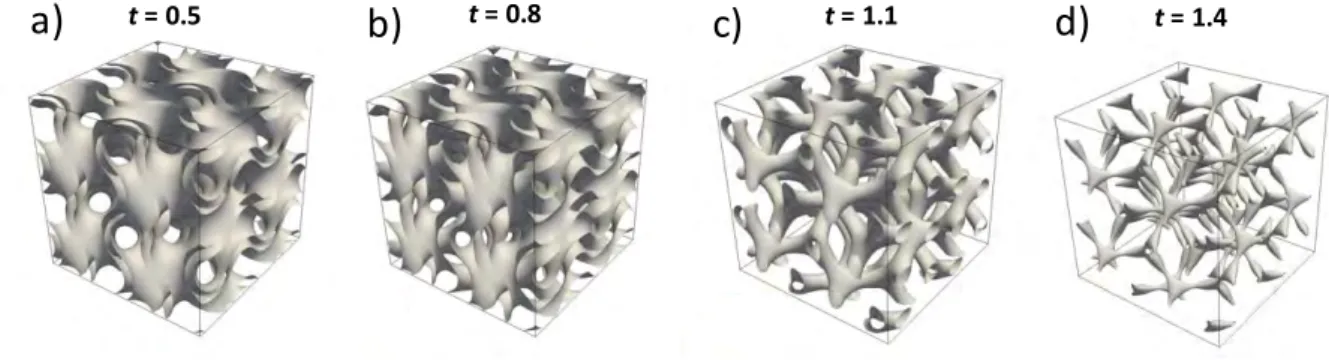
(1)where t is a constant whose value is in the range -1.5 < t < 1.5 and a is the periodicity of the structure. The properties of the 3D structure (porosity or specific surface) are a function of the value of t. The more the absolute value of t tends to 1.5, the more the macro-porosity increases
(Fig. 1). It is minimal for t = 0. In this case, the proportion of void and solid is identical and the
empty and solid volumes have the same geometry. For each node of the structure, the connectivity is three.
Fig. 1. Different gyroid structures depending on the value of parameter t. (a) t = 0.5, (b) t = 0.8, (c) t = 1.1, (d) t = 1.4
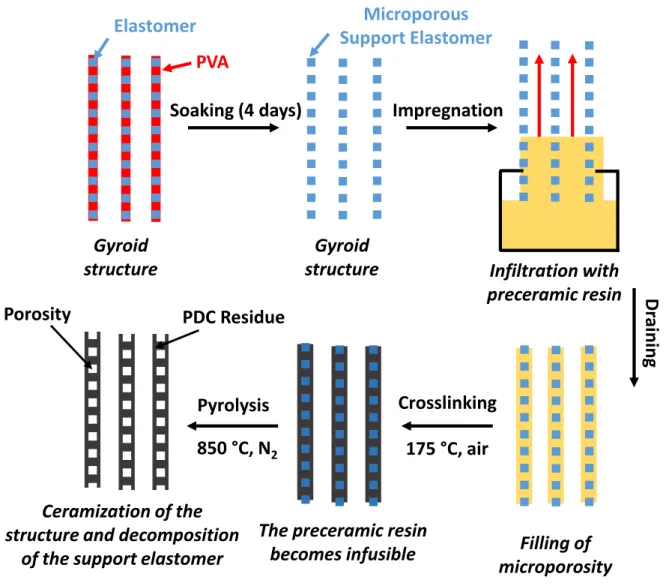
The first original aspect of this work is to use 3D printing to generate a complex macro-porous structure, with PORO-LAY wire. As mentioned above, the advantage of this wire is to generate micro-porosity within the walls of the structure after soaking in water. The aim is thus to cover or even impregnate the structure obtained with a pre-ceramic thermosetting resin. Two heat treatments (crosslinking and pyrolysis) of the impregnated structure will allow obtaining a PDC sample of the same geometry as the initial plastic structure. A schematic of the PIP (Polymer Impregnation and Pyrolysis) process is shown in Fig. 2. However, pyrolysis causes cracking
of PDC. The second original aspect of this work is the use of chemical vapor deposition (CVD) to fill in the residual micro-porosity and cover up the solid with pure and crystalline SiC coating. The CVD process has been studied and used for many years [36] [37] [38] and CVD-SiC is recognized as a high-performance material whose properties are very well documented [39]. It has been applied successfully to reinforce open-cell ceramic foams [40]. The sintering of additive manufactured SiC by CVD has been reported in previous reports. Terrani et al. combine binder jetting and chemical vapor infiltration in a process capable of yielding a high‐ purity, fully crystalline SiC ceramic [41]. This method is also explained in [42]. Koyanagi et al. gave a special focus on additive manufacturing to fabricate nuclear-grade silicon carbide (SiC) [43].
The first main objective of this work is to examine the feasibility of the process along the synthesis of a SiCPDC-SiCCVD based gyroid 3D lattice structures. The structure of the solid and the porous network will be analyzed in details by tomography and SEM at different steps of the process. The second objective is to evaluate on bulk model specimens the oxidation resistance of the constituting SiCPDC-SiCCVD -based material.
Fig. 2. PIP process for the ceramization of 3D printed gyroid structure and model cylinders. Gyroid structure Microporous Support Elastomer Infiltration with preceramic resin Impregnation Dr ai ni ng Filling of microporosity Pyrolysis Ceramization of the structure and decomposition
of the support elastomer
PDC Residue Porosity
Crosslinking
The preceramic resin becomes infusible 175 °C, air 850 °C, N2 Gyroid structure Elastomer Soaking (4 days) PVA
2. Experimental procedure
2.1. Sample processing
2.1.1. 3D printing and post treatments
In agreement with Eq. 1, 3D-printing were tested for gyroid structures with a value of t > 1. In
this case, the porosity is too high and the printed structures collapse. Conversely, for values of
t < 0.6, the volume of solid material is too high, which leads to a too low permeability.
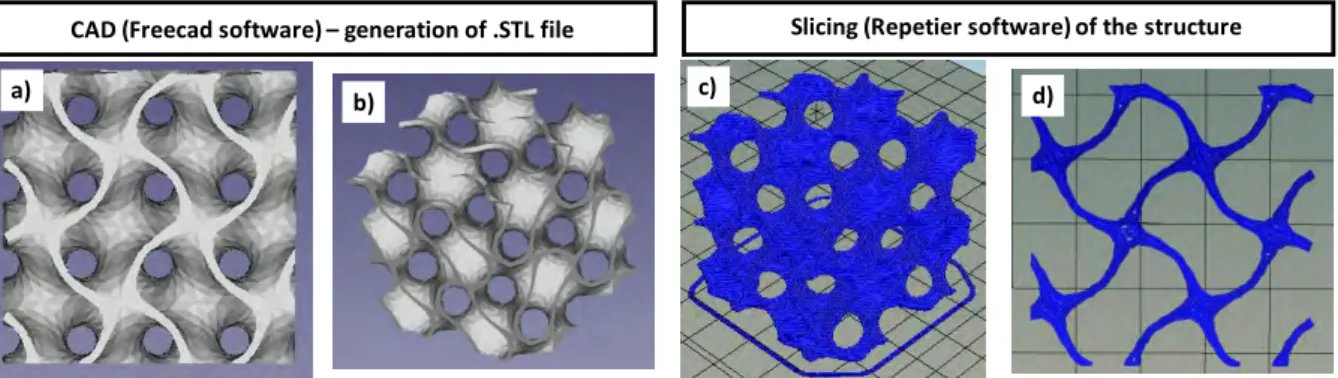
Therefore, in this work, gyroid structures were created with a value of t = 0.8. By assimilating gyroid to a cube, those of 25 mm side and 35 mm side have provided the most promising results after transformation by the process which will be described later. After obtaining an STL file
(Fig. 3a,b) using Computer-Aided Design (CAD) software [44], it was possible to generate a
G-code file (obtained after slicing the object with 3D-printing software [45]) compatible with the FDM 3D printer (Fig. 3c). An example of the first printed layer of a gyroid structure is
shown in Fig. 3d.
Fig. 3. (a) and (b) Computer-Aided Design for generation of a .STL file, (c) slicing of the object with 3D printing software, (d) example of the first printing layer of gyroid structure.
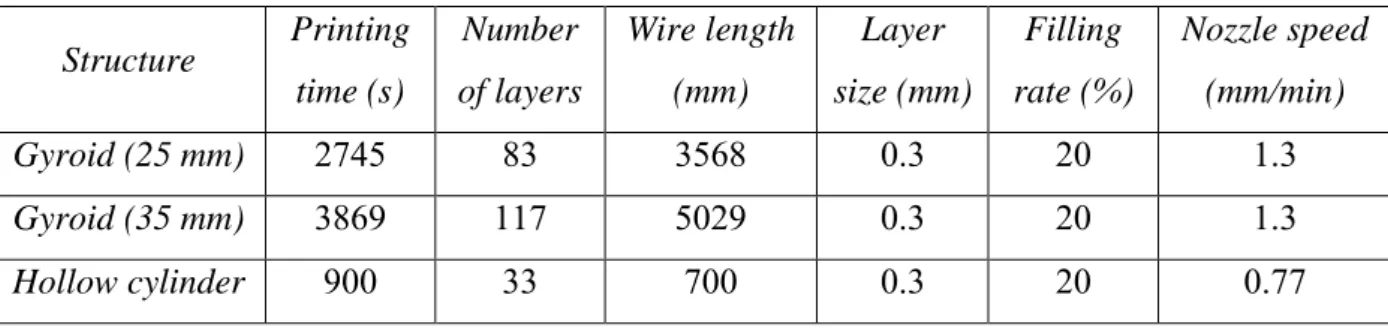
The gyroid structures were printed using a custom home-made printer. A 0.4 mm nozzle was used, with a heating plate of dimensions 20 cm 27 cm. The maximum height of the object is 26 cm. For this 3D printing technique, the first layer is crucial. A Kapton film was placed on the heating plate to increase the adhesion of the printed material. The parameters of the impression of a 25 mm and 35 mm gyroid (with t = 0.8) are described in table 1. This technique
was used to manufacture the gyroid structures, but also model specimens dedicated to specific tests: hollow cylinders. A commercial microporous wire (PORO-LAY LAY-FOMM 40 Porous Filament purchased from Matterhackers) was used for this work. The wire diameter is 1.75 mm and is made of two materials: a part made of an elastomer (no additional data can be found on this polymer), the other part being Poly-Vinyl Alcohol (PVA). The latter has the particularity
CAD (Freecad software) – generation of .STL file Slicing (Repetier software) of the structure
of being soluble in water, thus creating a micro-porosity as well as flexibility properties after soaking the wire in an aqueous medium (Fig. 4c).
Table 1. 3D printing parameters.
Structure Printing time (s) Number of layers Wire length (mm) Layer size (mm) Filling rate (%) Nozzle speed (mm/min) Gyroid (25 mm) 2745 83 3568 0.3 20 1.3 Gyroid (35 mm) 3869 117 5029 0.3 20 1.3 Hollow cylinder 900 33 700 0.3 20 0.77
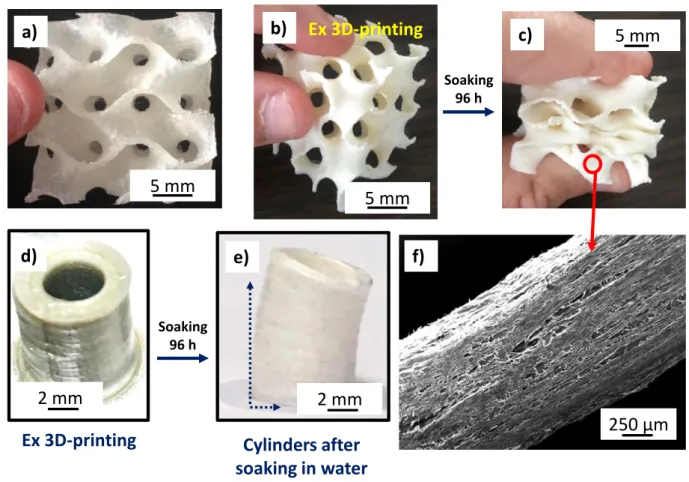
During the printing, the nozzle was heated to 165 °C to extrude PORO-LAY wire while the heating plate is maintained at a temperature of 60 °C. After printing (Fig. 4a,b), samples were
soaked in water for 4 days (renewing the water every 12 hours) to dissolve the PVA. A micro-porous structure is obtained, as shown with the SEM image in fig. 4f. The particular shapes and
sizes of the gyroid structures turn sometimes difficult the characterization of the solid material constituting the walls (structures are too large for oxidation tests). In this respect, model materials were printed (parameters presented in table 1) with a more basic hollow cylindrical
shape of a suitable size (10 mm outer diameter, 8 mm inner diameter, 10 mm height L0) (Fig. 4d).
Fig. 4. (a) and (b) gyroid structures in PORO-LAY in two different directions, (c) gyroid structures after soaking in water, (d) model cylinders after 3D printing, (e) model cylinders after 3D printing and soaking in water, (f) SEM observation of the microporous structure of PORO-LAY wire after soaking in water.
With this geometry, the walls thickness is comparable to that of gyroid structures. Yet, after soaking in water, the samples were elongated and some warping of the cylindrical shape occurred (Fig. 4e). These geometrical deformations are probably due to the dissolution of PVA
phase in the PORO-LAY structure. However, the microporous structure is similar to this of the gyroid structure shown in fig. 4f. These model samples were then submitted to the same process
as described in the next sections.
250 µm a) b) c) f) Soaking 96 h Cylinders after soaking in water e) 5 mm 5 mm 5 mm 2 mm d) Ex 3D-printing Ex 3D-printing Soaking 96 h 2 mm
2.1.2. Gyroid structures impregnation
Ex-3D printing gyroid structures and model cylinders were impregnated at room temperature (RT) with a polymeric liquid SiC precursor, allylhydridopolycarbosilane (AHPCS, tradename: SMP-10, from Starfire Systems, Inc, USA). This polymer precursor was chosen because of its high ceramic yield of at least 70 wt % [46] [47]. The resin is liquid at room temperature and has a density of approximately 1 g/L. The viscosity of the resin at RT, 82 mPa.s, is relatively low, facilitating the samples impregnation. The impregnation method is relatively simple to implement. The wet samples (it is not possible to work on dry structures because after drying the microporosity is no longer accessible) were held by a steel wire, threaded through the macro-pores of the structure. The pure resin was placed in a beaker. The structures were dipped in the resin for 1 min in open air, and then the excess resin was removed by simple draining (excess resin falls by gravity) for approximately 1 h. The quantity of impregnated resin was determined by weighing the samples before impregnation and after draining. The resin perfectly covers all the walls of the gyroid structures.
2.1.3. Thermal treatments
The various heat treatments have three roles: (i) to crosslink the resin, (ii) to eliminate the supporting polymer (PORO-LAY) and (iii) to convert the impregnated AHPCS resin into ceramic. The crosslinking of the resin is carried out under air atmosphere in an oven. To minimize deformations, the gyroid structures and model samples were placed on an aluminum plate (avoiding hanging them on a wire for example). To ensure total crosslinking, a temperature of 175 °C was applied. A slow rise in temperature (0.4 °C/min) was applied between 80 °C and 175 °C; the temperature was then maintained for 3 h. The crosslinked specimens were subsequently pyrolyzed to be converted into ceramics. The samples were placed on a flexible graphite tray (from Cerhec, France ®) that was introduced in the center of the silica tube (Ø = 50 mm) of a resistor-heated furnace. The pyrolysis was performed under flowing nitrogen (99.999% from Air Liquide) at ambient pressure. As will be discussed in the next section, the temperature profile was adapted to this particular pyrolysis behavior. The samples were first heated up to 150 °C with a 5 °C/min ramp rate. The heating rate was then decreased to 1 °C/min up to 600 °C. The final heating ramp rate was then readjusted to 5 °C/min up to 850 °C (maximal temperature on the resistor-heated furnace), before cooling down to
room temperature at 5 °C/min. The resulting “SiCPDC” samples were used for tomographic observations and were submitted to gas phase reaction as described in the following section.
2.1.4. CVD
This processing step is largely inspired by [42]. The CVD reactor consisted of a sintered silicon carbide tube, with an inner diameter of 63.5 mm. The SiC tube was installed inside a high temperature electrical resistive furnace (Carbolite® STF1500) having a 600 mm long hot zone. A SiC coating was deposited by CVD on the SiCPDC specimens at high temperature (T) and pressure (P) (see table 2). The conditions were adapted for SiC deposition at a high growth rate (14 µm/h). These conditions were selected (i) to promote infiltration into micro-pores revealed by PVA dissolution in the walls of the structures, and (ii) to reinforce the SiCPDC structures with a thick SiC layer. The SiC deposit was produced from a mixture of methyltrichlorosilane (MTS) and hydrogen. The gas flow rates QMTS and QH2 were controlled by mass flowmeters (SLA5850 from Brooks) with a H2/MTS molar ratio of three. MTS was evaporated from a stainless-steel vessel and diluted in H2 (AlphagazTM 2 from Air Liquide), the whole system being placed in an oven heated at 35°C. A rotary vane vacuum pump was connected to evacuate gases at the outlet of the reactor. Liquid nitrogen traps were installed upstream from the pump to condense corrosive by-products such as HCl. A schematic of the CVD device is available in [48]. A flexible graphite foil (Papyex® from Mersen) was placed against the inner side of the reactor wall to protect the SiC tube. The SiCPDC samples were hung with a graphite frame and a thin molybdenum wire threaded through the open cells. All the specimens with their holders were placed in the center of the hot zone, where a homogeneous deposition rate has been observed. Table 2. Experimental conditions for CVD
T (°C) Ptotal (mbar) QMTS (sccm*) QH2 (sccm*) t (h)
CVD 1200 100 200 600 6
*sccm : Standard Cubic Centimeters per Minute
2.2. Characterizations
Scanning Electron Microscopy (SEM, FEI Quanta 400 FEG) was used in the secondary electron (SE) mode to observe the surface morphology of the specimens after soaking in water and after CVD step. Model cylinders were also embedded in epoxy resin, polished and examined by optical microscopy at various magnifications (LEICA Wild VM3Z and Reichert-Jung MF3), after the oxidation tests. The 3D architecture of the gyroid structures were analyzed
by X-ray tomography (GE v|tome|x s research edition) at the different steps of the process. It is important to mention that it is not exactly the same structure that was analyzed at the different steps of the process. The analyses were performed using a directional X-ray source (200 kV, 300 μA), an exposure time of 500 ms and a set of 2200 radiographs over 360°. For each structure, a scan at low resolution (15 µm voxel edge size) was recorded in order to capture the total volume of the samples. The pore volume fraction in the samples Ptomo was determined from the void to solid surface ratio after binarizing the cross-sectional images. The SiC-CVD phase crystallinity was evaluated by Raman microspectroscopy (RMS, Labram HR, from Horiba-Jobin Yvon, λ = 632.8 nm, magnification ×100, acquisition time 2×5 s). Thermogravimetric analysis (TGA, Setaram TAG 24) under argon was used to determine the thermal behavior of the PORO-LAY 3D printing wire. The temperature-time program (for 20 mg of sample) consists of a slow (20 °C/min) heating ramp up to 850 °C , which was maintained during 10 min before cooling down to room temperature (20 °C/min). TGA was also used to analyse the behaviour of model SiC ceramics under oxidation at ambient pressure in dry air (99.999% from Air Liquide). Three different types of porous materials were submitted to the oxidation tests. The first one, referred to as “SiCPDC”, was obtained after the pyrolysis treatment of the impregnated 3D elastomer specimen. The second type, resulting from the CVD treatment on the PDC specimen, is called “SiCCVD”. The third one, referred to as “AHPCS”, was obtained after the cross-linking and the pyrolysis of AHPCS resin without PORO-LAY support polymer. Two types of temperature-time programs were applied. For SiCPDC and AHPCS samples, in a first step, a slow heating ramp (2 °C/min) was applied up to 1200 °C, then a 10 min dwell, before cooling down to room temperature at 20 °C/min. The second type of program, for the SiCCVD specimens, consists of a fast (20 °C/min) heating ramp up to 1200 °C, then a 20 h dwell, before cooling down to room temperature at 20 °C/min.
3. Results and discussion
3.1. Conversion from polymer structures to PDC structures
3.1.1. Thermal properties of PORO-LAY wire and AHPCS preceramic resin
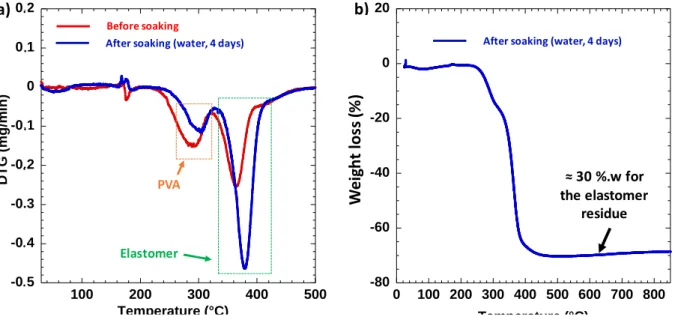
The first goal of the thermal treatment is to stabilize the AHPCS resin while avoiding deformation of the support gyroid structure. The crosslinking temperature of the resin must therefore be lower than the decomposition of the PORO-LAY elastomer. The thermal behavior (under argon) of the raw PORO-LAY was analyzed by TGA before and after soaking (Fig. 5).
TGA analyses show that after soaking in water, there remains a reduced amount of PVA within the structures. The weight loss around 380 °C is characteristic of the decomposition of the elastomer constituting mainly the structure after soaking in water. We note a residue of ≈ 30 %.w for a temperature of 850 °C. In regards to AHPCS resin, the literature data show that the crosslinking (in dry air) begins at 125 °C (crosslinking of the CH=CH2 bond) and the maximum hardening is observed for a temperature of 170.6 °C [47]. A catalyst can accelerate the initiation reactions of the polymerization of the resin and therefore reduce the crosslinking temperature. In the literature, a platinum (Pt, 2% wt.) / Divinyltetramethyldisiloxane complex in a xylene solution can be found [49]. Adding 0.1 % wt. of this catalyst would lower the crosslinking temperature of the AHPCS resin to 140 °C [49]. For our work, we did not use a catalyst, because the crosslinking temperature of the AHPCS (≈ 170 °C) is much lower than the decomposition temperature of the PORO-LAY elastomer (≈ 380 °C). This will minimize deformations during thermal treatments.
Fig. 5. Thermal behavior of PORO-LAY wire under argon. (a) DTG signal before (red curve) and after (blue curve) soaking in water, (b) TGA signal after soaking in water.
3.1.2. Crosslinking and pyrolysis of the impregnated structures
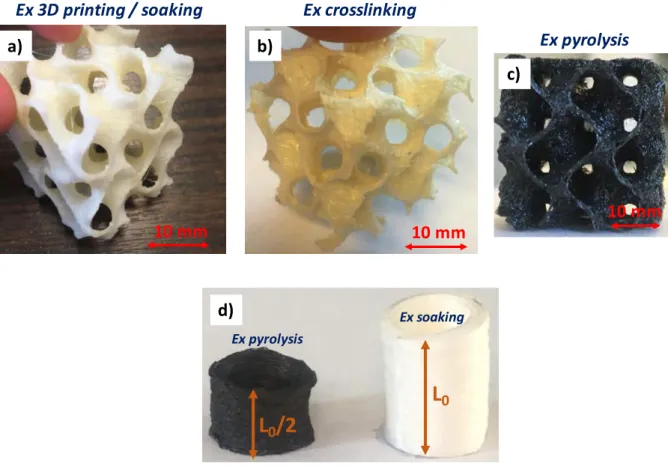
As explained in section 2.1.3, the crosslinking of the impregnated structure is performed at 175 °C for 3 h. This step causes a negligible volume shrinkage of the gyroid structures. Once out of the oven, the preceramic resin becomes infusible and the structure is completely rigid. For model cylinders, we note a contraction of the structure in the printing direction (the height of
-0,5 -0,4 -0,3 -0,2 -0,1 0 0,1 0,2 100 200 300 400 500 DTG (mg/ m in) Température (°C) After soaking (water, 4 days) Before soaking PVA Elastomer -80 -60 -40 -20 0 20 0 100 200 300 400 500 600 700 800 Per te m a ssiq u e (%) Température (°C) After soaking (water, 4 days)
a) b) ≈ 30 %.w for the elastomer residue . . . . . W eig h t lo ss (% ) . .
the cylinder is half the initial height L0 as shown in fig. 6d), which is not the case for gyroid
structures (fig. 6a). The 3D structure of the latter partially blocks deformations during heat
treatments. The axial shrinkage of the cylinders is probably linked to the fact that the structure of the elastomer collapses before the hardening of the resin. The pyrolysis step must be carefully controlled to preserve the macroscopic structure of the gyroid specimens obtained by 3D printing. A slow heating rate is necessary in particular to reduce as much as possible the weight and volume losses. The TGA curve of the PORO-LAY support polymer (Fig. 5) shows a high
weight loss around 380 °C, highlighting the decomposition of the polymer into gaseous species. That is why a particularly slow thermal ramp (1 °C/min as explained in section 2.1.3) is applied around this temperature.
After pyrolysis, the pre-ceramic resin (AHPCS) gives a PDC residue with a weight yield of about 77 % wt. In the literature, different polymerization / ceramization steps are identified during the pyrolysis [46]: (i) hydrosilylation reactions, (ii) dehydrocoupling reactions, (iii) conversion to ceramic at higher temperature. The major weight loss is observed between 300 and 650 °C and corresponds to the dehydrocoupling reactions. For temperatures above 850 °C, no significant weight loss is recorded [46]. Thus, based on literature, it can be concluded that the transformation of the polymer into ceramic is almost complete at 850 °C. At this temperature, the PDC mineral residue is amorphous.
After the pyrolysis, the volume shrinkage is almost isotropic: 30 % in the printing direction against 25 % in the other two directions. The difference is because the PVA dissolution generates micro-porosity between the layers. The heat treatment causes the structure to contract preferentially in the printing direction. Knowing the volume shrinkage, it should be corrected by modifying the dimensions of the initial .STL file (before 3D printing). Examples of gyroid structures after crosslinking (fig. 6b) and after pyrolysis (fig. 6c) are presented.
In order to characterize the PDC (ex-AHPCS) residue, the pyrolyzed structure is observed by
SEM (Fig. 7a). The residue strongly cracks during pyrolysis, this being due to the evaporation
of oligomers and gaseous by-products (mostly H2) during conversion to ceramic. This cracking allows obtaining an additional open micro-porosity, potentially infiltrable by CVD. After
pyrolysis, the objects can be handled but remain very brittle, whereas it was not the case after 3D printing. A CVD treatment will allow strengthening the structures.
Fig. 6. Gyroid structure after, (a) 3D printing and soaking in water, (b) crosslinking, (c) pyrolysis, (d) model cylinder after soaking and pyrolysis.
3.2. Infiltration of the PDC structures with CVD-SiC
The CVD step (parameters detailed in section 2.1.4) allows filling the microcracks on the surface of the pyrolyzed structure. Then, after 6 h of treatment, a dense, pure and polycrystalline β−SiC layer (≈ 100 µm thick) is coated on all the walls of the PDC structures, as viewed by SEM analysis in fig. 7b. The SiC layer seems to fill the micro cracks due to the pyrolysis of the
preceramic resin. Ex crosslinking Ex pyrolysis 10 mm 10 mm b) c) Ex 3D printing / soaking 10 mm a)
L
0L
0/2
d) Ex pyrolysis Ex soakingFig.7. SEM image (SE) of the (a) pyrolyzed structure, (b) ex-CVD structure.
After this gas treatment, the final structure is only formed of two SiC phases: PDC-SiC and CVD-SiC. Fig. 8a shows an example of the gyroid structure after the CVD step. These gas
treatments do not modify the macroscale geometry of the structure and no additional volume shrinkage or deformation is observed on gyroid structures or model cylinders after heat treatment at 1200 °C. Despite the shrinkage described in the last section, the geometry of the gyroid structures is maintained after pyrolysis and CVD treatment (Fig. 9). A workaround to
the volume shrinkage would be to modify by homothety the initial STL file to compensate (in the 3D printing process) this shrinkage.
250 µm 250 µm
Ex - pyrolysis
Ex - CVD
SiCPDC
SiCCVD
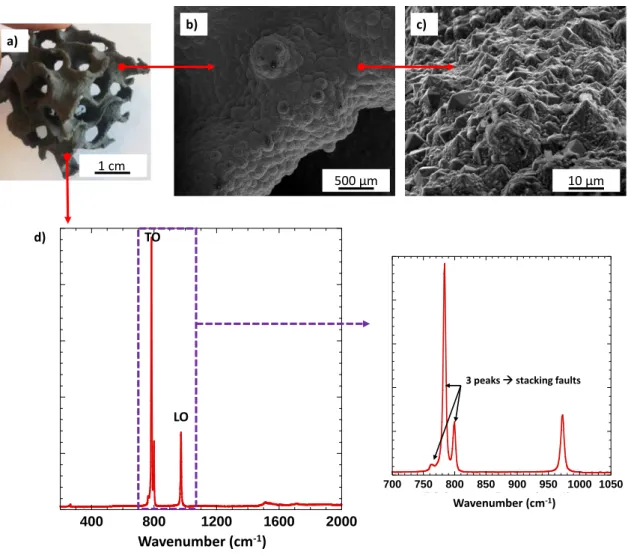
Fig. 8. (a) gyroid structure after CVD treatment, (b) and (c) SEM images of the high temperature CVD-SiC coating, (d) Raman spectrum of the high temperature CVD-SiC coating.
The Raman spectrum obtained from the CVD-coated surface of reinforced structures shows only fine and intense SiC peaks at 796 cm-1 and 970 cm-1 (Fig. 8d). These features correspond to a high purity carbon-free and silicon-free coating, consisting of highly crystalline 3C-SiC crystals with a low density of stacking faults. The microcracks generated by the pyrolysis of the AHPCS resin increase the specific surface on which CVD-SiC can be coated and facilitates the infiltration of the gases. The final structure is composed of 84 % wt. and 75 % wt. of CVD-SiCfor gyroid structures and model cylinders, respectively. The different model samples were subjected to oxidation tests.
400 800 1200 1600 2000 Déplacement Raman (cm -1) 700 750 800 850 900 950 1000 1050 Déplacement Raman (cm -1) LO TO
3 peaks stacking faults
500 µm 10 µm a) b) c) d) 1 cm Wavenumber (cm-1) Wavenumber (cm-1)
Fig. 9. (x,y) view of a tomography of ex 3D printing and ex CVD gyroid showing the volume shrinkage.
3.3. X-ray tomography analysis at each step of the process
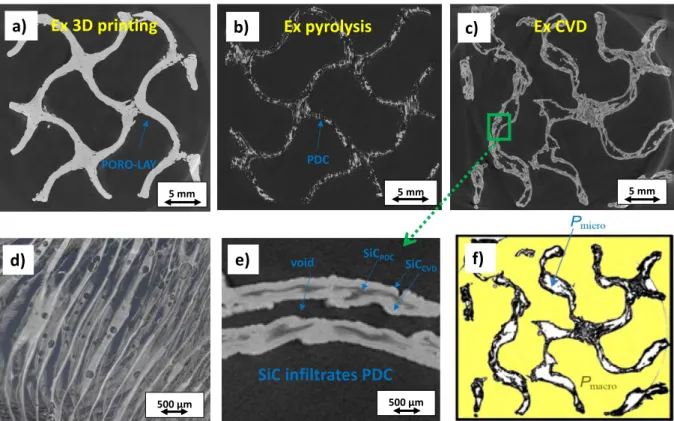
As can be seen on the cross section of the tomographic image presented in fig. 10a, the 3D
printed gyroid structure (before soaking in water) is very dense and there is no microporosity in the solid. The thickness of the walls is about 1 mm. It was not possible to obtain a tomographic scan of the structure after soaking in water because evaporation would have caused a shrinkage of the structure during the acquisition. During the impregnation, the micro-porosity of the structure obtained by PVA dissolution allowed a deeper penetration of the resin. During the pyrolysis, a redistribution of the AHPCS resin is observed by shrinking and multi-cracking (confirmed in fig. 10d) into small fragments. The pyrolyzed AHPCS residues penetrate into the
walls of the gyroid structure, thus filling part of the space left by the decomposition of the PORO-LAY (Fig. 10b). A remarkable improvement is observed after CVD. We note that
CVD-SiC infiltrates the structure composed by PDC-CVD-SiC. The cracks obtained after AHPCS pyrolysis generate a pore structure that is favorable to gas infiltration. The SiC coating is both on the external surface and the internal surface of the PDC skeleton (Fig. 10f). The empty space left
by the decomposition of the elastomer during pyrolysis could therefore be filled by CVD-SiC. Yet, after 6 h of treatment, the entire void is not completely filled. Continuing CVD for additional time or modifying the CVD parameters to increase the growth rate would surely allow a better filling of the pore space. The microscopic porosity (Pmicro) of the walls of the structures can be calculated from the void to solid (SiCPDC + SiCCVD) surface ratio after binarizing all the 2,200 cross-section images. Fig. 10e. is an example of a binarized slice. The
z Printing direction Ex 3D printing Ex CVD 35 cm 26 cm x y 26 cm 35 cm -25% Vol. X and Y directions
macroscopic porosity Pmacro of the gyroid structure generated by 3D-printing is not considered here. The calculated Pmicro is 21 % ± 3 %. As explained previously, this value is adjustable according to the CVD deposit time.
Fig. 10. Tomographic scans of a gyroid (a) ex 3D-printing (slice), (b) ex pyrolysis (slice), (c) ex CVD (slice), (d) part of the entire volume of the pyrolyzed structure, (e) zoom of (c) showing the infiltration of the PDC structure. (f) image of (c) after thresholding and binarization (macropores are in yellow, micropores are in white)
3.4. Oxidation behavior of the SiCPDC and SiCCVD model ceramics samples
Oxidation tests were carried out under reconstituted air on the model cylinders before (SiCPDC) and after (SiCCVD) CVD step and on the pyrolyzed AHPCS resin without PORO-LAY support polymer. The thermal treatments are described in section. 2.2. The relative weight variation m/m0 is plotted either as a function of temperature for SiCPDC and AHPCS or as a function of time for SiCCVD specimen. For SiCPDC, the first weight loss (between 150 °C and 250 °C) corresponds to the moisture evaporation. The oxidation behavior of the pyrolyzed AHPCS (without support) is different (Fig. 11a). There is no weight variation below 900 °C (contrary
to SiCPDC), then a very small weight loss (0.5 %) between 900 °C and 1200 °C. The latter can probably be explained by the oxidation of free carbon within the pyrolyzed residue (10 % wt.
5 mm a) 5 mm 5 mm SiC infiltrates PDC 500 µm Ex 3D printing b) Ex pyrolysis c) Ex CVD 500 µm e) PDC PORO-LAY SiCPDC SiCCVD void f) d)
free carbon, as reported in [50] and [47]). The oxidation of the amorphous ceramic therefore begins at 900 °C with a slow rate. These results confirm that after the pyrolysis of SiCPDC samples (850 °C under N2), there remains an elastomer residue (from the PORO-LAY support) which is probably rich in carbon, since it is very sensitive to oxidation. For the second weight loss of SiCPDC sample (between 600 and 900 °C), there is a competition between the oxidation of the carbon resulting from elastomer pyrolysis, the free carbon in pyrolyzed AHPCS (both causing weight losses) and SiC from pyrolyzed AHPCS, causing weight gain. The final weight loss of 35 % is therefore mainly attributed to the oxidation of the residue from the pyrolyzed elastomer (in agreement with Fig. 4b). After oxidation, the external surface of SiCPDC is covered with a white silica layer (Fig 11c), and its shape is retained.
Fig. 11. (a) Weight variation as a function of the temperature for SiCPDC and AHPCS samples, (b) weight variation as a function of time for SiCCVD sample, (c) SiCPDC sample before and after the oxidation test, (d) SiCCVD sample before and after the oxidation test.
For SiCCVD samples, there is a competition between oxidation of the pyrolyzed AHPCS free carbon, i.e. the residual carbon resulting from the pyrolysis of the elastomer, of SiC from pyrolyzed AHPCS and of SiC from CVD treatment. During the temperature plateau at 1200 °C, SiC-CVD passively oxidizes (Fig. 11b): the kinetics is parabolic and the weight gain is very
low (0.2 % between 14 h and 21 h). The passive oxidation regime, as opposed to the active one -40 -35 -30 -25 -20 -15 -10 -5 0 5 m /m 0 (% ) -6,0 -5,0 -4,0 -3,0 -2,0 -1,0 0,0 m /m 0 (% ) 0 5 10 15 20 25 0 2 -200 0 200 400 600 800 1000 1200 m/ m0 (%) Temperature(°C) 2 °C/min 1200 °C SiCPDC SiCCVD Oxidation Oxidation a) c) d) Time (h) SiCCVD -4,75 -4,70 -4,65 -4,60 14 16 18 20 22 . . . . . . . . . . AHPCS SiCPDC 1200 °C b)
[51], is expected to occur at moderate temperature in a dry atmosphere [52] [53] [54] [55], conditions that are encountered during these TGA tests. Overall, there is first a gasification of the accessible free carbon phase into CO2, ending before the 1200 °C dwell period, followed by an increase of the passive oxidation kinetics of the SiC particles and of the PDC. A very similar behavior has already been observed for the oxidation of SiC honeycombs of high porosity and containing free carbon residues [6]. The thickness of the SiO2 layer is about 400 nm after 20 h of oxidation in dry air at 1200 °C [56] [55]. The sample color changed, probably due to the silica layer formed on the surface (Fig. 11d). This is confirmed by SEM images
which show a preferential oxidation of the areas most exposed to air, i.e. of the outer surface
(Fig. 12b). The ≈ 4.5 % weight loss between 1 h and 14 h of oxidation at 1200 °C is mainly
attributed to the oxidation of the residue resulting from the pyrolysis of the elastomer. Oxygen was able to penetrate the material, despite the presence of the SiC-CVD coating. Soaking the printed samples in water dissolved the PVA and therefore created some space between the printed layers. The heat treatment has certainly resulted in a volume shrinkage and therefore a contraction of the structure, but there was still some void between layers. The CVD step did not fill all of this space and the core of the structure remained accessible to oxygen (Fig. 12a).
However, the amount of carbon is quite low in the SiCCVD sample. Optical microscopy imaging shows that the oxidation of PDC-SiC in pyrolyzed AHPCS allows forming a silica layer (Fig 13b), while the oxidation of carbon only creates voids left by the decomposition of volatile
species. In conclusion, it is obvious that the CVD step allows improving the oxidation resistance of the structures. However, oxidation is also detected in the core of the sample. To overcome this problem, a few additional hours of CVD could probably block the access to oxygen and thus protect the core of the material from oxidation.
Fig. 12. SEM images (SE) of the SiC-CVD coating after oxidation showing (a) the void between layers and (b) the oxidation traces on the outer surface of the SiCCVD sample.
Fig. 13. Optical microscopy cross-section images of oxidised SiCCVD sample (1200 °C, 20 h).
Space between layers SiO2
500 µm
20 µm
a)
b)
SiC (CVD) Oxidised PDC (SiO2) 500 µm 50 µm a) Oxidised SiCCVD b)4. Conclusion
SiC-based macro-porous open-cell ceramics with complex geometry have been synthesized for potential CSP application. The millimeter-scale open macro-porosity required for the application was generated by CAD. Then the ceramized gyroid structure and the model cylinders have been produced through the following processing steps: (i) The preforms are first manufactured by FDM 3D printing. A hydrosoluble polymer/elastomer mixture wire (PORO-LAY) is used to print the specimen. The printed structures are soaked 4 days in water to reveal the micro-porosity by PVA dissolution. (ii) The transformation of the obtained elastomer structure into an inorganic material is performed by impregnation in AHPCS, a preceramic resin. The resin covers the micro-porosity and the surface of the elastomer microporous structure. Two successive thermal treatments for crosslinking (under air) and for pyrolysis (under nitrogen) allow obtaining a PDC structure. This mineral lattice remains very brittle and has to be consolidated. (iii) CVD is used for the strengthening of the PDC structures. First, a conventional treatment allows filling the microcracks on the surface of the PDC structure and then depositing a ≈ 100 μm thick layer of SiC coating on all the walls of the structure. Except a controllable volume shrinkage after pyrolysis, the multi-scale porous structure is well preserved after the final CVD step. Because of the void left by the decomposition of the supporting polymer, the walls of the structure are not completely filled by gas phase deposition. After the CVD step, the oxidation resistance are strongly improved. AHPCS resin cracks during pyrolysis, which is favorable for infiltration by CVD. The post-pyrolysis residue must be as porous as possible to improve the diffusion of reactive gases towards the core of the walls structure.
The process must be improved. Three principal directions can be considered: (i) Putting the structures under vacuum during the impregnation step could improve the penetration of the resin in the walls core and therefore increase the surface on which the SiC-CVD coating can be deposited; (ii) block the gyroid structures during heat treatments steps to prevent them from deforming; (iii) Continuing CVD for additional hours or modifying CVD parameters to increase the growth rate would surely allow a better degree of pore filling. Finally, it would also be interesting to study the mechanical behavior and resistance to thermal shock of the gyroid structures for a potential application in volumetric receiver in thermodynamic solar power plants. Indeed, in this case and contrary to the oxidation resistance, the geometry of the structure should play a major role on the mechanical properties of the material.
Some tests have also been performed on larger objects and the results are very similar to the 25 mm side gyroid. This process is very interesting because it is not limited to gyroid structures, but it can be extended to other complex geometry structures, impregnated by other types of resin (carbon precursor thermoset resin for example) and consolidated by other materials deposited by CVD.
Acknowledgments
This work was supported by the French Alternative Energies and Atomic Energy Commission (CEA) through a PhD grant to A. B. The authors are grateful to L. Lapuyade, G. Couégnat and O. Caty from LCTS, respectively for TGA analyses, STL files generation and X-ray CT measurements. X-ray CT measurements were carried out at the Placamat (CNRS, Univ. Bordeaux, UMS 3626, Pessac, France) facility.
References
[1] S. Alexopoulos, B. Hoffschmidt, Advances in solar tower technology, Wiley Interdisciplinary Reviews: Int. J. Energy Environ. 6(1) (2017) e217. http://dx.doi.org/10.1002/wene.217
[2] O. Behar, A. Khellaf, K. Mohammedi, A review of studies on central receiver solar thermal power plants, Renewable Sustainable Energy Rev. 23 (2013) 12-39. https://doi.org/10.1016/j.rser.2013.02.017
[3] C.K. Ho, B.D. Iverson, Review of high-temperature central receiver designs for concentrating solar power, Renew. Sustain. Energy Rev. 29 (2014) 835–846, https://doi.org/10.1016/j.rser.2013.08.099.
[4] A.L. Ávila-Marin, Volumetric receivers in Solar Thermal Power Plants with Central Receiver System technology: a review, Sol. Energy 85(5) (2011) 891-910. https://doi.org/10.1016/j.solener.2011.02.002
[5] D.G. Morris, A. López-Delgado, I. Padilla, M.A. Muñoz-Morris, Selection of high temperature materials for concentrated solar power systems: Property maps and experiments, Sol. Energy 112 (2015) 246-258. https://doi.org/10.1016/j.solener.2014.09.050
[6] C.C. Agrafiotis, I. Mavroidis, A.G. Konstandopoulos, B. Hoffschmidt, P. Stobbe, M. Romero, V. Fernandez-Quero, Evaluation of porous silicon carbide monolithic honeycombs as volumetric receivers/collectors of concentrated solar radiation, Sol. Energy Mater. Sol. Cells 91(6) (2007) 474-488. https://doi.org/10.1016/j.solmat.2006.10.021
[7] T. Fend, High porosity materials as volumetric receivers for solar energetics, Opt. Applicata
40(2) (2010) 271-284.
http://opticaapplicata.pwr.edu.pl/files/pdf/2010/no2/optappl_4002p271.pdf
[8] Z. Wu, C. Caliot, F. Bai, G. Flamant, Z. Wang, J. Zhang, C. Tian, Experimental and numerical studies of the pressure drop in ceramic foams for volumetric solar receiver
applications, Appl. Energy 87(2) (2010) 504-513.
http://dx.doi.org/10.1016/j.apenergy.2009.08.009
[9] T. Fend, B. Hoffschmidt, R. Pitz-Paal, O. Reutter, P. Rietbrock, Porous materials as open volumetric solar receivers: Experimental determination of thermophysical and heat transfer properties, Energy 29(5-6) (2004) 823-833. https://doi.org/10.1016/S0360-5442(03)00188-9
[10] T. Fend, R. Pitz-Paal, O. Reutter, J Bauer, B. Hoffschmidt, Two novel high-porosity materials as volumetric receivers for concentrated solar radiation, Sol. Energy Mater. Sol. Cells 84(1-4) (2004) 291-304. https://doi.org/10.1016/j.solmat.2004.01.039
[11] S. Mey-Cloutier, C. Caliot, A. Kribus, Y. Gray, G. Flamant, Experimental study of ceramic foams used as high temperature volumetric solar absorber, Sol. Energy 136 (2016) 226-235. https://doi.org/10.1016/j.solener.2016.06.066
[12] M. Scheffler, P. Colombo, Cellular Ceramics, 2005, 122-136. Wiley-VCH ISBN: 978-3-527-31320-4.
[13] A. Ortona, E. Rezaei, Modeling the Properties of Cellular Ceramics: From Foams to Lattices and Back to Foams (conference paper), CIMTEC 2014: 13th Ceramics Congress, Montecatini Terme, Italy, Adv. Sci. Technol. 91 (2014) 70-78. https://doi.org/10.4028/www.scientific.net/AST.91.70
[14] M. Romero, J. González-Aguilar, E. Zarza, Concentrating solar thermal power, in: Handboook of Energy Efficiency and Renewable Energy, Chapter 19, D. Y. Goswami, F. Kreith eds., CRC Press Taylor & Francis Group, Boca Raton, Florida, 2nd ed., 2017, pp. 655-763. https://doi.org/10.1201/9781315374192
[15] Z. Chen, Z. Li, J. Li, C. Liu, C. Lao, Y. Fu, C. Liu, Y. Li, P. Wang, Y. He, 3D printing of ceramics: A review, J. Eur. Ceram. Soc. 39(4) (2019) 661-687. https://doi.org/10.1016/j.jeurceramsoc.2018.11.013
[16] U. Lakshminarayan, S. Ogrydiziak, H. Marcus, Selective laser sintering of ceramic materials, Procs. 1990 International Solid Freeform Fabrication Symposium, D. Borrell, ed., p. 16-26, U. Texas at Austin, (1990). http://utw10945.utweb.utexas.edu/Manuscripts/1990/1990-03-Lakshiminarayan.pdf
[17] S. Danforth, Fused deposition of ceramics: a new technique for the rapid fabrication of ceramic components, Mater. Technol. 10(7-8) (1995) 144–146. https://doi.org/10.1080/10667857.1995.11752614
[18] M.L. Griffith, J.W. Halloran, Freeform fabrication of ceramics via stereolithography, J. Amer. Ceram. Soc. 79(10) (1996) 2601-2608. https://doi.org/10.1111/j.1151-2916.1996.tb09022.x
[19] T. Chartier, A. Badev, Rapid Prototyping of Ceramics, chap. 6.5 of Handbook of Advanced Ceramics, 2nd Edition, S. Somiya and M. Kaneko eds., 2013, pp. 489-524. https://doi.org/10.1016/B978-0-12-385469-8.00028-9
[20] A. Zocca, P. Colombo, C.M. Gomes, J. Gunster, Additive Manufacturing of Ceramics: Issues, Potentialities, and Opportunities, J. Amer. Ceram. Soc. 98(7) (2015) 1983-2001. http://dx.doi.org/10.1111/jace.13700
[21] G. Franchin, P. Colombo, Porous geopolymer components through inverse replica of 3D printed sacrificial templates, J. Ceram. Sci. Technol 6(2) (2015) 105-112. http://dx.doi.org/10.4416/JCST2014-00057
[22] S. Mohanty, I. Mantis, A. Chetan, L. Larsen, M. Dufva, J. Emnéus, A. Wolff, Fabrication of three-dimensional tissue engineering polydimethylsiloxane (PDSM) microporous scaffolds integrated in a bioreactor using a 3D printed water dissolvable sacrificial mould (conference paper), Procs. 19th International Conference on miniaturized systems for chemistry and life sciences, October 25-29, 2015, Gyeonggju, Korea, J.-K. Park, D.-P. Kim, M. Tokeshi, Q. Fang,Y.-K. Cho, Y. Nam, eds., pp. 1439-1441 (2015). ISBN: 978-0-9798064-8-3. https://www.rsc.org/images/LOC/2015/PDFs/Papers/1439_T.383f.pdf
[23] K. Parthy, Polymergemisch für den 3D Druck zur Erzeugung von Objekten mit Poren-Strukturen [Polymer mixture for 3D printing to create objects with pore structures], German Patent DE102013011243(A1) filed Jul. 7th, 2013, published Jan 8th, 2015.
[24] K. Parthy, Filament und Polymergemisch für den FDM 3D-Druck zur Erzeugung von temporären Hilfs-Strukturen [Filament and polymer mixture for FDM 3D printing to create temporary auxiliary structures], German Patent DE102016005710(A1)filed Jul. 9th, 2016, published Jan. 11th, 2018
[25] J. You, R. Preen, L. Bull, J. Greenman, I. Ieropoulos, 3D printed components of microbial fuel cells: Towards monolithic microbial fuel cell fabrication using additive layer manufacturing, Sustainable Energy Technologies and Assessments, 19 (2017) 94-101. https://doi.org/10.1016/j.seta.2016.11.006
[26] M. Belka, S. Ulenberg, T. Bączek, Fused deposition modeling enables the low-cost fabrication of porous, customized-shape sorbents for small-molecule extraction, Anal. Chem. 89(8) (2017) 4373-4376.http://dx.doi.org/10.1021/acs.analchem.6b04390
[27] Z. Starosolski, D. Ezon, R. Krishnamurthy, N. Dodd, J. Heinle, D. McKenzie, A. Annapragada, Soft tissue models: Easy and inexpensive flexible 3D printing as a help in surgical planning of cardiovascular disorders, Procs. SPIE Medical Imaging 2017: Imaging Informatics for Healthcare, Research, and Applications, Orlando, FL, 2017, art. No. 101380Q, 7p. (2017) . https://doi.org/10.1117/12.2253961
[28] M. do Carmo, Differential Geometry of Curves and Surfaces, Prentice-Hall, Englewood Cliffs, NJ, 1976. ISBN: 978-0132125895
[29] S. Torquato, A. Donev, Minimal surfaces and multifunctionality, Procs. Roy. Soc. London
A: Math. Phys. Eng. Sci. 460(2047) (2004) 1849-1856.
http://dx.doi.org/10.1098/rspa.2003.1269
[30] Y. Jung, S. Torquato, Fluid permeabilities of triply periodic minimal surfaces, Phys. Rev. E 72(5) (2005) 056319. http://dx.doi.org/10.1103/PhysRevE.72.056319
[31] G. Vignoles, D. Rochais, S. Chupin, Computation of the conducto-radiative effective heat conductivity of porous media defined by Triply Periodic Minimal Surfaces, Int. J. Therm. Sci. 159 (2021) 106598. https://dx.doi.org/10.1016/j.ijthermalsci.2020.106598
[32]S.N. Khaderi, V.S. Deshpande, N.A. Fleck, The stiffness and strength of the gyroid lattice, Int. J. Sol. Struct. 51(23-24) (2014) 3866-3877. http://dx.doi.org/10.1016/j.ijsolstr.2014.06.024 [33] H. G. von Schnering, R. Nesper, Nodal surfaces of Fourier series: Fundamental invariants of structured matter, Z. Phys. B: Condens. Matter 83(3) (1991) 407–412. http://dx.doi.org/10.1007/BF01313411
[34] O. Al-Ketan, M. Adel Assad, R. Abu Al-Rub, Mechanical properties of periodic interpenetrating phase composites with novel architected microstructures, Compos. Struct. 176 (2017) 9–19. http://dx.doi.org/10.1016/j.compstruct.2017.05.026
[35] M. Wohlgemuth, N. Yufa, J. Hoffman, E. Thomas, Triply periodic bicontinuous cubic microdomain morphologies by symmetries, Macromolecules 34 (2001) 6083-6089. http://dx.doi.org/10.1021/ma0019499
[36] F. Christin, L. Héraud, J.-J. Choury, R. Naslain, P. Hagenmuller, In-depth Chemical Vapor Deposition of SiC within porous carbon-carbon materials, Proceedings of the 3rd European Conference on Chemical Vapor Deposition, H.E. Hintermann ed., Laboratoire Suisse de Recherches Horlogères, Neuchâtel, Switzerland, 1980, pp. 154-161.
[37] F. Loumagne, F. Langlais, R. Naslain, S. Schamm, D. Dorignac, J. Sévely, Physicochemical properties of SiC-based ceramics deposited by low pressure CVD from
CH3SiCl3-H2, Thin Sol. Films 254(1-2) (1995) 75-82. https://doi.org/10.1016/0040-6090(94)06237-F
[38] W.G. Zhang, K.J. Hüttinger, CVD of SiC from methyltrichlorosilane. Part II: composition of the gas phase and the deposit, Chem. Vap. Deposition 7(4) (2001) 173-181. https://doi.org/10.1002/1521-3862(200107)7:4%3c173::AID-CVDE173%3e3.0.CO;2-X [39] L. L. Snead, T. Nozawa, Y. Katoh, T.-S. Byun, S. Kondo, D. A. Petti, Handbook of SiC properties for fuel performance modeling, J. Nucl. Mater. 371 (2007) 329-377. https://doi.org/10.1016/j.jnucmat.2007.05.016
[40] G. Chollon, S. Delettrez, F. Langlais, Chemical vapour infiltration and mechanical properties of carbon open-cell foams, Carbon 66 (2014) 18-30. https://doi.org/10.1016/j.carbon.2013.08.021
[41] K. Terrani, B. Jolly, M. Trammell, 3D printing of high-purity silicon carbide, J. Amer. Ceram. Soc. 103(3) (2020) 1575 – 1581. https://doi.org/10.1111/jace.16888
[42] A. Baux, A. Goillot, S. Jacques, C. Heisel, D. Rochais, L. Charpentier, P. David, T. Piquero, T. Chartier, G. Chollon, Synthesis and Properties of macroporous SiC Ceramics synthesized by 3D printing and chemical vapor infiltration/deposition, J. Eur. Ceram. Soc. 40(8) (2020) 2834-2854. https://doi.org/10.1016/j.jeurceramsoc.2020.03.001
[43] T. Koyanagi, K. Terrani, S. Harrisson, J. Liu, Y. Katoh, Additive manufacturing of silicon carbide for nuclear applications, J. Nucl. Mat. 543 (2020) 152577. https://doi.org/10.1016/j.jnucmat.2020.152577
[44] FreeCad, Your own 3D parametric modeler, https://www.freecadweb.org/ [45] Repetier, slicing all support structures, https://www.repetier.com/
[46] S. Kaur, R. Riedel, E. Ionescu, Pressureless fabrication of dense monolithic SiC ceramics from a polycarbosilane, J. Eur. Ceram. Soc. 34(15) (2014) 3571-3578. https://doi.org/10.1016/j.jeurceramsoc.2014.05.002
[47] R. Sreeja, B. Swaminathan, A. Painuly, T.V. Sebastian, S. Packirisamy, Allylhydridopolycarbosilane (AHPCS) as matrix resin for C/SiC ceramic matrix composites, Mater. Sci. Eng. A. 168 (2010) 204-207. https://doi.org/10.1016/j.mseb.2009.12.033
[48] A. Baux, L. Nouvian, K. Arnaud, S. Jacques, T. Piquero, D. Rochais, P. David, G. Chollon, Synthesis and properties of multiscale porosity TiC-SiC ceramics, J. Eur. Ceram. Soc. 39(8) (2019) 2601–2616. https://doi.org/10.1016/j.jeurceramsoc.2019.02.031
[49] P. Jana, E. Zera, G.D. Sorarù, Processing of preceramic polymer to low density silicon carbide foam, Mater. Des. 116 (2017) 278-286. http://dx.doi.org/10.1016/j.matdes.2016.12.010 [50] C. Hoffman, T. Biemelt, A. Seifert, K. Pinkert, T. Gemming, S. Spange, S. Kaskel, Polymer-derived nanoporous silicon carbide with monodisperse spherical pores, J. Mater. Chem. 22(47) (2012) 24841-24847. https://doi.org/10.1039/c2jm34799g
[51] P.J. Jorgensen, M.E. Wadsworth, I.B. Cutler, Oxidation of Silicon Carbide, J. Amer. Ceram. Soc. 42(12) (1959) 613–616. http://dx.doi.org/10.1111/j.1151-2916.1959.tb13582.x [52] B. Schneider, A. Guette, R. Naslain, M. Cataldi, A. Costecalde, A theoretical and experimental approach to the active-to-passive transition in the oxidation of silicon carbide, J. Mater. Sci. 33 (1998) 535-547. https://doi.org/10.1023/A:1004313022769
[53] T. Narushima, T. Goto, Y. Igushi, T. Hirai, High-temperature active oxidation of chemically vapor-deposited silicon carbide in an Ar-O2 atmosphere, J. Amer. Ceram. Soc. 74(10) (1991) 2583-2586. https://doi.org/10.1111/j.1151-2916.1991.tb06803.x
[54] J.A. Costello, R.E. Tressler, Oxidation kinetics of hot-pressed and sintered -SiC, J. Amer. Ceram. Soc. 64(6) (1981) 327-331. https://doi.org/10.1111/j.1151-2916.1981.tb10297.x [55] J.A. Costello, R.E. Tressler, Oxidation kinetics of silicon carbide crystals and ceramics: I, in dry oxygen, J. Amer. Ceram. Soc. 69(9) (1986) 674–681, https://doi.org/10.1111/j.1151-2916.1986.tb07470.x
[56] C.E. Ramberg, G. Cruciani, K.E. Spear, R.E. Tressler, C.F. Ramberg Jr, Passive oxidation kinetics of high-purity silicon carbide from 800° to 1100°C, J. Amer. Ceram. Soc. 79 (11) (1996) 2897–2911, https://doi.org/10.1111/j.1151-2916.1996.tb08724.x