HAL Id: cea-02529165
https://hal-cea.archives-ouvertes.fr/cea-02529165
Submitted on 15 May 2020
HAL is a multi-disciplinary open access
archive for the deposit and dissemination of
sci-entific research documents, whether they are
pub-lished or not. The documents may come from
teaching and research institutions in France or
abroad, or from public or private research centers.
L’archive ouverte pluridisciplinaire HAL, est
destinée au dépôt et à la diffusion de documents
scientifiques de niveau recherche, publiés ou non,
émanant des établissements d’enseignement et de
recherche français ou étrangers, des laboratoires
publics ou privés.
Measurement of the
236
U(n,f) cross-section between 4
and 10 MeV with Micromegas detectors
V. Michalopoulou, M. Diakaki, A. Stamatopoulos, A. Kalamara, M. Kokkoris,
A. Lagoyannis, N. Patronis, A. Tsinganis, R. Vlastou
To cite this version:
V. Michalopoulou, M. Diakaki, A. Stamatopoulos, A. Kalamara, M. Kokkoris, et al.. Measurement
of the
236U(n,f) cross-section between 4 and 10 MeV with Micromegas detectors. HNPS Advances
in Nuclear Physics, Hellenic Nuclear Physics Society, 2019, Proceedings of the The 27th Annual
Symposium of the Hellenic Nuclear Physics Society, 26, pp.172-178. �10.12681/hnps.1815�.
�cea-02529165�
Measurement of the
236U(n,f) cross section at fast neutron energies with
Mi-cromegas Detectors
M. Diakaki1,2,∗, V. Michalopoulou3,2,∗∗, A. Tsinganis3, A. Axiotis4, A. Kalamara2, M. Kokkoris2, A. Lagoyiannis4,
N. Patronis5, A. Stamatopoulos2, and R. Vlastou2
1CEA, DEN, DER/SPRC/LEPh, Cadarache, F-13108 Saint Paul Lez Durance, France 2National Technical University of Athens, Greece
3European Organization for Nuclear Research (CERN), Switzerland 4National Centre for Scientific Research ‘Demokritos’, Greece 5University of Ioannina, Greece
Abstract.In the present work, the measurement of the236U(n,f) cross section was performed, with reference
to the238U(n,f) reaction. The measurements took place at the neutron beam facility of the National Centre for
Scientific Research “Demokritos” (Greece) and the quasi-monoenergetic neutron beams were produced via the
2H(d,n)3He reaction in the energy range 4 – 10 MeV. Five actinide targets (two236U, two238U and one235U) and
the corresponding Micromegas detectors for the detection of the fission fragments were used. Detailed Monte Carlo simulations were performed, on one hand for the study of the neutron flux and energy distribution at the position of each target, and on the other hand for the study of the energy deposition of the fission fragments in the active volume of the detector. The mass and homogeneity of the actinide targets were experimentally deter-mined via alpha spectroscopy and the Rutherford Backscattering Spectrometry, respectively. The experimental procedure, the analysis, the methodology implemented to correct for the presence of parasitic neutrons and the cross section results will be presented and discussed.
1 Introduction
The accurate knowledge of neutron-induced cross sections is of great importance for the study and design of new gen-eration reactors. Specifically, the isotope236U becomes important in the232Th/233U fuel cycle when the fuel expe-riences the high burn-up chain (234U ->235U ->236U, via sequential (n,γ) reactions), and acts as242Pu in the conven-tional uranium cycle. Thus, its fission cross section is re-quired with 5% accuracy ([1],[2]). However, in the energy range 4 - 10 MeV few available data sets exist in literature, leading to discrepancies between the latest evaluations up to 9%.
The most recent measurement has been performed by Tovesson et al. [3] with the neutron time-of-flight method at LANSCE (Los Alamos). The rest of the measurements have been performed several decades ago with quasi-monoenergetic neutron beams by Meadows [4] and White and Warner [5] and in a wide energy range by Rosler et al. [6] and Henkel [7]. The measurements by Tovesson et al., Meadows and Rosler et al. are in overall good agree-ment with each other, although above 7 MeV the data from Rosler et al. deviate from the other two measurements and the differences go up to 40%. The data from Henkel are systematically lower from the other data sets.
∗e-mail: maria.diakaki@cea.fr
∗∗e-mail: veatriki.michalopoulou@cern.ch
In the present work, new measurements were per-formed in the energy range 4 - 10 MeV and are pre-sented here. The measurement took place at the neutron beam facility of the National Centre for Scientific Re-search “Demokritos” (Greece). The quasi-monoenergetic neutron beams were produced via the2H(d,n)3He reaction at several neutron energies in the energy range 4 - 10 MeV. A first exploratory experiment was previously performed [8], in order to establish the analysis methodology and new measurements were performed in this energy range.
2 Experimental
2.1 Neutron production facility
The experiment was performed at the neutron beam facility of the National Centre for Scientific Research “Demokritos” using the 5.5 MV Van de Graaff Tandem ac-celerator. In this facility, the quasi-monoenergetic neutron beams are produced via nuclear reactions of accelerated ions, impinging on gas or solid targets. The measurements in the context of the present work were performed with neutron beams produced via the2H(d,n) reaction. A deu-terium gas target fitted with 5 µm Mo entrance foil and 1 mm Pt beam stop is bombarded with a deuteron beam of the appropriate energy. The gas cell has a total length of 3.7 cm and a diameter of 1 cm, and is typically pressurized to ≈ 1.2 atm.
Several factors affect the monochromaticity and the fluence of the neutron beam, such as i) the energy strag-gling of the deuteron beam from the interaction with the Mo foil and the deuteron atoms in the gas cell, ii) the
2H(d,n) reaction kinematics (very small effect to the
neu-tron energy distribution for this target-to-gas cell distance, because the angular acceptance is less than ≈6◦for all tar-gets), iii) deuteron-induced reactions in the materials of the collimation system and/or the gas cell, producing neu-trons with energies different than the main beam, iv) scat-tering of the neutron beam in the surrounding materials of the targets and v) the deuteron breakup reaction which creates lower energy neutrons for Ed≥ 4.45 MeV. The
en-ergy rippling of the deuteron beam did not exceed 4 keV, having a negligible effect on the monochromaticity of the produced neutron beam.
When the cross section measurement of interest cor-responds to a non-threshold reaction, or a reaction with a significant cross section value in a wide neutron energy range, such as fission, and in the absence of a time-of-flight technique, a thorough investigation of the impact of these factors on the monochromaticity and fluence of the neutron beam is essential. This investigation is presented in Sect. 3.
2.2 Detection setup
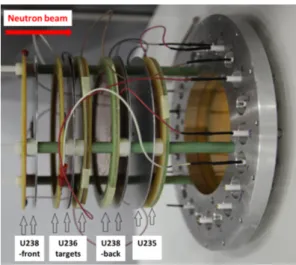
The detection system consisted of a stack of ionisation gas cells based on the Micromegas Microbulk technology [9, 10] for the detection of the fission fragments (FF), each one containing one actinide target, the backing of which served as the detector drift electrode. In total, 5 actinide targets were used, placed in an aluminium chamber filled with a mixture of 80% Ar - 20% CO2 kept at
approxi-mately atmospheric pressure and room temperature. Two
236U targets were put back to back and two238U targets
before and after them for monitoring the neutron fluence. Finally, a235U target was used, as a very sensitive tool to low energy neutron background. The experimental setup is described in more detail in [8], while a photo of the tar-get assembly can be seen in Fig. 1. The actinide tartar-gets, in the form of thin disks of uranium oxides were manu-factured via the painting technique and provided by the Institute of Physics and Power Engineering, Obninsk, and the Joint Institute of Nuclear Research, Dubna.
3 Analysis
3.1 Cross section calculation
For each incident neutron energy, the cross section of the
236U(n,f) reaction was calculated relative to the238U(n,f)
reaction, via the expression
σU6= YU6 YU8 · f in/out U6 fU8in/out · f par U6 fU8par · fU6amp.cut fU8amp.cut · ΦU8 ΦU6 ·NU8 NU6 ·σU8
where Y are the FF counts recorded by the detectors and corrected for i) the parasitic counts induced by neutrons of lower energies than the main neutron beam, generated
Figure 1. Photo of the target-detector assembly. The arrows show the targets and the corresponding detectors. The two236U
targets were put back to back.
from deuteron reactions at the structural materials of the gas cell and beam line ( fin/out) and from the other sources described in sec 2.1 ( fpar) and ii) the amplitude cut
intro-duced in the analysis ( famp.cut).Φ is the neutron fluence of the main energy peak for each target estimated via Monte Carlo simulations, N is the areal density of each target and σU8is the cross section of the238U(n,f) reaction for each
neutron energy. The determination of each of these terms is described in the following sections.
3.1.1 Estimation of fission counts and correction factors
A typical pulse height spectrum from a 236U target is
shown in Fig. 2. Both the alpha peak from the radioac-tivity of the targets and the FF are present in the spectrum. The FF counts (Y) are deduced from the integration of the spectrum, choosing carefully the integration limits from beam off spectra, in order to exclude all alpha counts.
However, these counts include fission events produced by parasitic neutrons from deuteron-induced reactions with structural materials of the gas cell and the beam line. For the estimation of these events, after each run the gas cell was emptied from the deuterium gas and bombarded with the deuteron beam under the same conditions. The fission events recorded with the empty gas cell are esti-mated from the gas-out spectra retaining the same inte-gration limits as the gas-in spectra for each target. These events are attributed to neutrons created from parasitic (d,n) reactions and subtracted from the events of the cor-responding run, after normalisation to the same integrated incident deuteron charge. This correction ( fin/out) ranges between 6 and 25% for236U and238U targets, and between
11 and 34% for the235U target.
An additional correction required to the FF counts, is a correction for the FF which are lost under the alpha peak and need to be taken into account. This correction
( famp.cut) is estimated by FLUKA [11, 12] simulations
Typ-ically the famp.cut values deduced for the different targets were of the order of 5%. The corresponding systematic un-certainty was estimated by changing the choice of thresh-old and was of the order of 3%, resulting in an uncertainty of ≤0.5% for the f
amp.cut U6
fU8amp.cut ratio. The experimental and
simu-lated spectra for the fission fragments are shown in Fig. 3. Moreover, fission fragment counts created from neu-trons of energy lower than the main neutron beam need to be subtracted from the total FF counts Y. The estimation of this correction factor ( fpar) is discussed in detail in Sect.
3.2. The systematic uncertainty at the final cross section value from this factor was estimated to be ≤2-3%.
Figure 2. Experimental pulse height spectrum for236U at E n=7.5
MeV.
Figure 3. Experimental (upper figure) and simulated (lower fig-ure) spectrum for the fission fragments.
3.1.2 Samples
A crucial parameter in the cross section measurements is the number of nuclei in the targets (N), and in the case of in-homogeneous neutron beams, the spatial distribution of the material on the surface of the targets. The first factor was studied with high accuracy alpha spectroscopy mea-surements using Silicon Surface Barrier detectors of dif-ferent surfaces (described in [15]). The final mass values and the corresponding uncertainties can be found in Ta-ble 1. The contaminants of each target were determined with the same methodology and were orders of magnitude lower than the main actinide, having a negligible contribu-tion to the FF counts.
The second factor was studied with the Rutherford Backscattering Spectrometry (RBS) technique using an external ion-beam setup (described in [15]), and it turned out that the targets were homogeneous within ≤15%. Fur-thermore, as mentioned above, the flux inhomogeneity due to the2H(d,n) reaction kinematics was very small,
conse-quently the small target inhomogeneities do not affect the quality of the results.
3.2 Neutron fluence study
Detailed Monte Carlo simulations were performed imple-menting the neutron beam line and the detector assembly. The Monte Carlo simulations were used i) for the estima-tion of the neutron fluence at each target Φ, taking into account the position of the target with respect to the tron beam and ii) for the estimation of the parasitic neu-trons resulting from neutron scattering in the experimental setup and the deuteron break-up reaction for Ed ≥ 4.45
MeV ( fpar).
The simulations were performed with the MCNP5 code [16], using the neutron source file created from the NeuSDesc code [17]. The NeuSDesc code, coupled with SRIM-2008 [18], generates a neutron source file compati-ble with MCNP5. NeuSDesc takes into account the energy loss and energy and lateral straggling of the deuteron beam in the gas cell materials, the kinematics of the2H(d,n)3He
reaction and the deuteron break-up in the gas cell. This combination of codes has already been successfully used for the study of the neutron fluence in this facility [19].
In Fig. 4, the simulated neutron fluence at the posi-tion of the 236U targets is shown for the energies of 4.5, 7.5 and 10.0 MeV. As seen in Fig. 4, apart from the main neutron energy peak, parasitic neutrons are present in the fluence and need to be accounted for in the analysis. In order to do so, the parasitic fluence, normalized to the ex-periment statistics, is multiplied with the cross section of each target, estimating in this way the correction factor fpar. The correction factor fpar was in the range 3-16%
for the 238U and 236U targets, depending on the energy
of the neutron beam. However, regarding the 235U
tar-get the fparcorrection factor was ranging between 5% and
21% and was not enough for the correction of the para-sitic counts for the235U target. This can be explained by
the high cross section of the235U(n,f) reaction in the low
Table 1. Summary of the target masses
236U 238U 235U
Diameter (cm) 8 5.2 5.2 Half life (y) 2.342 · 107 4.468 · 109 7.038 · 108 Specific Activity (Bq/mg) 2393 ± 4 12.44± 0.01 79.98± 0.06
Mass values (mg) 5.40 ± 0.06 9.90 ± 0.13 (front) 4.96 ± 0.06 5.01 ± 0.05 9.03 ± 0.12 (back)
Contaminants (mg) - - 234U(9· 10−5)
between 10−6to 10−1MeV seems to be underestimated by the simulations, losing parasitic counts from the neutron scattering in the experimental area, which is not included in the simulations. An estimation of the parasitic counts lost in the simulations was achieved by introducing a low energy parasitic flux in order to reproduce the experimen-tal reaction rate of the 235U target by the simulations, as
shown in Fig. 5, for the run at 7.5 MeV. It is important to note that this added parasitic flux has negligible effect (≤1% for all neutron energies) on the parasitic correction for the238U and 236U targets, since the cross sections of
the 236U(n,f) and238U(n,f) reactions are very low below the fission threshold.
The estimated uncertainty of the cross section results related to the ratioΦU8
ΦU6 was estimated from the comparison
of the simulated to the experimental ΦU8− f ront
ΦU8−back one and was
found to be of the order of 2-3%.
Finally, the systematic uncertainty of the cross section results related to the f
par U6
fU8par correction factor was estimated
by changing the shape and quantity of the parasitic tail obtained from the simulations and was found to be 0.1-2% for the different neutron energies. In addition, this ra-tio varied within ≤1% for all neutron energies, when us-ing different evaluated libraries. Therefore, the impact of this factor at the final cross section results was found to be within their statistical errors. This can be explained by the very similar cross section shapes of the238U(n,f) and the 236U(n,f) reactions, in the region where the parasitic
neu-trons are present, justifying the choice of238U as reference
target for this experiment.
Figure 4. Simulated neutron fluence at the236U target for neutron
energies 4.5, 7.5 and 10.0 MeV.
Figure 5. Simulated neutron fluence at the235U target for neutron
energy 7.5 MeV and the low energy parasitic flux introduced for the correction of the simulations.
4 Results
The cross-section results obtained from the present work for the236U(n,f) reaction are presented in Table 2, along with their statistical uncertainties. The cross section pre-sented is the weighted average value from the two 236U targets. The uncertainty of the neutron energy was esti-mated from the full width at half maximum of the main energy peak at each neutron energy, as obtained from the Monte Carlo simulations. The main systematic uncertain-ties, discussed in Sect. 3, can be found in Table 3.
The cross-section results along with the existing ex-perimental data-sets are presented in Fig. 6. The data with the symbol "r" correspond to cross section ratios
236U(n,f)/235U(n,f) available in EXFOR [20], converted to
cross section points using the ENDF/B-VIII.0 [21] eval-uation for the 235U reaction (linear interpolation when needed). The results are in very good agreement with the latest data by Tovesson et al. and in overall good agreement with the data by Meadows. Comparing with the data by Rosler et al. the present measurement is in agreement within errors until the energy of 7 MeV, after which the data by Rosler et al. are in disagreement with all existing measurements. The data point from White and Warner at 5.4 MeV is higher by ∼ 9% from the corre-sponding value from this work at 5.5 MeV and from the previous measurements. As mentioned in Sect. 1, the data by Henkel are systematically lower from the cross-section values of all previous measurements. Finally, the data of the 236U(n,f)/235U(n,f) ratio, found in EXFOR and
con-Table 2. Cross-section results for the236U(n,f) reaction. Energy Cross-section (MeV) (barns) 4.5 ± 0.2 0.811 ± 0.022 5.0 ± 0.1 0.787 ± 0.031 5.5 ± 0.1 0.783 ± 0.020 6.0 ± 0.1 0.887 ± 0.012 7.0 ± 0.1 1.423 ± 0.021 7.5 ± 0.1 1.511 ± 0.022 8.5 ± 0.1 1.638 ± 0.033 9.5 ± 0.1 1.558 ± 0.020 10.0 ± 0.1 1.458 ± 0.017
Table 3. Contribution of the main systematic uncertainties of the different factors to the cross section calculation
Contribution Uncertainty (%) Target mass ≈ 1.5% fU6amp.cut fU8amp.cut ≺0.5% ΦU8 ΦU6 2-3% fU6par fU8par 1-2% σU8 0.7-0.95%
verted to236U(n,f) cross-section points, overall agree with
the data of the present work, some of them being however systematically higher than the latter for energies below 6 MeV.
The cross-section results compared with the latest evaluations are shown in Fig. 7. As seen in this figure, for energies lower than 6 MeV the data from this work are lower than the latest evaluations from ENDF/B-VIII.0 [21], JENDL-4.0 [23] and CENDL-3.1 [24], while at this energy region the data points at 5 and 5.5 MeV are closer in value with the evaluation from JEFF-3.3, although with-out following the shape and values of the evaluation at the other data points. Above 6 MeV, the present work is in overall agreement with the latest evaluations, following the JENDL-4.0 and CENDL-3.1 evaluations at higher en-ergies, which present a decrease in the cross-section values after 9.5 MeV.
5 Conclusions
The measurement of the 236U(n,f) cross-section was performed, using the238U(n,f) as reference reaction with quasi-monoenergetic neutron beams at various energies in the range 4 - 10 MeV. A detailed study of the different factors in the cross section calculation was performed and presented in this contribution. The results are compared to the latest evaluations and other experimental data found in the EXFOR database. More data points are planned to be measured with the same methodology in the near future with the 7Li(p,n) and 3H(d,n) neutron
production reactions, at lower and higher energy intervals respectively.
Figure 6. Cross-section results for 236U(n,f) reaction (black
points), along with the statistical uncertainties, in comparison to experimental datasets from EXFOR.
Figure 7. Cross-section results for 236U(n,f) reaction (black
points), statistical errors only, in comparison with the latest evaluation libraries ENDF/B-VIII.0 (blue), JEFF-3.3 (green), JENDL-4.0 (red) and CENDL-3.1 (grey).
Acknowledgements: This research is implemented through IKY scholarships programme and co-financed by the European Union (European Social Fund - ESF) and Greek national funds through the action entitled Re-inforcement of Postdoctoral Researchers, in the frame-work of the Operational Programme Human Resources Development Program, Education and Lifelong Learning of the National Strategic Reference Framework (NSRF) 2014–2020.
References
[1] U. Abbondanno et al., “Measurements of Fission Cross Sections for the Isotopes relevant to the Tho-rium Fuel Cycle”, CERNINTC- 2001-025 INTC-P-145 (CERN, Geneva, 2001)
[2] V. G. Pronyaev, IAEA report No. INDC(NDS)-408 (1999)
[3] F. Tovesson et al., Nucl. Sci. and Eng. 178, 57 (2014) [4] J.W. Meadows, Nucl. Sci. and Eng. 65, 171 (1978) [5] P.H. White and G.P. Warner, Journal of Nuclear
En-ergy 21, 671 (1967)
[7] R.L. Henkel, Los Alamos Scientific Lab. Reports, No.1495 (1952)
[8] M. Diakaki et al., Acta Physica Polonica B 47, No. 3 (2016)
[9] Y. Giomataris, Ph. Rebourgeard, J. P. Robert and G. Charpak, Nucl. Instrum. Methods A 376, 29-35 (1996) [10] S. Andriamonje et al. (The n_TOF Collaboration),
Journal of the Korean Physical Society 59, No 2, 1597-1600 (2011)
[11] A. Ferrari et al., CERN-2005-010 (2005)
[12] T.T. Böhlen et al., Nucl. Data Sheets 120, 211 (2014) [13] K.-H. Schmidt et al., NEA/DB/DOC(2014)1, OECD
(2014)
[14] L. Waters et al., AIP Conf. Proc. 896, 91 (2007) [15] M. Diakaki et al., Eur. Phys. J. A (2013) 49:62 [16] L. Waters et al., AIP Conf. Proc. 896, 81 (2007) [17] E. Birgersson and G. Loevestam , Technical Report,
EUR 23794 EN (European Commission, 2009) [18] J. Ziegler, SRIM 2013, www.srim.org
[19] A. Stamatopoulos et al., Eur. Phys. J. A (2018) 54:7 [20] N. Otuka et al., Nucl. Data Sheets 148, 1 (2018) [21] D.A. Brown et al., Nucl. Data Sheets 120, 272 (2014) [22] JEFF-3.3: Evaluated Data Library 2017,
http://www.oecd-nea.org/dbdata/jeff/jeff33/ [23] K. Shibata et al., Nucl. Sci. Tech. 48, 1 (2011) [24] Z. Ge et al., J. Korean Phys. Soc. 59, 1052 (2011)