HAL Id: hal-01757257
https://hal.laas.fr/hal-01757257
Submitted on 3 Apr 2018
HAL is a multi-disciplinary open access
archive for the deposit and dissemination of
sci-entific research documents, whether they are
pub-lished or not. The documents may come from
teaching and research institutions in France or
abroad, or from public or private research centers.
L’archive ouverte pluridisciplinaire HAL, est
destinée au dépôt et à la diffusion de documents
scientifiques de niveau recherche, publiés ou non,
émanant des établissements d’enseignement et de
recherche français ou étrangers, des laboratoires
publics ou privés.
Temperature Modulation
Aymen Sendi, Grérory Besnard, Philippe Menini, Chabane Talhi, Frédéric
Blanc, Bernard Franc, Myrtil L. Kahn, Katia Fajerwerg, Pierre Fau
To cite this version:
Aymen Sendi, Grérory Besnard, Philippe Menini, Chabane Talhi, Frédéric Blanc, et al.. Sub-ppm
Nitrogen Dioxide (NO 2 ) Sensor Based on Inkjet Printed CuO on Microhotplate with a Pulsed
Temperature Modulation. The Third International Conference on Advances in Sensors, Actuators,
Metering and Sensing (ALLSENSORS 2018), IARIA, Mar 2018, Rome, Italy. 5p. �hal-01757257�
Sub-ppm Nitrogen Dioxide (NO
2) Sensor Based on Inkjet Printed CuO on
Microhotplate with a Pulsed Temperature Modulation
Aymen Sendi, Grérory Besnard, Philippe Menini, Chaabane Talhi, Frédéric Blanc, and Bernard Franc Laboratoire d’Analyse et d’Architecture des Systèmes
LAAS-CNRS, University of Toulouse 7 Avenue du Colonel Roche
Toulouse, France
E-mail: {aymen.sendi, gbesnard, menini, talhi, blanc, bfranc}@laas.fr Myrtil Kahn, Katia Fajerwerg, and Pierre Fau
Laboratoire de Chimie de Coordination LCC-CNRS, University of Toulouse
205 Route de Narbonne Toulouse, France
E-mail: {myrtil.kahn, katia.fajerwerg, pierre.fau}@lcc-toulouse.fr
Abstract— Nitrogen dioxide (NO2), a toxic oxidizing gas, is
considered among the main pollutants found in atmosphere and indoor air as well. Since long-term or short-term exposure to this gas is deleterious for human health, its detection is an urgent need that requires the development of efficient and cost effective methods and techniques. In this context, copper oxide (CuO) is a good candidate that is sensitive and selective for NO2 at sub-ppm concentrations. In this work, CuO
nanoparticles have been deposited by inkjet printing technology on a micro hotplate that can be operated up to 500°C at low power consumption (55 mW). The optimum detection capacity is obtained thanks to a temperature modulation (two -consecutive temperature steps from 100°C to 500°C), where the sensing resistance is measured. Thanks to this operating mode, we report in this study a very simple method for data processing and exploitation in order to obtain a good selectivity for the nitrogen dioxide over few interferent gases. Only four parameters from the sensor response allow us to make an efficient discrimination between individual or mixed gases in humid atmosphere.
Keywords- NO2; CuO nanoparticles; temperature modulation;
gas sensor; selectivity.
I. INTRODUCTION
Humans spend more than 90% of their time in closed environments, even though this indoor environment offers a wide variety of pollutants [1][2].
Indoor air pollution is a real health threat, so measuring indoor air quality is important for protecting the health from chemical and gaseous contaminants. Nitrogen dioxide (NO2)
is a dangerous pulmonary irritant [1]. NO2 is generated by
multiple sources of combustion in indoor air, such as smoking and heaters, but it also comes from outside air (industrial sources, road traffic) [3]. NO2may have adverse
effects of shortness of breath, asthma attacks and bronchial obstructions [4]. It is also classified as toxic by the
“International Agency for Research on Cancer (IARC)” [5], hence the necessity for sensor development for accurate NO2detection is an acute need. Among sensors techniques,
the metal oxide gas (MOX) sensors are promising candidates because of their high performance in terms of sensitivity on top of their low production cost. The copper oxide (CuO) material is highly studied because of its high sensitivity and its ability to detect oxidant gaseous compounds, but also for other indoor air pollutants, such as acetaldehyde (C2H4O), formaldehyde (CH2O), NO2, CO,
etc. However, CuO suffers from a major disadvantage which is the lack of selectivity with respect to targeted gas.
In this study, our main objective is to develop an innovative and simple pulsed- temperature operating mode associated with an efficient data processing technique, which enables good selectivity toward NO2in gas mixtures.
This technique is based on few parameters extracted from the dynamic response of sensor versus temperature changes in a gaseous environment. These parameters are: the normalized sensing resistance, the values of the slope at the origin, the intermediate slope and the final slope of the response of NO2 against different reference gases, such as
C2H4O, CH2O and moist air. The selectivity of NO2 was
examined in relation to air moisture with 30% humidity, C2H4O at 0.5-ppm, CH2O at a concentration of 0.5-ppm and
the binary mixture of these gases with 0.3-ppm of each. In Section II of the paper, we describe the materials and methods used in our work. Section III presents our results and the discussion. We conclude this work in Section IV.
II. MATERIALS ANDMETHODS
The sensitive layer made of CuO nanoparticles is deposited by inkjet printing on a silicon microhotplate [6]. The ink is prepared with 5% CuO weight, which was dispersed in ethylene glycol by an ultrasonic bath for about one hour. The dispersions obtained were allowed to settle
for 24 hours. The final ink was collected and then used for printing using Altadrop equipment control, where the numbers of the deposited drops of ink were controlled [6]. This technique is simple and allowed us to obtain reproducible layers thicknesses of a few micrometers depending on the number of deposited drops. In addition, this technique permits to have a precisely localized deposit without need of additional complex photolithographic steps [7]. The CuO layer is finally annealed in ambient air from room temperature to 500°C (rate 1°C/min) followed by a plateau at 500°C for 1 hour before cooling to room temperature (1°C/min). This initial temperature treatment is necessary because CuO requires operating temperatures between 100°C<T<500°C. The thermal pretreatment is necessary to generate ionized oxygen species in atomic or molecular form at the oxide surface and therefore to improve the reactivity between the reacting gas and the sensor surface [6].
In this study, we have used a pulsed temperature profile, presented in a previously published work, which showed that optimized sensitivity can be achieved with the use of two different temperature stages at 100°C and 500°C respectively. This dual temperature protocol also reduces the total power consumption of the device (see Figure 1).
Figure 1. CuO temperature profile.
The CuO sensor was placed in a 250 ml test chamber and the test conditions were as follow:
- A flow rate of 200 ml/min, controlled by a digital flowmeter.
- A relative humidity (RH) level of 30% is obtained by bubbling synthetic air flow controlled by a mass flow controller.
- The measuring chamber is at ambient temperature, controlled by a temperature sensor placed inside the vessel. - A bias current is applied to the sensitive layer, controlled by a Source Measure Unit (SMU).
We started a test with single gas injections after a phase of two-hours stabilization in humid air, then with injections of binary mixtures for 16-min. During 32-min, moist air is injected between two successive gas injections. This time is enough to clean the chamber and stabilize the sensor to its baseline.
The gas injections concentrations are summarized in Table 1. A schematic representation of these injections is presented in Figure 2.
TABLE 1. INJECTED GASES CONCENTRATIONS
Gas Concentration
Acetaldehyde (C2H4O) 0.5-ppm
Formaldehyde (CH2O) 0.5-ppm
Nitrogen dioxide (NO2) 0.5-ppm
Acetaldehyde and Formaldehyde (C2H4O/ CH2O)
0.3-ppm/0.3-ppm Acetaldehyde and Nitrogen
dioxide (C2H2O/ NO2)
0.3-ppm/0.3-ppm Formaldehyde and Nitrogen
dioxide (CH2O/ NO2)
0.3-ppm/0.3-ppm
Figure 2. Synoptic representative of a sequence of gas injections. During all the experience (stabilization phase, gases injections and stage between two successive gases) , the sensor is powered by a square signal voltage applied on the heater in order to obtain two temperature steps as shown in Figure 1. To ensure a constant overall flow, we adapted the gas injection sequences duration in correlation with the heating signal period (see Figure 3).
The resistance variation of CuO is measured under a fixed supply current of 100 nA in order to obtain voltage measurements in the range of few volts, far from compliance limit of the measuring device (20V). We also verified that this procedure (temperature cycling) doesn’t affect the sensor reproducibility in terms of baseline or the sensor sensitivity.
Under such test conditions, we achieved a continuous 6.5 hours testing period without observing any drift on the raw sensor response. The sampling period is 500 ms, which gives us 60 points on a 30-second response step, this acquisition rate being enough for accurate data processing.
Finally, we analyzed the sensor responses at each steps, according to the different gas injections, using a simple method of data processing in order to have the better selectivity of NO2.
III. RESULTS AND DISCUSSION
A. Method of analysis
During each gas injection, 16 periods of temperature modulation are applied. After verifying the reproducibility of sensor responses along these cycles, we only present here the responses of the last cycle, which is stabilized and reproducible from one cycle to another. As mentioned previously, we used new simple data treatment methods to obtain the better selectivity toward NO2 with respect to
several interferent gases. Among the multiple possible criteria, we chose representative variables that take into account the dynamic sensor behavior during a change of gaseous conditions and during a pulsed temperature; these criteria are obtained from the sensor resistance slopes during the gas response on each 30-second-steps. The data acquisition relies on the decomposition of the response into three distinct domains (see Figure 4):
- Starting Slope: from the 1st point to the 10th point (in yellow),
- Intermediate slope: from the 10th point to the 30th point (in red),
- Final slope: from the 30th point to the 60th point (in black).
The normalized resistance is measured from the last point on each step: this is the absolute difference between the resistance of the sensor under a reference gas (like moist air) and the resistance of the sensor under targeted gas(es), at the final cycle of each injection:
Rn= ((Rgas-Rair) / Rair) * 100 (1)
Figure 4. Representative diagram of a response of a gas sensor during an injection cycle and showing the 3 domain slopes.
By treating these four parameters, a good selectivity of NO2can be obtained with respect to moist air, C2H4O and
CH2O.
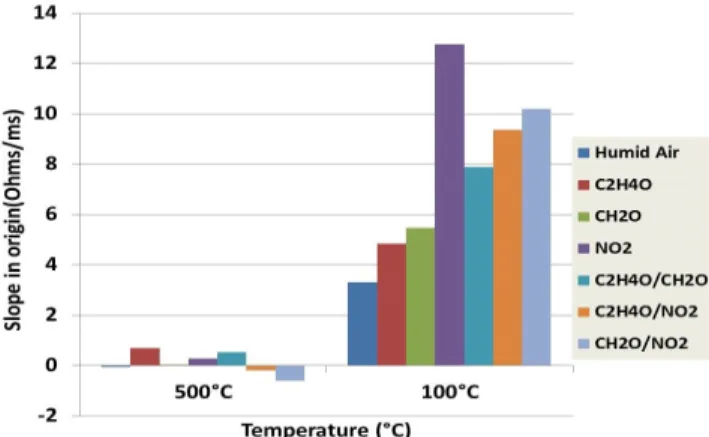
B. Slope at the origin
The slope at the origin is calculated on the first 10 points of each temperature step of the 8th cycle of each injection. Regarding the reference gas (moist air); we took the response of the 8th cycle of the last sequence under humid air before the injection of gases. The values of these slopes (in Ohms/ms) are shown in Figure 5; each bar represents the value of the slope at the origin of each gas at 500 and 100°C.
Figure 5. Representation of the slopes at the origin under different gases of the 8th cycle in “Ohms/ms” according to the temperature of the
sensors.
Figure 5 clearly shows that the calculations of this parameter enable us to differentiate NO2 from the other
reference gases by measures on the plateau at 100°C. Regarding the other step at 500°C we note that the response is almost zero, because the transition from a cold to a hot state decreases the detection sensitivity and therefore reduces the sensors resistance variations under gas. We also note that with this criterion we evidence a significant difference between the value of the starting slope under NO2compare
to others under other gases and mixtures without NO2.
C. Intermediate slope
The intermediate slope is calculated from the 10th point to the 30th point of each temperature step of the last cycle during each gas injection and compared with the value under air. The calculated values are shown in Figure 6.
Figure 6. Representation of the intermediate slopes under different gases at the 8th cycle in “Ohms/ms” according to the temperature of the
According to Figure 6, the value of the intermediate slope of individual NO2injection or of the gas mixtures in which
there is NO2, is not prominent compared with the other
reference gases even on the plateau at 100°C. This parameter is less effective than the previous one to detect NO2in gas
mixtures.
D. Final slope
The final slope is the slope of the second half of the gas response; it is calculated between the 30th point and the 60th point. The response to the different temperature steps of the last cycle during NO2 injection and the reference gases is
presented in Figure 7.
Figure 7. Representation of the final slopes under different gases at the 8th cycle in “Ohms/ms” according to the temperature of the sensors. It is worth noting that the value of the final slopes of NO2
or gaseous mixtures, which contain the NO2, are very
different compared to the other reference gases on the two stages at 100°C only. This parameter allows us to select NO2
with respect to other interfering gases.
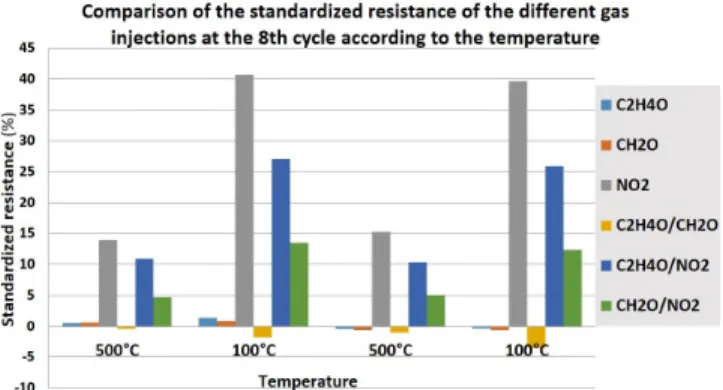
E. Normalized resistance
As previously presented, the normalized resistance is calculated with respect to humid air from each last cycle level. The reference resistance used is the resistance of each stage of the last wet air sequence before the gas injection. The results obtained from these calculations are shown in Figure 8.
Figure 8. The normalized resistance of the different gas injections at the 8th cycle according to the temperature.
Figure 8 shows a slight variation in the values of the normalized resistance between two similar and successive temperatures for the same gases. This slight variation can be explained by data dispersion which is +/- 2%, due to the fact that the normalized resistance is calculated from the raw values during the gas injection and the raw values of resistances during the injections of humid air that may be slightly different between two similar and successive temperature stages.
The CuO sensor response to sub-ppm NO2 levels when
injected individually or in combination with another gas, is specific when measurements are taken on the low temperature plateau at 100°C.
IV. CONCLUSION
The selectivity and sensitivity of our CuO sensor has been studied by different operating modes and simple methods of analysis. Specific temperature modulation was applied to the metal oxide with the use of temperature steps at 500 and 100°C. The response of CuO sensitive layer toward gases representatives of indoor air pollution (C2H4O,
CH2O, NO2, humid air) has been studied. These responses
were analysed with several parameters, such as the study of the slope of resistance variation at the origin, the intermediate slope, the final slope and the normalized resistance measured at each temperature steps. The study of these different parameters shows that the CuO material is able to detect sub-ppm levels of NO2with a good selectivity
compared to different interfering gases. To still improve the selectivity of gas sensor device to a larger variety of polluting gases, we plan to integrate these CuO sensors in a multichip system, which will allow us to use in parallel new metal oxide layers with specific temperature profiles and data analysis criteria.
ACKNOWLEDGMENT
The authors express their gratitude to neOCampus, the university project of the Paul Sabatier University of Toulouse, for the financial support and the Chemical Coordination Laboratory of Toulouse for the preparation of the CuO nanoparticle powder. This work was also partly supported by the French RENATECH network.
REFERENCES
[1] B. Lévesque et al. P-L. Auger, J Bourbeau, J-F. Duchesne, P. Lajoie, D. Menzies, “Indoor air quality,” Environment and Public Health. Foundations and Practices, pp. 317-332.2003.
[2] J. Namiesnik, T. Gorecki, B. Kozdron-Zabiega, and J. Lukasiak, “Indoor air quality (IAQ),”. Pollutants, their sources, and concentration levels. Build. Environ. 27. 1992. pp. 339-356.
[3] Roger Cadiergues, “Indoor air quality,” Guide RefCad: nR15.a. pp. 16-17. 2017.
[4] K.Koistinen et al.
D. Kotzias, S. Kephalopoulos, C. Schlitt, P. Carrer,
M. Jantunen, S. Kirchner, J. McLaughlin, L. Mølhave, E. Fernandes, B. Seifert, “The INDEX project: executive
summary of a European Union project on indoor air pollutants Allergy,” 63. 2008. pp. 810-819.
[5] D Loomis, W Huang, and G Chen, “The International Agency for Research on Cancer (IARC) evaluation of the carcinogenicity of outdoor air pollution: focus on China,”
Chin J Cancer. 2014 Apr;33(4):189-96. doi:
10.5732/cjc.014.10028.
[6] N. Dufour, A. Chapelle, F. Mesnilgrente, V. Conedera, and Ph. Menini, “Technological improvements of a metal oxide gas multi-sensor based on a micro-hotplate structure and
inkjet deposition for an automotive air quality sensor application,” 25th Micromechanics and Microsystems Europe workshop. MME 2014. Aug-2014. Istanbul, Turkey.4p.
[7] M. Morozova et al. P. Kluson, J. Krysa, P. Dzik, M. Vesely, O. Solcova, “Thin TiO2 films prepared by inkjet printing of the reverse micelles sol–gel composition,” Sensors and Actuators B 160. 2011.