PSFC/RR-06-4
Development of an Experiment to Study the Effects of
Transverse Stress on the Critical Current of a
Niobium-Tin Superconducting Cable
Luisa Chiesa
February, 2006
Plasma Science and Fusion Center Massachusetts Institute of Technology
Cambridge MA 02139 USA
This work was supported by the U.S. Department of Energy, Grant No. DE-FC02-93ER54186. Reproduction, translation, publication, use and disposal, in whole or in part, by or for the United States government is permitted.
DEVELOPMENT OF AN EXPERIMENT TO STUDY THE EFFECTS OF TRANSVERSE STRESS ON THE CRITICAL CURRENT OF A NIOBIUM-TIN
SUPERCONDUCTING CABLE
By Luisa Chiesa
Submitted to the Department of Nuclear Science and Engineering in Partial Fulfillment of the Requirements for the Degree of
Master of Science in Nuclear Science and Engineering at the
Massachusetts Institute of Technology February 2006
© 2006 Massachusetts Institute of Technology All right reserved
Signature of Author
Department of Nuclear Science and Engineering January 10, 2006 Certified by
Joseph V. Minervini Senior Research Engineer, MIT Plasma Science and Fusion Center Nuclear Science and Engineering Department Thesis Supervisor Certified by
Jeffrey P. Freidberg Professor of Nuclear Science and Engineering Thesis Reader Accepted by
Jeffrey A. Coderre Associate Professor of Nuclear Science and Engineering Chairman, Department Committee on Graduate Students
DEVELOPMENT OF AN EXPERIMENT TO STUDY THE EFFECTS OF TRANSVERSE STRESS ON THE CRITICAL CURRENT OF A NIOBIUM-TIN SUPERCONDUCTING CABLE
by Luisa Chiesa
Submitted to the Department of Nuclear Science and Engineering in February 2006
in Partial Fulfillment of the Requirements for the Degree of Master of Science in Nuclear Science and Engineering
ABSTRACT
Superconducting magnets will play a central role for the success of the International Thermonuclear Experimental Reactor (ITER). ITER is a current driven plasma experiment that could set a milestone towards the demonstration of fusion as a source of energy in the future.
Cable-in-Conduit is the typical geometry for the conductor employed in superconducting magnets for fusion application. The cable is composed of over 800 strands. Once energized, the magnets produce an enormous electromagnetic force defined by the product of the current and the magnetic field. The strands move under the effect of this force, and the force accumulates against one side of the conduit thereby pressing transversally against the strands.
The experiment proposed here has the goal of assessing the functionality of the apparatus designed to study the effect of transverse load on a cable composed of 36 superconducting strands (with a 3x3x4 pattern) by mechanically simulating the ITER Lorentz stress condition.
The apparatus was assembled at MIT and preliminary tests at 77 K and room temperature were made to improve the design prior to carrying out the actual experiments. These were done at the National High Magnetic Field Laboratory (NHMFL) located in Florida. Ideally, the transverse conditions simulating the ITER conditions should be created by Lorentz forces due to current and magnetic field. Unfortunately to create such a high level of stress, currents higher than the power supply capability at NHMFL (10 kA) would be required. This is the driving reason to have an apparatus simulating the same stress condition mechanically.
The first test was conducted in October 2005. It was possible to test the structure and its range of operation. Critical current measurements were made as a function of different fields. However during the first measurement, under the loading conditions, the sample was irreversibly damaged and no other measurements were possible.
The successful test of the structural behavior of the apparatus motivated a second test carried out in January 2006. With the improvements made between the two experiments, it was possible to successfully measure the degradation of the cable as a function of the
transverse pressure applied, measuring degradation as high as 50% with a transverse load of 100 MPa.
The ultimate goal of these studies is to characterize the critical current behavior as a function of transverse load in order to predict the response of a full sized Cable-in-Conduit. The work in this thesis was used to explore a setup for measurements and measurement technique. A set of empirical equations describing the behavior of full size cables is needed and should be addressed with a new project that extends the work done so far.
Luisa Chiesa
Thesis Supervisor: Dr. Joseph V. Minervini
Title: PSFC Technology and Engineering Division Head
Thesis Reader: Dr. Jeffrey P. Freidberg
ACKNOWLEDGEMENTS
I would like to express my deep gratitude to my supervisor Dr. Joseph Minervini, to his constant support and for being always so positive under any circumstance (also when asking money again and again and again for the experiment).
Thanks to Prof. Jeff Friedberg and the patience in reading this thesis despite being so experimental oriented.
A very special thank to the Master, Dr. Makoto-San Takayasu. I learned many things working next to him…what it is possible but more so what it is impossible and it will never work…just kidding. He is a very patient man who always finds time to explain things and never gets tired of looking for things to improve to have a successful experiment. Arigato gozaimasu Makoto!!! In exchange he learned how to confuse right and left from me. Fair exchange I believe.
Another very special thank to Dave Tracey and his smiling face any time I asked him to modify things for the second…third time. Without his technical skills and his contribution I would not be here writing acknowledgements.
Again to Valery Fishman and his great help in preparing the drawing package and explaining me what M6-1 means and how to consult a machinery catalogue.
Thank to Dr. Chen-Yu Gung and his help in the experimental set up and all the work done to prepare the furnace for heat treatment.
Another thank to Peter Stahle because he had the patience to explain the basic of mechanical engineering especially because he is not even part of our group but he helped us whenever possible. I bet he never amused himself so much about my ignorance on screws size and inches.
Thank to everyone in the group especially Peter Titus and his ANSYS expertise, Phil Michael for his precious comments during the design and experimental phase, Darlene Marble for the constant assistance and Dave Harris for his help and support.
A portion of this work was performed at the National High Magnetic Field Laboratory, which is supported by NSF Cooperative Agreement No. DMR-0084173, by the State of Florida, and by the DOE. Many thanks to all the people that helped us with the experiment at the NHMFL facility.
Thanks to my family, my mum and dad and my wonderful brother.
Thanks to all my special friends in Boston. My parents are really grateful to you because you all took the burden of being next to me during exams and experiment preparation. Thanks Antonio and the wonderful chats and coffees, Chudi and his never ending support in any circumstances, Ksusha for her friendship, chats and company, Matteo because he lets me sing in the office, Jen, Matt for being wonderful roommates, Greg for the great hikes in the Whites, Darwin for always listening with patience.
Also thanks to all the special friends far away… Michela because she is a wonderful, truthful and sincere friend, Paolo, Jackie and their support and advice from the other side of the country, Peter, Shlomo, Silvia, Francesca, Alessandra, Marco, Daniela, Cristian, Rainer, Gianni, Carrie, Federico, Giovanni, Rocco, Keshini, Sejal and her support during my first year at MIT and her being always present, Chris and whomever I forgot…
INDEX
Title Page 1 Abstract 3 Acknowledgements 5 Index 6 List of Figures 8 List of Tables 15 Glossary 16 Chapter 1: Introduction 17 1.1 Background of Superconductivity 17 1.2 Superconductivity Application 261.3 Magnet types and Cable-in-Conduit Conductor 27
1.4 ITER and fusion energy 30
1.5 Scope of thesis 32
Chapter 2: Strain characteristics of superconducting wires and cable 34
2.1 Introduction 34
2.2 Axial strain effect 35
2.2.1 Single strand in uniaxial strain 38
2.1.2 Single strand under pinching and bending loads 40
2.1.3 Tests of sub-size cables under axial strain 43
2.3 Transverse strain effect 47
2.3.1 Single strand under transverse load 47
2.3.2 Tests on sub-sized cables under transverse load 52
2.4 Motivation for further investigations and challenges 55
Chapter 3: Description of the experiment and the FEM model 57
3.1 Introduction 57
3.2 Cable Design 57
3.3 Structure Design 62
3.3.1 Parts description 62
3.3.2 Strain requirements 68
3.4 Electromagnetic and Mechanical forces 70
3.4.1 Radial electromagnetic force and dewar tail stress calculations 70
3.4.2 Mechanical and structural forces 73
3.4.2.1 Rotational method 73
3.4.2.2 Linear Actuator method 77
Chapter 4: Experimental results and discussions 88
4.1 Introduction 88
4.2 Measurement technique 88
4.3 Preliminary tests done at MIT 91
4.4 Test Facility at NHFML 98
4.5 Results of the first experiment campaign 104
4.6 Further tests performed at MIT after the test at NHMFL 118
4.7 Helium consumption 125
4.8 Changes made after the first experiment 126
4.9 Preliminary results for the second test campaign 128
4.10 Remarks and conclusions 132
Appendix I: Drawings 135
Appendix II: Cabling machine 163
II.1 Machine Description 163
II.2 Typical operation to make a cable 166
II.3 Summary 176
Appendix III: Pictures 179
III.1 Cabling 179
III.2 Parts and Assembly of the first sample 180
III.3 After heat treatment and mounting of strain gages 185
III.4 Experiment of the first sample 188
List of Figures
Chapter 1Fig. 1 Critical surface for superconducting materials. 18
Fig. 2 (a) Critical surface for NbTi, 18
(b) Critical current dependence on axial strain for Nb3Sn strands. 19
Fig. 3 Critical field as a function of temperature for Type I and II superconductors. 19
Fig. 4 Normal cores representation in a Type II superconductors slab. Surface currents flow to maintain the bulk of the slab diamagnetic. 20
Fig. 5 Properties of normal cores in a Type II superconductor [1.5]. 20
Fig. 6 Normal cores and pinning centers in a Type II superconductors. 21
Fig. 7 Critical field as a function of temperature for selected LTS, HTS superconductors. 23
Fig. 8 Critical current density at 4.2 K for different superconducting materials candidates for magnet design. 24
Fig. 9 Cross section of the cable used for ITER. 25
Fig. 10 (a) Rutherford cable used for adiabatic magnets. 27
Fig. 10 (b) NbTi Impregnated coil used in one of the LHC quadrupoles. 28
Fig. 10 (c) Nb3Sn racetrack coil impregnated with epoxy showing some voids after impregnation. 28
Fig. 11 (a) Multiple stage CICC for ITER (3x3x4x4x6). (b) Cut-out of a superconducting cable. 29
Fig. 12 Cut-away of ITER and the magnets system of the machine. 30
Fig. 13 Central Solenoid stack up and CICC used for the coils winding. 31
Fig. 14 Lorentz force due to electromagnetic interaction of current and field in a CICC cable. 32
Fig. 15 (a) Schematic view of the device, (b) pressure pattern applied to the cable (top view). 33
Chapter 2 Fig. 1 Critical current measurements for Nb3Sn cable used in our device. 35
Fig. 2 U-spring strain device. 38
Fig. 3 Pacman strain device. 39
Fig. 4 The Walters Springs (WASP) device. 39
Fig. 5 TARSIS experiment setup. 40
Fig. 6 Fixed bending strain behavior strand configuration. 41
Fig. 7 Maximum bending applied to the support beam at room temperature during preliminary setup. 41
Fig. 8 Pure bending device components. 42
Fig. 9 (a) Schematic of pull test setup. (b) Ratio of critical current to maximum critical current as a function of strain at 4.2K, 12T. (c) Pull test conductor sample prepared for testing. 44
Fig.10 (a) Test setup.
(b) Critical current as a function of magnetic field for different sample. (c) Typical strain behavior for a single strand at 13T.
(d) Strain measurement for the braid subcable. 45
Fig.11 (a) Critical current as a function of magnetic field with no strain applied. (b) Ratio of critical current to maximum critical current as a function of strain at 4.2K, 12T for different samples. 46
Fig. 12 (a) Field dependence of critical current without applied strain for CICC with SS or Ti jacket. (b) Critical current as a function of strain for Nb3Sn conductors containing different internal reinforcement. 47
Fig.13 (a) Schematic view of test setup. (b) Cross section of the two samples used (round and flat). (c) Critical current degradation for transverse and axial compressive stress for ROUND sample. (d) Critical current degradation for transverse and axial compressive stress for FLAT sample. 49
Fig.14 (a) Test setup. (b) Normalized critical current as a function of transverse compression (σt) and axial tension (σa). 50
Fig.15 (a) Cross section of bronze process wire. (b) Cross section of internal tin wire. (c) Critical current degradation as a function of transverse stress and magnetic field for the two different samples. 51
Fig.16 (a) Test setup of crossover effect. (b) Critical current degradation as a function of transverse stress and magnetic field for uniform and cross over stress. 52
Fig.17 Sample arrangement within the test magnet and the transverse load cage. 53
Fig.18 (a) Critical current degradation as a function of transverse stress for the CICC tested. Also plotted the single strand behavior normalized at 12T. (b) Cross section of a 40% void fraction CICC before and after loading. 54
Chapter 3 Fig. 1 Critical currents for a 36 strands cable as a function of field and at constant pressure levels. 58
Fig. 2 (a) Cable ready to be mounted. Voltage taps wires are visible (b) “Sewing” the stainless steel wire for voltage tap. 59
(c) Another view of the cable and the voltage tap wound around it. 60
Fig. 3 Copper terminations soldered to the current leads connection. 60
Fig. 4 Heat treatment schedule for the Nb3Sn sample. 61
Fig. 5 (b) Cross section of the probe head structure used for the experiment. 63
Fig. 6 (a) Structure seen from the bottom. The cable is between the Incoloy 908® ring and the expanding collet. (b) Detail of the expanding collet and the cable enclosed. 64
(c) Stainless steel cone used during heat treatment to maintain the proper void fraction of the cable. (d) Cable mounted and detail about how the cable comes out of the structure. (e) Sample and structure ready before heat treatment. 65
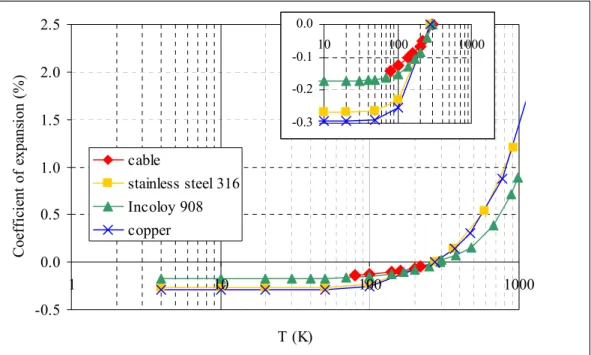
Fig. 7 COE as a function of temperature for different materials used in the experiment. 67
Fig. 8 Strain gages mounted on the Incoloy 908® rings. 68
Fig. 9 Stress dependence of single Nb3Sn strand. Strands are much more sensitive to transverse stress. 68
Fig. 10 Critical current variation as a function of uni-axial longitudinal strain applied. 69 Fig. 11 Sources of radial electromagnetic force: missing section of the cable and joint area where the sample is soldered to the copper current leads. 70
Fig. 12 Summary of radial electromagnetic force effect. 71
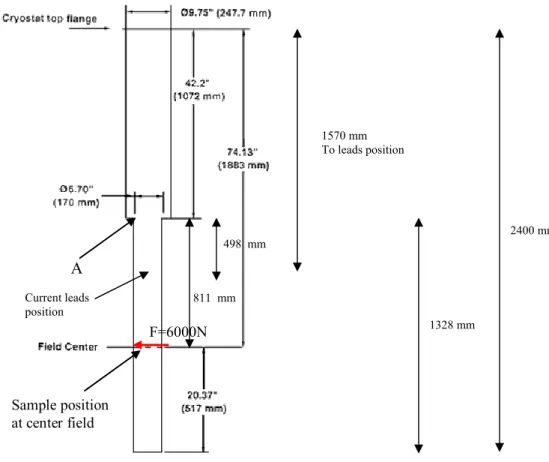
Fig. 13 Dewar’s schematic with the position of the cable and where the stress was estimated. 72
Fig. 14 (a) Three major sources of friction: threaded brass and nut (CSX-007/CSX-017), nut and brass halves (CSX-017/CSX-011), brass cone and expanding collet (CSX-007/CSX-005). (b) Estimation of the vertical force required to produce 10 MPa on the cable. 74
Fig. 15 (a) Torque created by the first term of Eq. 6 for different friction coefficients (µ) as a function of the friction coefficient between brass conical wedge (CSX-007) and expanding collet (CSX-005). (b) Torque created by the second term of Eq. 6 for different friction coefficients (µc) as a function of the friction coefficient between brass conical wedge (CSX-007) and expanding collet (CSX-005). 76
Fig. 16 Linear actuator and support structure sitting before mounting on the top flange and mounted on top of the dewar with the probe attached to the current leads. 77
Fig. 17 Connector pieces: load cell position and ¾” high strength threaded rod. 78
Fig. 18 (a) 2D geometry and constraints applied, (b) 3D expansion of the model. 79
Fig. 19 Expansion of the 2D model. 80
Fig. 20 Lines defining the different pieces of the model. 81
Fig. 21 Results of Ansys simulation at step 40. 82
Fig. 22 Close up to the cable and Incoloy 908® rings at step 40 of the analysis. 83
Fig. 23 (a) y and z strain in the cable, (b) y and z strain in the Incoloy 908® rings, 84
(c) close up to the strain on the Incoloy 908® ring hosting the cable, (d) z strain distribution in the Incoloy 908® ring when the friction coefficients between the two rings is 0.7. 85
Fig. 24 Strain gages patter used during the test. 86
Fig. 25 Expected values of axial and hoop strain on the Incoloy 908® ring and their relation with the transverse pressure on the cable. 87
Fig. 26 Expected values of hoop strain on the Incoloy 908® ring (ANSYS® simulation)
compared with measurements taken with the strain gages. 87
Chapter 4 Fig. 1 Schematic view of voltage taps on the cable. 88
Fig. 2 Strain gage pattern for the gages used in the experiment. 89
Fig. 3 Strain gage installation setup (left) and at the end of curing cycle (right). 90
Fig. 4 Strain gage circuit. Inside the box four identical circuits are wired. 90
Fig. 5 Room temperature setup: assembled pieces (left), strain gage (right), exploded view of the assembly (bottom). 91
Fig. 6 Hoop strain results and comparison with ANSYS® simulations. 92
Fig. 7 Axial strain results and comparison with ANSYS® simulations. 93
Fig. 8 (a) Rotating knob and shaft mounted for preliminary tests, (b) probe head and connection shaft-nut, (c) brass cone, its movement expands the collet and reduce the gap. 94
Fig. 9 (a) Experimental setup for the INSTRON test. The probe head is mounted upside down and the load is applied to the bottom area of the brass cone. (b) Gap reduction after the INSTRON test. 95
Fig. 10 Results of INSTRON test, strain gages and load as a function of time. 96
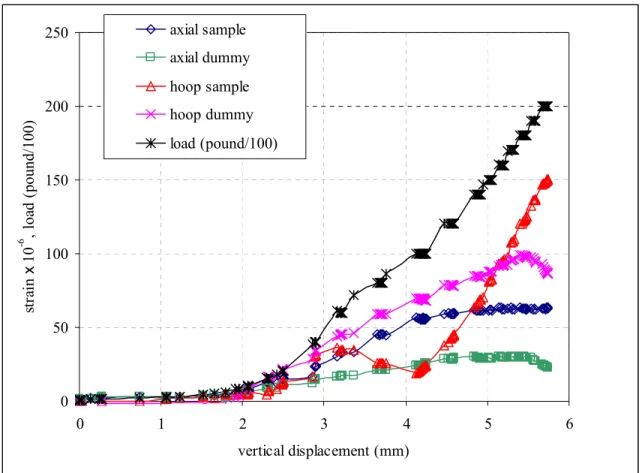
Fig. 11 Strain and load results as a function of the vertical displacement with the INSTRON machine. 97
Fig. 12 Circuit setup of the experiment at NHMFL. 98
Fig. 13 Variation as a function of axial coordinate z of the axial and radial components of the field evaluated at r = 0.056 m [4.1]. 99
Fig. 14 Restoring force acting on the Incoloy 908® rings. 100
Fig. 15 20 T solenoid at NHMFL (units mm). 100
Fig. 16 T solenoid and cryostat. 101
Fig. 17 Experiment setup. Data acquisition system and instrumentation used (top), current leads and position of water cooled resistors (bottom). 102
Fig. 18 Strain gages positions on the two Incoloy 908® ring and their typical wiring. 104
Fig. 19 Details of the probe before being inserted inside the dewar and positions of liquid level sensors. 106
Fig. 20 Voltage across the joints as a function of current. 107
Fig. 21 Voltage trace for voltage tap 1 at 4.2 K, 10 T. 108
Fig. 22 Measured values of critical current compared with estimate from single strand measurements (current cable = single strand value x 35 strands). 109
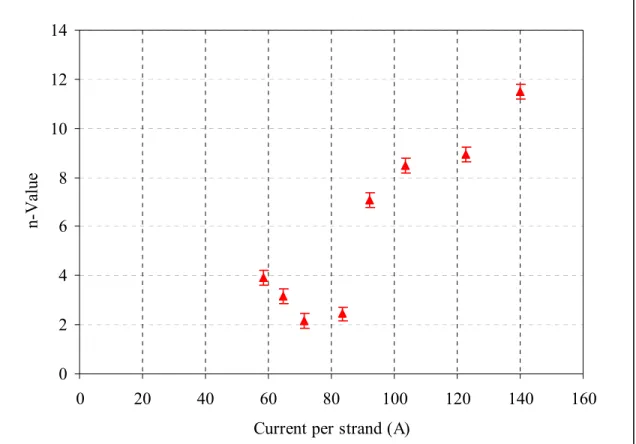
Fig. 23 Measured n-values as a function of the measured current per strand. 110
Fig. 24 Strain as a function of electromagnetic load at fixed field 10 T. 111
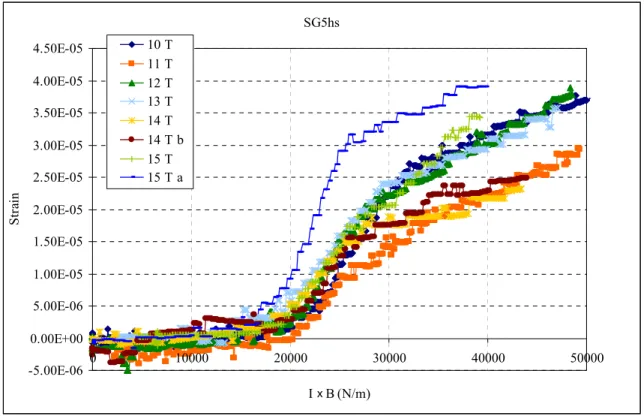
Fig. 25 Strain experienced by gage SG5hs during the measurements made at different fields. 112
Fig. 26 (a) Critical current measurements as a function of field for the three different loads. (b) n- values as a function of current per strand. 114
Fig. 27 (a) Different gages recorded at 10 T for the third load as a function of electromagnetic load.
(b) Voltage measurements of SG5hs for the different
measurements made. 115
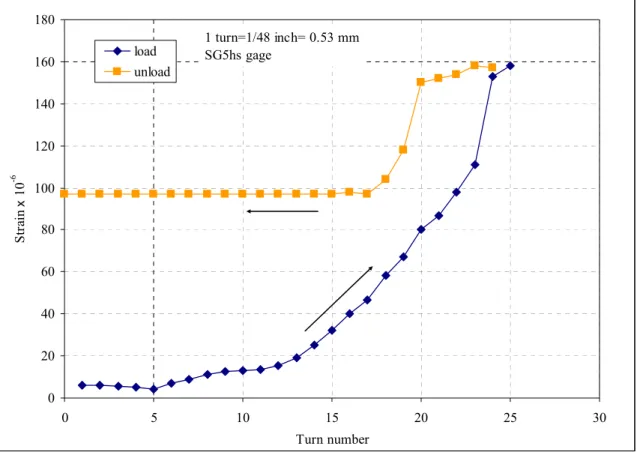
Fig. 28 Strain gages readings and their variation while applying load. 116 Fig. 29 SG5hs strain measurement as a function of turn number. 117 Fig. 30 Load (in kg) as a function of turn number. 119 Fig. 31 Strain gages as test setup as a function of vertical load during
loading and unloading. 120
Fig. 32 Strain gages as test setup as a function of vertical load during loading for same loading as Fig. 31 and after loosing up
the compressive force holding the structure together. 120 Fig. 33 Strain gages in position 3 during loading and unloading. 121 Fig. 34 Probe head before the test (top) and section of the cable severely
damaged during the test (bottom). 122 Fig. 35 Strain gages in position 3 and 4 as a function of the load. 123 Fig. 36 All hoop gages as a function of time. 124 Fig. 37 All hoop gages in the four different positions, as a function of load. 124 Fig. 38 Helium consumption as a function of time during the two days of test. 125 Fig. 39 Motor drive connected to the linear actuator during
the second test performed in January. 127 Fig. 40 Voltage taps and strain gages positions during the test. 128 Fig. 41 Critical current as a function of magnetic field for the two experiments performed and compared with the expected values calculated form single strand data. 128 Fig. 42 n-values as a function of current per strand for
the two different experiments. 129
Fig. 43 Critical currents normalized to the critical current at zero load, with a background field of 12 T, as a function of the transverse load. 130 Fig. 44 Strain gages signals as a function of transverse load and compared with the 2D ANSYS® model described in Chapter 3. 131
Fig. 45 Comparisons between the measurement taken during the experiment, single strand data taken by Ekin and
sub-sized measurements made by Summers and Miller. 132 Fig. 46 Modified expanding collet to apply a more uniform load on the cable. 133 Appendix II
Fig.1 shows the main components of the machine. 163 Fig. 2 Spinner with 6 spool capability and a single strand spool
mounted on the spinner. 164
Fig. 3 Traverser and torque controls and take up and torque switches. 165 Fig. 4 Ratio and speed controls (to the left) and stop-start operation buttons. 166 Fig. 5 Re-spooling station. The strand is re-spooled from a big spool to
Fig. 6 Strand location on the guide wheels which direct the strand towards
the cabling spool. 167
Fig. 7 (a) Traverser used to translate the strand guide wheels during spooling to produce uniform layers on the pay-off spool.
(b) Counter to measure the length of the strand/cable wound on the cabling spool (measured in feet)
(c) Speed and traverse controls. 168
Fig. 8 The copper leader helps to indicate a stop of the machine
once a spool is finished. 169 Fig. 9 (a) Device used to estimate the tension on the spool holder and
positioning of the spools on the machine. 170 Fig. 9 (b) Details for one of the shafts which support the spool
in the cabling machine. 171
Fig. 11 Other views of cabling operation. 172
Fig. 12 As the subcables become larger in diameter, pass through
the cabling die becomes increasingly difficult. 173 Fig. 13 Preparation of the connection between the 36 strands cable and
the triplet take-up leader at a point just after the cabling die. 174 Fig. 14 View of the connection between the 36 strands cable and the triplet
take-up leader as it approaches the first guide wheel. 174 Fig. 15 Measuring the twist pitch by inserting a piece of wire between
the higher cable stages. 175
Fig. 16 36-strand cable collected on the take-up spool. The triplet leader is
also visible to the left side of the take-up spool. 175 Appendix III
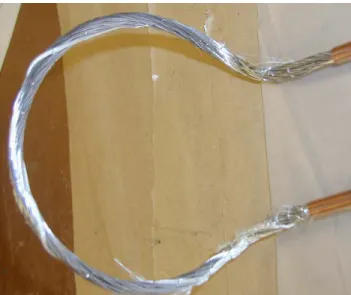
Fig. 1 36-strands cable ready after cabling. 179 Fig. 2 Nb3Sn cable inside groove of Incoloy 908® ring. 180
Fig. 3 Expanding collet with stainless steel cone used during heat treatment. 180
Fig. 4 Cable used for the experiment. 181
Fig. 5 Assembly of the first sample. 181 Fig. 6 Mounting of stainless steel “fingers” to enclose the cable between
Incoloy 908® ring and expanding collet. 182 Fig. 7 Stainless steel cone used to maintain void fraction of the cable to
the desired level during heat treatment. 182
Fig. 8 Structure ready for heat treatment. 183
Fig. 9 Sample and witness strand ready to be put in the oven for heat treatment. 184
Fig. 10 Sample area after heat treatment. 185
Fig. 11 Sample after heat treatment. Incoloy 908® looks more shiny that
stainless steel because it contains less chrome than stainless steel. 185 Fig. 12 Another view of the sample after heat treatment. 186
Fig. 13 Mounting setup for strain gages. 186 Fig. 14 Bottom gage after heat treatment of the glue used to attach
them to a surface. 187
Fig. 15 Strain gages after mounting and heat treatment. 187 Fig. 16 Dewar at NHFML while inserted in the bore of 20 T magnet. 188 Fig. 17 Probe before being inserted in the dewar
The tail of the probe is where the sample is located. 189 Fig. 18 Sample area with transfer line ad liquid level sensor mounted. 189 Fig. 19 Sample area with strain gages wires and Hall sensor. 190 Fig. 20 Sample area and wiring used during experiment
(strain gages and voltage taps). 190 Fig. 21 Linear actuator and connection box to connect linear actuator and
rod going to the sample. 191
Fig. 22 Probe ready to be inserted in the dewar. 191 Fig. 23 Relocation of the probe from wooden box to the dewar. 192 Fig. 24 Probe in the dewar. 10 kA current leads hooked to the top flange. 193 Fig. 25 10 kA current leads hooked to the top flange. 193
Fig. 26 Instrumentation setup. 194
Fig. 27 20 kA cables and water cooled resistor to improve the stability
of the voltage power supply. 194
Fig. 28 (a) Burned area of the sample.
(b) Burned area of the sample once removed from the dewar. 195 Fig. 29 Burned area of the sample. The sample partially melted on the right side. 196
List of Tables
Chapter 1Table 1 Critical temperatures and fields for Type I and II superconductors. 22 Chapter 3
Table 1 List of constrains considered during the design. 66 Table 2 Radial electromagnetic force due to cable and joints. 71 Chapter 4
Table 1 Instrumentations used during experiment. 101 Table 2 List of diagnostic mounted on the probe. 104 Table 3 Critical current measurements at zero mechanical load. 109 Table 4 Critical current measurements for three different loads. 113 Table 5 Different configuration of strain gages tests at room temperature. 118 Appendix II
Table 1 36 strands 3x3x4 measurements of twist pitch
Glossary of Terms
CIC Cable-in-Conduit
CICC Cable-in-Conduit Conductor
ITER International Thermonuclear Experimental Reactor CSMC Central Solenoid Model Coil
NET Next European Torus
J Current density
B Magnetic field intensity
T Temperature
Jc Critical current density
Bc Critical magnetic field
Tc Critical temperature
Bc1 Lower critical magnetic field
Bc2 Upper critical magnetic field
LTS Low Temperature Superconductors HTS High Temperature Superconductors MRI Magnetic Resonance Imaging NMR Nuclear Magnetic Resonance
V Voltage
Φ Magnetic flux
τ Pressure
F Force
I Current
dstrand Diameter of a strand
dcable Diameter of a cable
Ic Critical current
Icm Maximum critical current
Vc Critical voltage
Ec Critical electric field
n n-value of a superconductor
ε Strain
εm Maximum strain
εa Axial strain
COE Coefficient of expansion
SS Stainless steel σ Stress E Young modulus S Section modulus I Moment of inertia T Torque µ Friction coefficient
CHAPTER 1:
Introduction
Since its discovery in 1911, superconductivity has been playing an increasingly important role in different fields especially for magnet technology. The non-resistive characteristic of superconductor materials made them very attractive to achieve performances too demanding for conventional resistive materials. Even though superconductivity is a characteristic common to many metals, the engineering challenge is to obtain a material suitable for magnet design.
There are four key magnet issues to be considered in the context of balancing cost and difficulty of assembly:
• Stability against mechanical, electromagnetic, thermal or nuclear disturbances, • Cryogenics and efficiency of the coolant used,
• Protection of the conductor against events which would lead to a complete loss of superconductive properties (quench),
• Mechanical stability of the conductor and the supporting structure.
The principal characteristics of superconducting materials and their application with focus on magnets for fusion energy application are described in the following sections. In Section 1.1 a general background on superconductivity is given with a description of the critical state model. A list of superconductors available for magnets application will be given with focus on the type of strand and cable used for fusion magnet applications. In Section 1.2 the possible applications for superconductor materials are described. The following section (Section 1.3) describes the differences between magnets design for different applications. A general description of International Thermonuclear Experimental Reactor and the conductors used for the central solenoid is described in Section 1.4. Section 1.5 concludes the chapter with the motivations for this thesis work and the scientific interest of the project developed with this work.
1.1 Background of Superconductivity
A material is said to be superconductive if it shows virtually no resistance against the passage of current. This property is usually obtained by sufficiently lowering the temperature of the material. Many metals possess this property, but very few of them have all the characteristics suitable for magnet design. Superconductivity is determined by three properties that describe a surface under which the material does not show any resistance. These are current density, field and temperature. It has also been found that axial and transverse strains affect the material performance (discussed in more details in Chapter 2). If all but one of these properties are kept fixed, once the variable property reaches its critical value the superconductive behavior will be lost. A schematic representation of the critical surface for a superconducting material is shown in Fig. 1. In Fig. 2 NbTi critical surface and critical current dependence on axial strain for Nb3Sn are
Fig. 1 Critical surface for superconducting materials [1.1].
Fig. 2 (a) Critical surface for NbTi [1.2].
J (kA/mm2) T (K) B (T) (a)
f3(J,B,T0)
f2(J,T,B0)
f1(B,T,J=0
)
J
B
T
0)
)
Fig. 2 (b) Critical current dependence on axial strain for Nb3Sn strands [1.3].
Superconductors are said to be of Type I or II depending on their magnetic characteristics. As shown in Fig. 3, Type I superconductors have a single critical field (Bc1) above which the material loses its superconductive property. They show perfect
diamagnetism i.e. when an external field is applied to the material, it is expelled from the interior of the material. Their electrical behavior shows no resistance in both AC and DC conditions. Type II are bound by both a lower and upper critical fields (Bc1, Bc2). Above
Bc2 the material becomes normal, below Bc1 it shows perfect diamagnetism as for Type I
while in between the two limits the material is said to be in the mixed state.
Fig. 3 Critical field as a function of temperature for Type I and II superconductors [1.4]. field Bc2 Bc1 Tc temperature NORMAL STATE MIXED STATE
MEISSNER (type I)(Type I) (b)
The mixed state of a Type II superconductor can be pictured as a bulk of superconducting material with normal cores (Fig. 4).
The normal cores in the mixed state represent the areas of the material where the field can penetrate. The amount of field that can penetrate is quantized and one core contains one flux quantum Φ0 (Fig.5).
SINGLE FLUX QUANTUM
NORMAL CORE (field penetration)
SUPERCURRENT VORTEX
SURFACE CURRENTS (to maintain the bulk of material diamagnetic)
Fig. 4 Normal cores representation in a Type II superconductors slab. Surface currents flow to maintain the bulk of the slab diamagnetic. [1.5] DENSITY OF SUPERCONDUCTING ELECTRONS MAGNETIC FIELD CURRENT DENSITY NORMAL CORE SHIELDING CURRENTS ns H J
Fig. 5 Properties of normal cores in a Type II
When a Type II superconductor is exposed to a magnetic field lower than Bc1,
currents will flow on the surface opposing any external field to penetrate the material (perfect diamagnetism). When the external field exceeds Bc1, surface currents will still
flow but normal cores will also form in the material. These normal cores tend to form at the surface and diffuse into the material. The local islands of resistive regions allow magnetic flux lines to penetrate through the mixture without destroying the overall superconductive state.
If a transport current (Jt) were applied to an ideal Type II superconductor in the presence of an external magnetic field, the resulting Lorentz force (fL) would cause the magnetic flux lines to move and redistribute across the material:
0 Φ × = t L J f (1) The movement of the flux lines induces an electric field E:
0 Φ × = × =v B v n E L L (2) where vL is the velocity of the normal cores. The presence of this electric field requires a voltage to sustain the transport current. The movement of these normal zones could produce irreversible instabilities that would jeopardize the superconducting behavior of the material. This problem is obviated by carefully adjusting the heat treatment used to create grain boundary and structural defects that pin the vortices in set positions allowing for a net transport of current through the material (Fig. 6). When a current is applied to the superconductor in this mixed state, the current will flow without resistance in a path around the normal cores (now pinned). As the external field increases the number of normal cores increases until it occupies the entire material at Bc2 and the
material becomes normally conducting.
The critical state is defined by the force balance between the average pinning force density and the Lorentz force on the flux vortices:
p
c f
J Φ0 = (3)
Jc is called critical current density of the superconductor. If the transport current exceeds the critical current, flux flow and dissipation occurs. This quickly causes a breakdown in the superconductive state and marks the critical state level.
Most of Type I superconductors are pure metals and usually have very low critical field which make them impractical for magnet technology application. Type II superconductors are usually alloys or intermetallic compounds and have much higher critical fields (Bc2) that make them very attractive for magnet technology application
(Table 1).
The critical field and temperature values are intrinsic properties of the material. On the contrary, metallurgical processing can improve the critical current density.
There are two groups of superconductors:
1. Low temperature superconductors (LTS) usually alloy or metallic compound (Tc<30 K)
2. High temperature superconductors (HTS) usually oxide compound (Tc>30 K). Table 1 Critical temperatures and fields for Type I and II superconductors [1.4].
Superconductors (Type I) Material Tc (K) µ0Hc0 (T) * Ti (metal) 0.40 0.0056 Zn 0.85 0.0054 Al 1.18 0.0105 In 3.41 0.0281 Sn 3.72 0.0305 Hg 4.15 0.0411 V 5.40 0.1403 Pb 7.19 0.0803
Superconductors (Type II)
Material Tc (K) µ0Hc0 (T)
Nb (metal) 9.5 0.2*
Nb-Ti (alloy) 9.8 10.5+
NbN (metalloid) 16.8 15.3+
Nb3Sn (intermetallic compound: A15) 18.3 24.5+
Nb3Al 18.7 31.0+
Nb3Ge 23.2 35.0+
MgB2 (compound) 39 ~15*
YBa2Cu3-xOx (oxide: Perovskite) <YBCO> 93 150*
Bi2Sr2Cax-1CuxO2x+4 <BSCCO2223 or 2212> 110 180* * extrapolation at 0 K + extrapolation at 4.2 K
Several remarks can be made regarding the different materials and their applications: • HTS conductors have much higher critical field and temperature but their
application have been limited due to their recent discovery, the lower critical current density at high fields and the high cost.
• For stability and protection purposes LTS strands contain copper while BSCCO (HTS) uses silver. This makes BSCCO strands much more expensive.
• YBCO and BSCCO-2212 are available only in tape geometry
• BSCCO-2212 is competitive with other materials only at 4.2 K, limiting its high temperature capability (Fig. 7)
• Magnet grade conductors are presently limited to three materials: NbTi, Nb3Sn
and BSCCO-2223
• NbTi magnet technology is well established but the limited performance at high fields is driving attention to other materials
• LTS conductors are used by the High Energy Physics, Fusion Energy and NMR/MRI communities
• HTS conductors have a niche application for electric utility application
In Fig. 7 critical magnetic fields as a function of temperature are reported for different superconducting materials.
Fig. 7 Critical field as a function of temperature for selected LTS and HTS superconductors, the critical field at 0 K is an extrapolation from values at 4.2 K [1.4].
Fig. 8 Critical current density at 4.2 K for different superconducting material candidates for magnet design [1.6].
Wires used for superconducting applications, and in particular for magnet technology, must be capable of carrying large transport current and operate in large magnetic fields. The wires must also be produced cost effectively and in lengths appropriate for ease of magnet manufacture. Despite the promising progress of HTS materials, LTS remain the only materials that can be used for large systems and magnets. NbTi and Nb3Sn are the
most used materials. Different applications might opt for one or the other depending on the requirements of the system. NbTi is more popular and predictable while Nb3Sn has
still several challenges to be overcome.
In this thesis work the material selected for the production of the Central Solenoid for the ITER project was Nb3Sn (see following sections).
In a typical application, several strands are bundled in cable to obtain the required transport current. Typical strands have a diameter of roughly 1 mm and are composed of thousands of superconducting filaments, with a diameter in the µm range. These filaments are embedded in a copper matrix used to stabilize the superconductor and prevent premature transition from superconducting to normal state (a quench event). Fig. 9 shows a typical cross section of an IGC Nb3Sn wire used for the ITER CSCM
magnet design in the 1990’s.
Strands are made of thousands of filaments to prevent a phenomenon known as flux jumping. Flux jumping occurs when the Lorentz forces acting on a filament exceeds the pinning force in a non static fashion causing a cascade of events that increase the local heat developed inside a region of the superconductor. Once this happens the flux vortices are not constrained and will start moving causing local heating that will decrease the current density and eventually could cause a quenching event.
Jc (4.2 K) vs. B (T) 100 1000 10000 0 2 4 6 8 10 12 14 16 B (T) Jc @ 4 .2 K ( A /m m 2 ) Nb3Sn NbTi BSCCO-2223 BSCCO-2212 MgB2
For a typical application, a magnet can store megaJoules of energy so that if the magnet quenches and becomes resistive this enourmous energy is begins to dissipate in a normal zone. Beyond being dangerous for the system itself, a quench can damage or even destroy the conductor. To reduce the risk of a quenching event, the strands are embedded in a low-resistance matrix (usually copper) so that once local heating is developed the current can flow in the matrix instead of the high-resistance superconducting filaments. Moreover copper has a large thermal and electrical conductivity which helps transfer heat away from the superconducting filaments and helps avoiding damage.
Fig. 9 Cross-section of the cable used for ITER. Starting from bottom left and proceeding clockwise: six petals CICC design with central cooling channel, IGC Nb3Sn strand used in the
cable and superconducting filaments [1.4]. CABLE dc ~ 33 mm
STRAND, ds ~ 0.8 mm
FILAMENT, df ∼ 3 µm
1.2 Superconductivity Applications
Superconducting materials have their largest application in electromagnets. In fact they can achieve higher fields with less power consumption than normal conducting magnets. Though cryogenic systems are required, the overall cost for superconducting magnets is lower.
There are five major fields where superconductivity can be applied: 1. Fusion Energy
Fusion energy is one of the most promising sources of clean and abundant energy for the future. The International Thermonuclear Experimental Reactor (ITER) is the most immediate step towards the goal of demonstrating the feasibility of fusion energy. All the magnets in this tokamak are made of superconducting materials (NbTi and Nb3Sn). This thesis concerns one of the
issues related to the superconducting cables of the machine and more details will be given in the following sections regarding the machine and the engineering challenges.
2. High Energy Physics
High field requirements turned the attention of high energy physics to superconducting magnets. In a particle accelerator, magnets are used to accelerate, focus and analyze beams of energetic particles. The project Large Hadron Collider (LHC) in Geneva will be operational in 2007 and contains over 1500 superconducting magnets to reach the designed collision energy of 14 TeV (the Tevatron in Fermilab is the world largest accelerator so far with a collision energy of “just” 1 TeV).
3. Magnetic Resonance Imaging (MRI)
Imaging techniques using magnetic resonance greatly improved the capabilities in diagnosing and treating medical problems. Superconducing magnets are widely used since they produce a very stable DC field with minimal power consumption. Moreover the magnetic fields required for MRI are well within the safe margin of operation for superconductors and avoid any quenching event and provide for magnetic field accuracy.
4. Superconducting Power Transmission Cables and Magnetic Energy Storage (SMES)
Since the energy in superconducting magnets can be virtually stored indefinitely, they are considered good energy storage devices. SMES are now commercially available and compatible with standard storage device for some application. Improvements for power grids are envisioned for the future. To
improve the power-handling capabilities of existing underground circuits even further, HTS power could substitute for the standard high-voltage cables. HTS transformers would also decrease the environmental contamination caused by spilling from oil-filled high voltage transformers.
5. Magnetic Levitation
The use of superconducting magnets would allow levitating trains on tracks in transportation applications. The main advantage of this is that these trains will not have the standard mechanical moving parts, which reduces part wear and maintenance.
1.3 Magnet Types and Cable-In-Conduit Conductor
Magnets can be divided in two categories depending on the type of cooling technique used:
1. Adiabatic Magnets
In these magnets the local coolant is eliminated and the entire winding space unoccupied by the conductor is impregnated with epoxy, rendering the entire winding as one monolithic structure. The coolant is necessary but the conductor does not require direct contact with it. Rutherford cables (Fig. 10a-c) are usually used in these magnets. Epoxy impregnation is a critical operation. If the winding is not properly filled with epoxy, the magnet could be more susceptible to mechanical instabilities due to conductor movements (Fig. 10c). Adiabatic magnets are used for NMR, MRI and High Energy Physics dipoles and quadrupoles where the product RxJxB (force per unit area) is controllable using a composite conductor as a monolith entity.
Fig. 10 (b) NbTi Impregnated coil used in one of the LHC quadrupoles [1.7].
Fig. 10 (c) Nb3Sn racetrack coil impregnated with epoxy showing some voids after impregnation.
These voids could be critical for the stability and performance of the coil [1.8].
2. Helium Stabilized Magnets
These magnets are characterized by the presence of local cooling in direct contacts with the conductor. This approach is usually considered for large or high field magnets. In particular for magnets with large RxJxB, the composite conductor used for adiabatic magnets can no longer meet the mechanical requirements. The cable design adopted for these magnets is usually Cable-in-Conduit Conductor (CICC).
In the CICC configuration (Fig. 11), cabled strands of superconductor are enclosed in a conduit, which provides the mechanical strength and through which single-phase cryogen is forced to provide the necessary cooling.
Fig. 11 (a) Multiple stage CICC for ITER (3x3x4 x4 x6). (b) Cut-out of a superconducting cable
[1.4].
The cable design incorporates the key requirements of a superconductor. The cable is composed of many strands and can carry large amounts of current. The copper content is enough to ensure stability and protection and the twisting in different stages reduces AC losses while the conduit ensures the mechanical integrity.
To maintain a reasonable overall current density, the operation current has to be high since a major fraction of the cable does not carry current (the void, conduit and liquid helium channel). cooling channel conduit superconducting strands different cabling stages (a) (b)
1.4 ITER and Fusion Energy
ITER is a current driven plasma experiment that could set a milestone towards the demonstration of fusion as a source of energy for the future. Fig. 12 shows a cutaway of the machine and a cross section of the magnets system.
The magnets of this machine will all be built with superconducting material since the field requirements cannot be met by resistive magnets, without an enormous amount of power to sustain the currents. On the other hand, superconducting magnets require power for the cryogenic system but the overall system efficiency is increased compared to a resistive magnet solution.
Fig. 12 Cut-away of ITER (left) and the magnets system of the machine (right) [1.9].
The magnet systems are composed of 18 toroidal field coils (TF), a central solenoid (CS), 6 poloidal field coils (PF) and 18 correction coils (CC). TF and CS coils are made of Nb3Sn conductor while PF and CC coils are made of NbTi [1]. The central solenoid
plays a key role to reach the plasma current of 15 MA of the machine. The plasma current is inductively driven by the CS coil. The CS coil is composed of 6 modules which are independently powered. After initially charging the CS coil, a fast discharge follows and the rate of change of flux induces a voltage inside the plasma and drives the plasma current (Eq. 4).
dt d
Fig. 13 represents the central solenoid. It is composed of 6 modules and each module is made of pancake windings. The conductor is an advanced Cable-in-Conduit (CIC) Nb3Sn superconductor. The four components of the Cable-in-Conduit are the cable itself,
the central cooling tube, the foil wraps around the cable and final stages, and the structural jacket. The CS conductors are five stages of 3x3x4x4x6 cables, where the final stage twists 6 'petals' around a central channel (Fig. 13b-c).
Fig. 13 (a) Central solenoid view, (b) cross section of a cable in conduit conductor and (c) different stages of the cable wrapping around a central channel [1.9].
The performance of the Nb3Sn cable is crucial to reach the desired machine operation
values. Any degradation from the expected performance could reduce plasma current and time of plasma burn. Critical effects that could reduce performance are AC losses and electromechanical load effects.
(b)
(c) (a)
1.5 Scope of Thesis
The work in this thesis focuses on the effect of transverse forces on Cable-in-Conduit conductors for magnets used in ITER. Superconducting magnets used for fusion machine are cryostable. The conductor used is either NbTi or Nb3Sn in the form of CICC with a
central channel for cooling purposes. During operation the Central Solenoid magnet will be energized with current and field of up to 45 kA and 12.6 T, respectively, for the high current scenario; and 40 kA and 13 T for the high field scenario. A rough estimate of the transverse load created by the Lorentz force, which accumulates through the cable cross section, is given by (Eq. 5):
) ( ) ( ) ( ) ( max , mm d T B kA I MPa trnsv ⋅ = τ (5) where I is the transport current in kA, B the magnetic field in Tesla and d the cable
diameter (32.6 mm). By substituting the design values, we obtain a maximum transverse pressure of 17.4 MPa.
Fig. 14 Lorentz force due to electromagnetic interaction of current and field in a CICC cable [1.4].
When force accumulates on one side of the cable (vector F in Fig. 14), the strands are pushed towards the jacket surface and experience the highest exerted pressure.
Testing the effect of the electromagnetic transverse force on the real cable used for the magnets would be excessively expensive and difficult due to the size of the cable and the current requirements. It is necessary to produce a small scale experiment to simulate the same condition and extrapolate the results obtained on a sub-cable to the real size cable. To reproduce the same load, currents exceeding the capability of most common power supplies available for the test would be needed. Then, the load has to be produced mechanically as done in the work of this thesis.
In our experiment, the cable tested was made out of thirty-six Nb3Sn strands
(sub-sized cable) representing the first three stages of the real cable (3x3x4). The limitation to thirty-six strands is dictated by the maximum current and field, which are available for
B I F B I F d
our experiment. The test was performed at NHMFL with a probe with 10 kA current leads and a solenoid of 20 T maximum field.
Since the Lorentz force created during operation is not electromagnetically reproducible in the experimental set up, we designed a probe so that an artificial mechanical transverse stress could be applied.
The scope of this work is to apply a known transverse pressure on the cable and record any visible degradation of its superconducting properties (in particular degradation in the expected critical current).
Fig. 15 (a) represents the concepts of the device. The inner ring is made as a collet. The conical wedge pushes against the expanding collet while sliding vertically and the cable is squeezed between the collet and an external ring also shown. Fig. 15 (b) shows the pressure pattern on the cable (top view of the structure).
Fig. 15 (a) Schematic view of the device, (b) pressure pattern applied to the cable (top view). The conical wedge is pulled upward from the top of the dewar expanding the collet. Voltage taps are placed on the cable to measure the transition from superconductive to resistive phase and estimate the critical current. Strain gages are mounted on the external ring to measure the hoop strain on the ring and evaluate the transverse load on the cable (through ANSYS® simulation; discussed further in Chapter 3). A detail description of the device will be given in Chapter 3.
Nb3Sn cable Expanding collet Pulling force Conical wedge External ring
CHAPTER 2:
Strain characteristics of superconducting wires and cables
As seen in Chapter 1, superconductivity depends on three main parameters that describe a critical surface underneath which the material is superconducting. Later discoveries showed that superconductors are also sensitive to strain effects.
A lot of work has been done on the subject of strain effect on superconductor strands beginning about two decades ago. The attention was mainly focused on axial strain effect on the critical current of single strands. Later on the transverse strain effect on a single strand was studied, showing a much sharper degradation due to this effect than that of axial strain. Less attention has been paid in understanding the axial and transverse strain effects on a cable. In particular, the transverse strain effect is dominant for fusion type of magnets (having a void fraction of ~35-40%) but it is not an issue for high energy physics application where magnets are usually impregnated [2.1].
This chapter summarizes the previous work by other researchers to study this effect. After a brief introduction regarding the strain effects on superconducting strands and cables, a summary of different experiments done so far will be given starting with uniaxial strain effect on single strand, pinching and bending loads on single strands, tests of sub-size cables under axial strain, transverse load effect on single strand and tests on sub-sized cables under transverse load. The background given with this summary is relevant to explain the importance of the experiment carried out with this work, since very little has been done so fare and even more its unique setup.
2.1 Introduction
In this chapter a brief history of experiments dealing with the axial and transverse effects on superconductors performances is reported. Besides the dependence on current density, field and temperature, the performance of a superconductor strand or cable is affected by axial and transverse strain. The latter has a more accentuated effect and the degradation due to transverse strain is up to one order of magnitude greater than the degradation due to axial strain (at the same level of strain) [2.3].
The sensitivity of a Nb3Sn superconductor to transverse loading is dependent on a
large number of factors, including the copper/non-copper ratio (quantity that defines the amount of copper over the total amount of material in a strand), the ratio of distance between contact points to the strand diameter, void fraction constraints on strand deflection, pre-compression strain, heat treatment, and the exact material composition of the non-copper region. A monolith or single strand is expected to be an order of magnitude more sensitive to transverse load than to longitudinal load (Fig. 13 later this chapter) and a cable to be two orders of magnitude more sensitive [2.2-2.3].
The larger degradation, for a single strand, caused by transverse load (a factor of 10 larger than the longitudinal case) is believed to be due to the multiplier of deviatoric strain in a composite, in which the transverse compression on a composite with a stiff, unyielding component and a soft, yielding component is translated into a longitudinal tensile strain in the stiffer. In fact, a superconducting strand is composed of copper (the
soft component) and non-copper material (the stiff component), which includes Nb3Sn, a
barrier (usually tantalum) and bronze. The copper is the low resistance stabilizer where the current flows during a transition to the normal state. The barrier is needed to separate high purity copper from the rest of the composite, which contains bronze, Nb and Sn.
In a cable the degradation due to transverse loads is even more accentuated (~100 times larger than the longitudinal case) [2.2]. A possible explanation for this behavior is the presence of an additional bending effect of each strand inside a cable due to the twisting of the strands around each other [2.2-2.4].
2.2 Axial strain effect
Before summarizing the results of different studies, a series of definition is required. Experiments are usually done with a fixed temperature (usually 4.2 K for Nb3Sn) and a
fixed background field. Critical currents are usually measured and a so-called “critical current criterion” is used to determine the critical current. The definition can be understood considering an example.
Fig. 1 Critical current measurements for Nb3Sn cable used in our device. -1.00E-05 0.00E+00 1.00E-05 2.00E-05 3.00E-05 4.00E-05 5.00E-05 6.00E-05 7.00E-05 0 1000 2000 3000 4000 5000 current (A) vo ltage ( V ) Ec=100µV/m Ec=10µV/m
Fig. 1 represents the typical voltage-current curve during a critical current measurement. In this particular case the temperature was 4.2 K and the background field was 10 T. As the current is increased, the voltage is zero and within the noise level (resistance at this stage is zero as expected from a superconductor) up to a level when the cable starts showing a resistive component (in the Fig. shown around 4 kA). The growth of the voltage as a function of a current is usually described as an exponential [2.5]:
n c c I I V V = (1)
where V and I are the voltage and current to pre-chosen critical values Vc and Ic. The
exponent of this relationship is n called “n-value”, often used to describe the sharpness of the transition from superconductive to resistive state. More often two different criterions are used to evaluate the n-value:
n c c c c I I V V = 2 1 2 1 (2) = 2 1 2 1 ln ln c c c c I I V V n (3)
Usually the criteria used are Ec1=100 µV/m, Ec2=10 µV/m, with the corresponding
voltages calculated by multiplying by the distance between the two points from which the voltage is recorded (voltage tap length). The higher the criterion, the less accurate the calculated critical current. In our example, the voltage data were filtered and the offset of the measurement was taken out. The data points are fitted with a polynomial and the intersections of this curve with the two chosen criteria give the two critical currents and permit the determination of the n-value.
A superconducting strand is usually purchased with a specific critical current and n-value provided by the vendor so that expectation values of critical currents can be estimated before the experiment is set up. More details on how all these parameters are evaluated will be given in following chapters during the description of the device and the data taken during the experiment.
Now that a few necessary definitions are given, a summary of the experiments done so far will follow.
Ekin [2.6], carried out a formal relationship for strain scaling based on experimental results using an apparatus which applied simultaneously tensile strain, current and a perpendicular field to a short conductor. Studies were done at a fixed current while varying the other variables. The dependence on field, strain and temperature effects were empirically determined from these measurements.
The sample was secured at either end by soldering it onto two copper blocks. One of the two copper blocks could be moved allowing for the application of tension on the pull rod attached to a lever arm.
The strain was directly measured with a four-strain-gauge extensometer. The critical current criterion used was 200 µV/m and the accuracy in the measurements was 0.5%.
Several different specimens were used and it was possible to find a “universal” relationship describing the behavior of strands under axial strain:
) ( )] ( [ ) ( ) ( * 2 f b B b f K F n c ε ε = = (4)
where F is the pinning force density and b is the reduced field b = B/B*c2 with B*c2 strain dependent bulk upper-critical field.
The strain dependence of B*c2 was found to be
( ) * (1 ) 2 * 2 u m m c c B a B ε = − ε−ε (5) where the maximum value, B*c2m, occurs at εm.
For highly reacted Nb3Sn conductors u ≅ 1.7 and a ≅ 900 for ε< εm and a ≅ 1250 for
ε > εm. For insitu (external tin diffusion) and partially reacted Nb3Sn conductors a is
smaller (less sensitivity to strain).
This strain scaling relationship can then be combined with the temperature scaling relationship to get the general scaling law for the dependence of F on both strain and
temperature: F(B,T, ) (1 a u)n(1 t2) f(b) m ν ε ε ε = − − − (6) with n ≅ 1, ν ≅ 2.5, t = T/T*
c (ε). This equation can be found by postulating the dependence of B*c2 on temperature and strain as:
w u m cm c c w c c a T T T T T T B / 1 * * 2 * * * 2 ) 1 ( ) ( } )] ( / [ 1 { )] ( [ ) , ( ε ε ε ε ε ε − − = − = (7) where w ≅ 3.
Several measurements were done by Ekin and used to develop and verify the validity of this equation for uniaxial strain in a single strand.
Most of the experiments (especially at the University of Twente) focus on the axial strain dependence of single strands hoping to find better universal scaling laws describing the dependence of critical parameters on axial strain. Unfortunately extrapolations from single strand results to a prediction for a cable are not easily carried out and are very much dependent on the application for which the strand is used.
2.2.1 Single strand in uniaxial strain
There are three devices that are most used in studying the strain behavior of superconductors: the U-spring holder, the device called “Pacman”, and the Walters springs. These devices are the most common used to improve the scaling laws used to estimate the critical current of single strand under the effect of uniaxial strain (tension r compression).
In the U-spring device (Fig. 2) the sample is mounted across a bridge that can be in the tensile or compressive regime depending on the movement of the device’s legs. It is really reliable but limited by the length of the sample measured [2.7]. The longer the sample the easier is to measure the critical current because the distance between voltage taps can be longer reducing the voltage to noise ratio in the signal.
Fig. 2 U-spring strain device [2.7].
In the so-called “Pacman” device (Fig. 3) the measurements can be taken over a length as high as 10 times that of the U-spring device. The sample is fixed on the outside diameter of the holder and when a pure torque force is applied to the sample at the ends of the beam section, the beam diameter changes and puts the sample in either compression or tension constraints [2.7, 2.8].
Fig. 3 Pacman strain device [2.7, 2.8].
The Walters springs (Fig. 4) are the most common device used for strain measurements. These can hold a sample length of 80 cm and the Ti6Al4V spring where
the sample is mounted, allows linear and reversible strains up to 1.4%. The sample is either fixed by soldering or is immobilized in a groove. The mechanism operates by applying opposite torques at each end of the spring [2.9].
2.1.2 Single strand under pinching and bending loads
The device described in the previous section are used mostly to study tensile and compressive effects on single strands. More recent experiments deal with specific problems related to cable configurations in which a strand is under pinching and bending effects as well [2.10]. A novel strain device was created after analysis of the ITER Central Solenoid Model Coil (CSMC) and Insert Coils revealed degradation higher than was expected [2.25]. Test Arrangement for Strain Influence on Strands (TARSIS) was the first device used to simulate the load experiences by a strand in a CICC cable [2.10]. The mechanism is shown in Fig. 5.
Fig. 5 TARSIS experiment setup [2.10].
The experimental setup consists of a lower drum and upper cup with a periodic circular arrangement of fingers and pins respectively simulating the periodic bending experienced by a single strand in a cable. Operation entails closing the cap on the drum so that the fingers close onto the pins, placing the strand in a periodic bending-tension-shearing-pinching state. Measurements showed degradation of single strand under repeated load application. The degradation is due to a plastic deformation together with a reversible degradation with loading [2.10].
Other experiments were done to isolate a single characteristic and understanding the fundamentals related to it. In particular experiments were done to isolate the bending strain behavior of Nb3Sn strand. Senkowicz, Takayasu and Lee tested several strands
under different static bending conditions [2.11]. In these tests the sample is clamped in a fixture with a constant radius of curvature. The strand is heat-treated in a straight configuration and then transferred inside a groove between two curved Ti6Al4V clamps at
strand can be tested only once at its fixed bending state, and therefore cannot be loaded at multiple strain states.
Fig. 6 Fixed bending strain behavior strand configuration [2.11].
A pure bending device was recently designed and successfully tested by Harris and Takayasu [2.12]. In this new design, a series of gears with different ratios are moved by rotating torque arms through an input shaft controlled outside the dewar. Fig. 8 shows a schematic of the device. The strand is mounted on a support beam and a groove is placed on the neutral axis of the beam to produce pure bending effect on the strand. The bending strain can be increased up to 0.8% (Fig. 7).
Fig. 7 Maximum bending applied to the support beam at room temperature during preliminary set up.
(a) (b) (c) Beam Clamp Test Samples Support
Beam Torque Input Shaft Coupler
Arm Top Plate Input Shaft Drive Shaft Plate Spacer Bottom Plate Torque Gear Thrust Bearing
Fig. 8 Pure bending device components: (a) complete mechanism, (b) with strand mounting system removed, and (c) inner gear train [2.12].
![Fig. 6 Normal cores and pinning centers in a Type II superconductors [1.4].](https://thumb-eu.123doks.com/thumbv2/123doknet/14733219.573526/22.918.201.724.690.1031/fig-normal-cores-pinning-centers-type-ii-superconductors.webp)
![Fig. 8 Critical current density at 4.2 K for different superconducting material candidates for magnet design [1.6].](https://thumb-eu.123doks.com/thumbv2/123doknet/14733219.573526/25.918.144.774.120.507/critical-current-density-different-superconducting-material-candidates-magnet.webp)