DESIGNING A SERVICE PARTS QUALITY SYSTEM FOR RAPID CUSTOMER RESPONSE
By Randal Bauman
Bachelor of Science and Engineering in Chemical Engineering University of Michigan, Ann Arbor, Michigan 1993
Submitted to the Sloan School of Management and the Department of Electrical Engineering and Computer Science in partial fulfillment of the requirements for the degrees of
Master of Business Administration
and Master of Science in Electrical Engineering and Computer Science In conjunction with the Leaders for Manufacturing Program at the
Massachusetts Institute of Technology June 2002
Massachusetts Institute of Technology, 2002 All rights reserved
Signature of Author
MIT Sloan School of Management Department of Electrical Engineering and Computer Science
~- -- May 10, 2002
Certified by
d B. Rosenfield Senior Lecturer, Sloan School of Management Thesis Supervisor
C ertified by _ D uaneB oning
Duane Boning Associate Professor of Electrical Engineering and Computer Science Thesis Supervisor Accepted by____________ ______________________
Margaret Andrews Executive Director of the MBA Program
T Sloa chogl of Management Accepted by
Arthur Smith
MASSAC-HUETTS INST TUT Chairman, Graduate Committee
OF TECHNOLOGY Department of Electrical Engineering and Computer Science
JUN 2 4 2002 BRE
BARKER LIBRARIES
DESIGNING A SERVICE PARTS QUALITY SYSTEM FOR RAPID CUSTOMER RESPONSE
By Randal Bauman
Submitted to the Sloan School of Management and the Department of Electrical Engineering and Computer Science on May 10, 2002 in partial fulfillment of the requirements for the degrees of
Master of Business Administration and
Master of Science in Electrical Engineering and Computer Science ABSTRACT
The objective of the thesis is to provide a framework for understanding and improving service parts quality management in a high technology industry. The research carried out during the internship is used as a case study for understanding and improving service parts quality
management.
The semiconductor capital equipment industry is primarily technology driven and is highly competitive. Capital equipment tools are extremely complex, because there are thousands of individual parts that have to be assembled and integrated. Service part usage is low volume and failures are relatively infrequent and unpattemed. This creates many difficulties in analyzing and understanding the failure data that drives factory quality improvement activity.
There are two major types of quality management systems: ones that address quality problems and ones that prevent quality problems. The first piece is centered on managing
immediate customer complaints. The scope of this research covers the day-to-day management of immediate quality issues.
The approach in attacking this problem is to discover the key failure modes that affect the current quality system. Two major tasks shed light on the key failure modes of the service parts quality system. The task of analyzing data to prioritize work and the task of working through several customer complaints reveal the key failure modes facing the company. Three key failure modes are identified. First, quality data analysis in the service part business environment is
especially challenging, making it difficult to establish work priorities. Secondly, there is no formal customer input into factory quality work prioritization. Finally, unclear ownership for quality issues hampers progress in resolving these issues.
By considering these key failure modes one can learn ways to improve the day-to-day service parts quality management. Given the key failure modes, the objective is to design a new process around parts quality that is robust to these failure modes.
Given the complex business environment, the service parts quality system should be geared towards customer responsiveness on specific issues. The major challenge is to structure service parts quality management such that prioritization is simple, factory and customer needs are aligned, and issues are resolved quickly.
The purpose of the thesis will be to develop the failure mode approach stated above and to illustrate that this approach can be applied in many business environments that are similar to this environment.
Finally, this company is not the only company facing a complex manufacturing
Thesis Supervisor: Donald B. Rosenfield
Title: Senior Lecturer, Sloan School of Management Thesis Supervisor: Duane Boning
ACKNOWLEDGEMENTS
I would like to thank the Leaders for Manufacturing program for the outstanding educational experience over the past two years. The Leaders for Manufacturing program is a partnership
between the Massachusetts Institute of Technology and major manufacturing firms. For a fantastic internship experience, I would like to thank my host company.
My thesis advisors, Don Rosenfield, Senior MIT Lecturer, and Duane Boning, Associate Professor of Electrical Engineering and Computer Science, provided great support and insightful input into this work. I also want to thank the LFM Class of 2002 for their great support and friendship.
DESIGNING A SERVICE PARTS QUALITY SYSTEM FOR RAPID CUSTOMER RESPONSE
Table of Contents
Chapter 1: Background (p. 7-12)
Chapter 2: Collecting Organizational Data (p. 14-18) Chapter 3: Discovering Failure Modes (p. 19-33)
Chapter 4: Customer Responsiveness Framework (p. 34-37) Chapter 5: Empirical Results (p. 38-45)
Chapter 6: Final Thoughts and Recommendations (p. 46-51) Appendix A: Sample Corrective Action Report (p. 52)
Appendix B: Bulletin for Improvement and Standardization of Packaging (p. 53) Appendix C: Packaging Change Detail (p. 54-56)
Bibliography (p. 57-60)
Chapter 1: Background
1.1 Industry Background
The semiconductor industry is one of the most challenging manufacturing industries in the world today. One of the distinguishing characteristics for this industry is its rapid growth. The compound annualized growth rate for the semiconductor industry has exceeded 10% since its inception. Moore's law, named after one of the founders of Intel Corporation, describes the observation that chipmakers are implementing design and manufacturing improvements that double computing power every 18 months. This staggering rate of innovation places a lot of pressure on all industry participants. It well known that underutilized semiconductor factories are very costly and that bottleneck process tools that are down can have a significant impact on the bottom line.
1.2 Supplier Pressure
A great deal of pressure is placed on the capital equipment suppliers who build and support the sophisticated wafer processing equipment. These suppliers must introduce new technology quickly, provide capital equipment at a reasonable price, and ensure that the machines in the field are running at maximum utilization.
Based on their position in the semiconductor supply chain, the large distance from the end customer down the value chain results in bigger demand fluctuations. This effect has been studied in the field of system dynamics and is called the bullwhip effect'. The bullwhip effect makes it more difficult for capital equipment manufacturers to plan for and meet demand for capital equipment.
CAPITAL EQUIPMENT COMPANY designs and manufactures complex capital equipment for the semiconductor industry2. In addition to designing and manufacturing the capital equipment,
CAPITAL EQUIPMENT COMPANY also supports the installed base of tools. This includes assisting customers with regular tool maintenance, implementing specific tool enhancements known as upgrades, and supplying critical service parts when tools go down. These spare parts can be predictable maintenance spares, spare parts with failure history, or spare parts with no failure or usage history.
1.3 Complex Products
The semiconductor capital equipment business has been primarily technology driven from the beginning. Wafer processing tools are highly complex in that a typical CAPITAL
EQUIPMENT COMPANY tool contains thousands of individual parts. Many of these parts are combined into assemblies, which are then integrated into higher-level assemblies. Manufacturing and testing for these tools are complicated by the fact that it is difficult to test each component and sub-assembly independently with confidence that everything will function properly when fully integrated in the final build. This makes the service part business especially challenging, because spares that are built for a down tool from the installed base are not normally integrated into an entire brand new machine for testing. This means that the first "real" operating test for the service part can often occur in the field upon installation. Thus the integrated nature of the equipment complicates the data collection for testing.
There are numerous individual operations (sometimes hundreds) required to hand-build a single part, so that the causes of part failures are practically untraceable. Traceability is invaluable
in obtaining data to aid in the decision making process3. Unfortunately, since there are few clearly and sharply defined processes it is difficult to characterize and control variation, because the majority of problems are special cause (abnormal, unexpected, non-random)4. What CAPITAL EQUIPMENT COMPANY is left with is a random assortment of special cause problems to tackle that seem to appear and disappear with little recurrence or systematic trends.
1.4 Low standardization
The semiconductor industry is structured such that each integrated circuit manufacturer can drive its own process tool improvements. The rapid improvement of device technology and chip performance requirements puts tremendous pressures on the chipmakers to continuously enhance process technology. This leads to a proliferation of "customer specials," producing an installed base in which nearly every tool is unique. Given this operating context one can claim that CAPITAL EQUIPMENT COMPANY manufacturing is a relatively low
standardization-manufacturing environment, because no two machines in the field are necessarily identical. Low standardization makes it difficult to maintain repeatable production processes as many orders are customized.
3 High Mix Low Volume Manufacturing, R. Michael Mahoney, 1997, CPIM Prentice Hall
4 The Six Sigma Revolution: How GE and others turned process into profits, George Eckes, 2001, John Wiley and Sons, Inc
1.5 Low volume
Essentially, CAPITAL EQUIPMENT COMPANY is a low volume operation. Even during boom times CAPITAL EQUIPMENT COMPANY never builds more than 15 to 30 tools per month. Furthermore, the installed tool base for spare parts is not large enough to cause the usage for spares to approach a high volume situation on a part-by-part basis. Production volumes for many parts are so low that CAPITAL EQUIPMENT COMPANY is much like a job shop. Currently there are over 100,000 available stock keeping units (SKU) for CAPITAL EQUIPMENT COMPANY parts, but perhaps only 20% of these part numbers may be shipped or used in any given year. Based on all
service parts that are manufactured and sold over the course of a year, the average volume for an individual part is roughly ten per year. The distribution of demand across parts is even more remarkable. For a given business quarterly period nearly half of the service parts that are manufactured and sold are only used once. The high number of possible parts, low volume, and
high interdependency makes it difficult to trace back causality for quality failures.
It is useful to put this into context for the broad range of all manufacturing facilities. As shown in Figure 1.1, the low volume characteristic accounts from anywhere from less than 1% to 15% of all manufacturing facilities depending on whether or not standardization is classified as high
or low5.
Figure 1.1: Process throughput-standardization matrix6
High standardization High standardization
Low throughput High throughput
15% 80%
Low standardization Low standard
Low throughput High throughput
<1% 5%
Based on the type of environment that a company faces, different control techniques may or may not apply. The figure below describes the best controls for each type of situation, ranging from statistical controls to non-statistical review methods.
5 The Six Sigma Revolution: How GE and others turned process into profits, George Eckes, 2001, John Wiley and Sons, Inc
Figure 1.2: Process throughput-standardization matrix tools7 High Standardization Low Throughput Non-statistical controls: - checklists - schedules High standardization High throughput Statistical controls:
- X bar and R charts - Individual and R charts - X bar and S charts
- other types of statistical charts
Low standardization Low standard
Low throughput High throughput
Non-statistical controls: Other types of statistical controls:
- periodic status reviews - Bar charts
- Pie charts - Pareto charts
1.6 Customer need for supplier operational excellence represents market share opportunities Since the capital equipment manufacturers provide the enabling technology for the
chipmakers, the capital equipment makers are often characterized as engineering and technology driven companies. This was certainly the case from the early 1980's until now. Because of the increasing investments to build new fabs, there is more financial pressure to keep machines running. Customers will pay a premium for reliability of design, delivery, and support. In this new landscape CAPITAL EQUIPMENT COMPANY has the opportunity to capture market share through
excellent and responsive service parts management.
1.7 Definition of quality
Quality can generally be considered as a conformance to specifications for a given product or more importantly as indicating a level of customer satisfaction. Dimensions along which one can measure the conformance of a product to specifications are the following: performance, features, reliability, conformance, and durability. Dimensions along which one can assess the level of
7 The Six Sigma Revolution: How GE and others turned process into profits, George Eckes, 2001, John Wiley and
customer satisfaction would be: serviceability, aesthetics, and perceived quality'. Quality in the CAPITAL EQUIPMENT COMPANY context refers to the delivery of spare parts to the field. The major problems that CAPITAL EQUIPMENT COMPANY face in its service parts business are that the wrong part or wrong number of parts is delivered, the part arrives broken, or the part does not work. These are the three key dimensions of conformance for CAPITAL EQUIPMENT
COMPANY customers. Data analysis reveals that a small percentage of line items that are shipped arrive at the customer site with one of the three general problems described above. The primary goal of the research carried out at CAPITAL EQUIPMENT COMPANY is to characterize the quality system around service parts and recommend actions to improve parts quality. Ultimately the goal is to improve customer satisfaction.
1.8 Scope of quality discussion for thesis
There are two major elements to managing quality. The first element is centered on managing the immediate customer complaints and quality issues in the field. The second component is aimed at eliminating the root cause issues that produce poor quality material that ultimately reaches the customer.
As described above the complexity of the manufacturing environment coupled with low-part standardization, low-part volume, and sporadic usage for any given part makes this a difficult problem to manage. Figure 1.3 shows the cycle time for responding to customer complaints; each bar indicates the number of times it took a specific number of days to respond to a customer complaint, and the spread of the bars indicates variability in the response time. Improvement on this state would be indicated by fewer total events for a given time period, a tighter distribution of the bars, and a shift of the bars to the left towards a lower mean response time. A response to the customer in this situation is defined as the elapsed time between officially reporting the event and sending a completed corrective action report to the customer. Reduction in either the variability or the cycle time for a customer response can have a positive impact on customer satisfaction.
Figure 1.3: Customer Response Cycle Time
Customer Response Cycle Time
8- 7--
6--a)
32
-Number of Days for Response
In the opinion of CAPITAL EQUIPMENT COMPANY management and its customers the mean response time is too high. It is important to note that the issues comprising this particular sample of data are not issues that require major design changes, but are usually relatively simple issues that can be handled within the operations organization. However, when these problems are investigated there are many opportunities to find and fix failure modes. For instance, an electrical assembly may fail in the field. The failure may be traced back to an improperly assembled part, providing an opportunity to improve documentation and procedures that will prevent the reoccurrence of similar failures in the future.
These relatively simple issues can be described as chronic problems: the wrong part or wrong number of parts has been delivered, the part arrives broken, or the part does not work. It is clear for this type of environment that it is often difficult to know how to best allocate scarce resources. Reality suggests that the first component of the service part system, managing
immediate customer complaints, must be addressed anyway, so the scope of this research covers the day-to-day management of immediate quality issues. The purpose of the thesis is to provide a
framework for managing quality in a low-volume, low-standardization, high technology, and customer driven environment.
1.9 Thesis structure
The thesis is organized into several sequential sections. This first chapter provides the background and context that make service part quality management challenging. The next chapter describes the process of discovering the organization. It is critical to gain a solid understanding how service part quality is currently managed before developing methods for improvement. A clear picture of the current quality management system is built through conducting personal interviews and working alongside members of the organization. The third chapter describes the hands-on process of discovering the three key failure modes in managing quality: flat part failure pareto, lack of structured customer driven prioritization, and unclear ownership for quality issues. The fourth chapter proposes a new organizational structure for managing service part quality based on the three key failure modes. The critical message in chapter four is that a new process for managing quality must be consciously designed around the current failure modes in order for it to be successful. Chapter five demonstrates some successful results around implementing some of the new ideas on a pilot scale. This chapter emphasizes the importance of testing new ideas so that the organization can learn from and build on the results. Finally, the last chapter explores the transferability of the ideas proposed in the thesis to a broader range of industries and also provides some final thoughts.
Chapter 2: Collect Organizational Data
This chapter begins with a description of two popular approaches for improving quality, notably Total Quality Management and Six Sigma, and also explains how these approaches apply to the CAPITAL EQUIPMENT COMPANY environment. Then this chapter describes the process of collecting organizational data. Organizational data serves as a baseline for understanding where
service part quality management stands at CAPITAL EQUIPMENT COMPANY today. It is critical to gain a solid understanding of how service part quality is currently managed before developing methods for improvement. The chapter concludes with a description of an effective hands-on approach for discovering the organization through conducting personal interviews and working alongside members of the organization.
2.1 Quality improvement approaches TQM (Total Quality Management)
One popular answer to solving quality problems is to say that CAPITAL EQUIPMENT COMPANY needs to implement a TQM program. This was the solution for many companies in the 1980's and early 1990's. One definition of TQM is the following9:
Total quality management is an effective system for integrating the quality development, quality-maintenance, and quality-improvement efforts of the various groups in an organization so as to enable marketing, engineering, production, and service at the most economical levels which allow for full customer satisfaction.
TQM hinges on identifying customer needs and translating them back to product design, manufacturing, and in some cases even organizational structure. Continuous improvement initiatives are almost synonymous with TQM. Continuous improvement is a concept where company improvement actions are focused on processes. These processes (business,
manufacturing, or design processes) are broken down, analyzed, and improved to eliminate waste and improve customer satisfaction.
The scientific method is the foundation for improvement, because solutions are
hypothesized, tested, and confirmed before they are fully implemented. The PDCA cycle (Plan, Do,
Check, Act) describes a simple model for how process improvements are implemented0. The ideas
developed during this research gain more credibility, because they are hypothesized and tested. The value in testing a hypothesis is in the objective evaluation of the new idea and also in the feedback that drives further improvement.
Six Sigma
Six Sigma started as a program to achieve process control for all manufacturing processes at Motorola. Company research supported the fact that the cost of poor quality can be extremely high, up to 10% of sales per year . For a process with a centered normal distribution, six sigma process control means that only two per billion fail to meet specification target (only two fall beyond 6c from either side of the mean). When the "typical" process shifts from the mean are estimated at +/-1.5c, then 3.4 defects per million opportunities are observed. Six Sigma is a data driven approach that relies on statistical tools to analyze complex processes. By driving variability out of the
manufacturing system the cost of scrap, rework, etc. could be substantially reduced.
The core of the Six Sigma process improvement philosophy supports the notion that processes with patterned reoccurring failures can be improved by systematically driving out the variability. Unfortunately, the CAPITAL EQUIPMENT COMPANY service parts quality environment is characterized by unpatterned, non-repeating failures of a relatively small sample
size. However, many of the Six Sigma tools such as process mapping, pareto analysis, and
concentrating on the critical few can be helpful in understanding and improving service part quality at CAPITAL EQUIPMENT COMPANY.
Several Six Sigma tools have been applied to the research project. Specifically, problem definition, process mapping, and a failure modes and effects analysis are used to structure the initial approach to the research13
. The Six Sigma methodology is helpful in defining a spare parts quality framework, primarily because it is a good starting point for organizing quality information and issues in a systematic manner.
10 A New American TOM: Four Practical Revolutions in Management, Shoji Shiba, Alan Graham, Dave Walden, Productivity Press, 1990
" "Quality: A personal responsibility for executives," Robert Galvin, Center for Quality of Management Journal, 1993 12 Implementing Six Sigma: Smarter Solutions Using Statistical Methods, Forrest W. Breyfogle, John Wiley and Sons,
2.2 Six Sigma: Define problem
The first goal of the research is to characterize the service parts quality system for the entire company. Quality in this context refers to the delivery of service parts to the field. Good quality means that the part is the correct part, the part is undamaged, and the part works the first time. CAPITAL EQUIPMENT COMPANY wants to minimize the number of service parts that arrive as the incorrect part, damaged, or dead on arrival (DOA). In managing the quality problems that are reported, the challenge for CAPITAL EQUIPMENT COMPANY is to ensure that issue
prioritization is simple, factory and customer needs are aligned, and issues are resolved quickly. Mapping the process and performing a failure modes and effects analysis (FMEA) is an appropriate way to start the enormous task of improving quality. These techniques structure the approach and organize the data related to quality and failures in a quantitative way.
2.3 Six Sigma: Map process
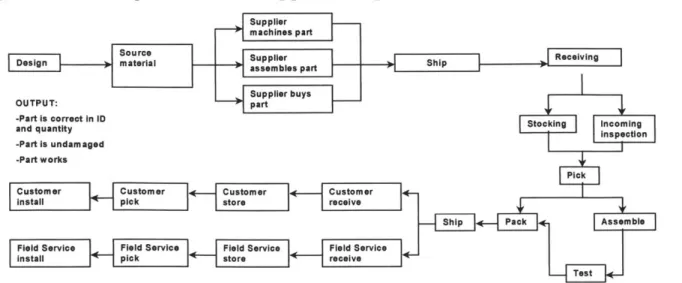
By creating a process map a picture is developed for the service part manufacturing process from design all the way to delivery and installation in the field. The diagram in Figure 2.1 shows an example of what the process map might look like for the CAPITAL EQUIPMENT COMPANY service part manufacturing process. Each box represents a process that is performed on the part (i.e. "Ship to CAPITAL EQUIPMENT COMPANY" denotes the transfer of the part from the supplier to CAPITAL EQUIPMENT COMPANY). Note that some points are decision or branch points. For example, once a part is at the "Pick" step, it can either be sent to "Pack" for immediate shipping or sent to "Assemble" as part of a bill of materials for a part build.
Figure 2.1: Service part manufacturing process map
.Pa+ in ID "Is.correct
-Part Is undamagedp
-Part works
Pick
Customer Customer Customer Customer Install pick store receive
Ship Pack Assemble Field Service Field Service Field Service Field Service
install ... pick store receive
Personal interviews, quality incident case studies, and first-hand working experience are the primary methods used for gathering the data about each process step. It is important to get a feel for how the service part support system works and the problems in the process through personal
interview, but it is even more valuable to develop personal credibility by case study and first-hand experience. One can populate the process map with all the operational inputs that are required at each step to help improve and ensure quality output. Critical areas for improvement can also be discovered and prioritized.
Interviews
The purpose of interviewing is to gain a basic understanding of the strengths and
weaknesses of the current quality system through the eyes of the people who work in it or rely on it. The following groups are represented in the interview process: Marketing, Quality, Sales,
Manufacturing Engineering, Design Engineering, Supplier Quality Engineering, Stockroom, Shipping, Receiving, Global Parts Planning and Logistics, Field Service, and Purchasing.
Quality incident case studies
Another way to capture the day to day handling of quality incidents is to follow several case studies through the system. In particular, the following three tasks or quality incidents have been experienced first hand to help identify the strengths and weaknesses of the current system:
1. Understand a current manufacturing or testing problem 2. Resolve a customer complaint
3. Resolve a chronic pain for a regional field service office
In addition to following the quality incidents described above, attendance at several of the regular quality meetings at CAPITAL EQUIPMENT COMPANY provides insight into how individual issues are managed. For example, in one such weekly meeting the manufacturing groups present quality investigations to a cross functional team of management. This meeting has high visibility with the CAPITAL EQUIPMENT COMPANY management team and is an important forum for discussion of both specific quality problems and management quality goals.
Living the process
A particularly important way to give credibility to the findings is for one or more of the quality improvement team members to actually work in the factory areas. The following areas interact strongly with service part quality:
1. Receiving (receive incoming parts) 2. Inspection (inspect incoming parts)
3. Stockroom (put parts away in the stockroom) 4. Stockroom (pick parts in the stockroom)
5. Manufacturing (build a part on the factory floor) 6. Shipping (pack and ship finished sales orders)
2.4 Perform FMEA to generate a prioritized list of actions
The purpose of an FMEA is to generate a risk priority number (RPN) for each input". An RPN is simply the product of the following three measurable risk factors:
1. Severity- estimate the severity that the occurrence of a particular input will have on the customer
2. Occurrence- estimate the probability that the input will occur
3. Detectability- estimate the probability of detecting and preventing the cause of failure before it reaches the customer
Each input is assigned a number from 1 to 10 for severity, occurrence, and detectability. An assignment of 1 indicates the lowest risk situation, and an assignment of 10 indicates the highest risk situation. The product of the three numbers is computed to arrive at a total RPN for a particular input. Once each input is assigned an RPN number, all the inputs can be ranked in order of priority, thus indicating the most critical area for improvement. This approach works well in an environment where data is clear and failures are repeatable. FMEAs give the impression of precise quantitative
data; unfortunately in this particular manufacturing environment much of the input data for the FMEA is subjective.
14 Implementing Six Sigma: Smarter Solutions Using Statistical Methods, Forrest W. Breyfogle, John Wiley and Sons,
In the CAPITAL EQUIPMENT COMPANY environment the data for severity, occurrence, and detectability is difficult to quantify. For example, an input to the "Assemble" process is
"engineering drawings," which describe how the different parts fit together for a particular
assembly. In order to develop an RPN number for this particular input we need to now how often the prints "fail." A failure might mean that the prints had errors in them that made the assembly process unclear. Quantitative data on this type of failure is not readily available; such information must be obtained through a personal interview, which can be subjective. Therefore the RPN results from an FMEA may not be reliable in an environment where the input data is difficult to quantify.
2.5 Working with quality data
The FMEA approach is purely an analysis tool, because it indicates what needs to be fixed but not how to fix it. In the CAPITAL EQUIPMENT COMPANY case, there are not many rigidly defined manufacturing processes; rather the manufacturing environment is more like a job shop in which special procedures are followed for each part. This makes it difficult to isolate the key variables that need to be evaluated, because without a defined process one cannot accurately isolate the effect of a given variable. The difficulty in applying the Six Sigma approach system wide to CAPITAL EQUIPMENT COMPANY is a function of the non-repeating, infrequent failures that reside in unstructured processes.
The most effective way of working with data in this type of process environment is to categorize the reported failures in the quality system. As described in the next chapter, this lays the foundation for discovering the key failure modes in service part quality management.
In summary, it is clear that there is value in applying some of the tools contained in Six Sigma to improve quality. However, based on the ambiguity in this environment an appropriate approach is to experience and discover quality management first hand in order to gain an understanding of where improvement is needed.
Chapter 3: Discovering Failure Modes
The approach in attacking the service part quality system problem is to discover the key failure modes that affect the current system. These failure modes then drive the results for this research. Two major tasks shed light on the key challenges of the service parts quality system. The tasks of analyzing data to prioritize work and of working through several customer complaints reveal the biggest problems facing CAPITAL EQUIPMENT COMPANY.
By considering the key failure modes one can learn ways to improve day-to-day service parts quality management. The objective is to design a new service parts management system that is robust to key failure modes15
. Recognizing that many new process introductions can be iterative in nature, pilot runs are carried out after an initial design. In this manner, feedback on the new process is gathered and incorporated quickly. The demonstration of a short-term success can also go a long way towards winning over the key people in the organization that have to be convinced for long-term implementation.
Finally, in order to integrate a new process into the existing organizational infrastructure it is necessary to consult with management to see where the new ideas fit in. By meeting with key director level managers, the process is fine tuned so that it can meet the needs of the organization without creating any redundant procedures or processes in conflict with existing systems.
In this chapter, three key failure modes in the existing quality system are examined. First, the difficulty presented by a flat pareto of failures is considered. Second, the challenge of
incorporating the voice of the customer into prioritizing factory improvement work is explored. Finally, the importance of establishing clear ownership for quality issues is discussed.
3.1 Failure Mode 1: Flat pareto
Data summary by part number does not reveal a critical few
In order to understand the usefulness of the quality defect management system (QDMS) data in driving improvement activity, a data sample is considered in an effort to determine what the top problems are. The first step in analyzing the QDMS data is to sort the data by part number to see if any particular parts stand out as problem parts. This is an effort to see if the 80/20 rule, which implies that 80% of the problems are caused by 20% of the parts, could be applied to CAPITAL
"5 Implementing Six Sigma: Smarter Solutions Using Statistical Methods, Forrest W. Breyfogle, John Wiley and Sons,
EQUIPMENT COMPANY service parts quality management6. If it does, then by focusing
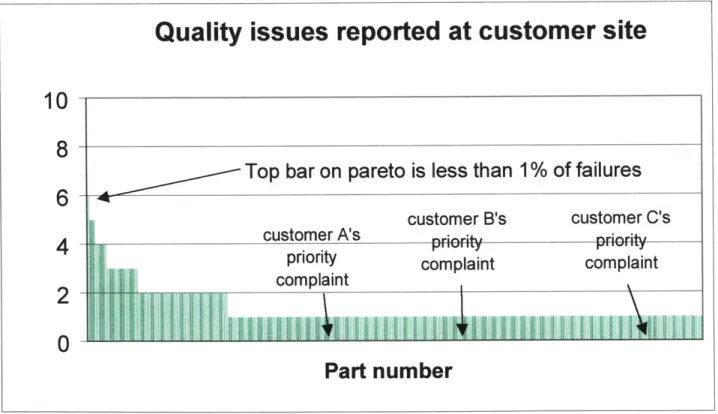
resources on a small portion (20%) of the trouble part numbers, the majority (80%) of the problems can be eliminated. Only the failures that are discovered at the customer site are included this data set, because those failures are the most damaging. The initial data summary is shown in Figure 3.1. A bar for each part number that failed is shown; the height of each bar indicates the number of failures for a given part. Normally we would expect to see a small number of bars that account for the majority of the total failures However, in this environment a critical few part numbers do not drive the results: the top bar on the pareto accounts for less than 1% of the failures. In this example, solving the top part quality problem would likely only make a small improvement in the total quality picture.
Figure 3.1: Pareto analysis by part number
Quality issues reported at customer site
10
8
Top bar on pareto is less than
1
% of failures
customer B's customer C's
pnotycomplaint complaint
complaint
0
Part number
Results reflect unpatterned, non-repeating failures
The distribution of the data in which a high number of part numbers each appear only once is due to the non-repeating and non-reoccurring nature of the failures. Consider the example of an electrical power box (controller) built at the CAPITAL EQUIPMENT COMPANY factory. The
controller will generally have a wire harness, power supply, printed circuit board, and an assortment of other electrical connectors used to integrate the assembly. If this mechanism fails in the field it is difficult to identify immediately what the root cause of the problem is. Suppose that we do find that the root cause for this controller failure is that an operator assembled one of the components on the circuit board backwards. Unfortunately, this particular step (for example: soldering resistor number 20 onto the PCB) is one of perhaps hundreds of steps used in assembling the entire controller box. Other similar failures for this particular part (controller) can be due to other manufacturing steps and involve other parts. Therefore, it is difficult to separate and pinpoint the root causes, because the end failures are often very unclear or non-repetitive. This makes systematic troubleshooting and data analysis unwieldy.
More data or better data will not eliminate the flat pareto
More data or better data will not eliminate the flat pareto. The addition of more data to make a complete data set is likely to simply add across the entire distribution but retain the flat distribution shape. Part numbers that did not appear in an original data summary may now appear on the expanded data summary, only to expand the tail of the pareto. More importantly are the locations of events of particular concern to customers, as marked on Figure 3.1. These three different customer incidents are completely unique events on different part numbers; these failures are acute sources of pain for CAPITAL EQUIPMENT COMPANY customers but do not appear as candidates in a frequency pareto analysis.
High-level data grouping does not result in actionable data
It is natural to respond to the flat pareto by attempting to unflatten the pareto. By selecting different sub groupings for data it is possible to have more occurrences in each category. Thus, if breaking down the data by part number does not lead to identification of a critical few, then perhaps breaking down the data in another way will be more useful.
Building on the existing service part manufacturing process, the data is grouped into much larger buckets. Each event in the database is assigned a root cause (i.e. design, supplier, etc.) by reading the problem statements and then inferring the root cause for each case. For example, the problem statement might be: "Wire was not long enough to connect power supply to chassis." This type of problem statement implies that the design was inadequate for reliable manufacture, and the failed part is labeled a design problem. Unfortunately many of the cases are not this clear; many descriptions for example, merely state that the part failed, and the root cause could have been
design, manufacturing, or even the supplier depending on which part in the assembly causes the failure. In these cases multiple root causes are assigned to a single part event. Even if the descriptions are more thorough, it is still difficult to assign a root cause without serious
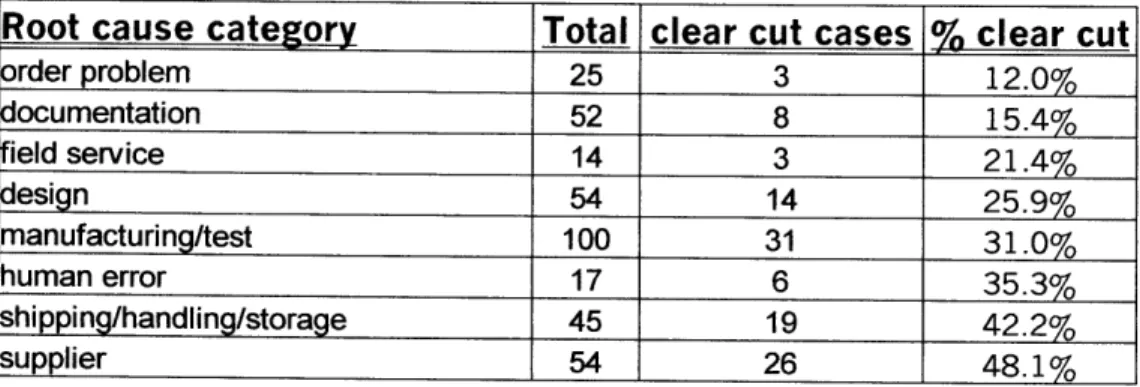
investigation. This demonstrates that resources are required to effectively determine the root cause. Once the root cause is determined then more resources are required to actually solve the problem. Even with intense investigation, the lack of traceability makes it difficult to ultimately determine what really happened. To make the categorization shown in Figure 3.2 as accurate as possible categorization is made with the assistance of a field service expert17. The total column shows the total number of part problems associated with a given root cause category. The number of clear-cut cases shows the number of times that the root cause assignment was assignable to only one category for a given part. Note that the numbers have been disguised and do not reflect actual performance measures.
Figure 3.2: Higher-level grouping does not help
Root cause category Total clear cut cases % clear cut
order problem 25 3 12.0% documentation 52 8 15.4% field service 14 3 21.4% design 54 14 25.9% manufacturing/test 100 31 31.0% human error 17 6 35.3% shipping/handling/storage 45 19 42.2% supplier 54 26 48.1%
There is quite a bit of uncertainty in assigning the root cause up front as shown by the low number of clear cut cases. It is easier to assign problems to a supplier, because it is normally clear when a supplied component fails on an assembly. A problem such as documentation is
understandably unclear, because if a part fails it is easy to assume that documentation was a possible cause but very difficult to prove beyond a doubt that documentation is the primary cause for the problem.
The key observation about this data is to understand that grouping the data into larger buckets might reveal some clear problems but does not lead to specific action. This is because each root cause category is actually made up of many related root causes that each requires separate
investigation. This distributes the focus from one root cause category across many different root cause investigations. Therefore, the data described above is at too high a level to be useful to the daily worker who needs to know specifically what to work on.
For instance, recognition of the fact that design errors and supplier problems might be responsible for 30% of the defects reported in the field does not give rise a specific action plan. CAPITAL EQUIPMENT COMPANY already knows that design and supplier issues can create problems at the part level, and has programs in place to improve design for manufacturing and supplier management aimed at eliminating the root cause for the quality problems.
Mid-level data grouping does not clarify prioritization
It is clear that the low-level part number and high-level sub-grouping is not entirely helpful. The next course of action is to try a more intermediate level of grouping. In order to test this rationale the data is grouped by supplier. In the CAPITAL EQUIPMENT COMPANY business operating system every part is assigned a supplier code that indicates the supplier for the particular part. In addition there is a flag for each part in the operating system that indicates whether it is a manufactured or supplied part. Analyzing the data by supplier can be helpful, because many
suppliers make only one type of component. For example, if supplier A supplies ceramic parts, then if supplier A has many defects written against it then this may point to a problem with how ceramic is manufactured, packaged, or delivered. All data from the original data set is grouped by supplier, with the results shown in Figure 3.3.
Figure 3.3: Subgroup by supplier
Quality issues reported at customer site
10-
8--
Top
bar
on
pareto is still
less
than 1% of total escapes
M
6
_---Each event on the pareto can be a multiple part number or multiple root cause issue0
4
0-Supplier
Figure 3.3 reveals that the pareto is still flat, and there is no improvement in determining the critical few problems to focus on. In this example, the suppler that accounts for the most defects is still only responsible for less than 1% of the total defects.
Need a simplified system for allocating resources
Now consider the six defects generated by one supplier, shown in Figure 3.3. In the case of a printed circuit board supplier, the six defects could be spread across five different part numbers that have five different manufacturing processes and four different root causes. This is often the case for PCB manufacturers and other manufacturers for components such as valves and pumps. Occasionally there will be a situation where it is possible to link each failure to a relatively common root cause. For instance, perhaps the packaging for a commodity is inadequate, causing parts to crush during shipment. In this case it is possible to improve the handling or packaging so that breakage is reduced. However, if manufacturing is not readily traceable, the root cause analysis is very difficult.
Keep in mind that defects are reported by part number and span across all product lines. The usage for many parts is infrequent so that even if a part is known as a trouble part there may not be production activity on that part for months. This causes a time delay between defect reporting and the opportunity to work on the problem. The time delays in the manufacture, use, report, and fix process for service parts tend to make it difficult to focus on a root cause and hard to know whether a fix has succeeded.
Service part usage is generally relatively low volume and low frequency for a given spare part. If one describes customer spare-part usage based on the frequency of failures or the
distribution of time intervals between failures then there is not a big enough sample for traditional statistical analysis, making usage patterns difficult to forecast and plan for.
One can possibly assume a Poisson distribution for spare part usage, although the parameter may be difficult to estimate. The Poisson distribution holds under two conditions: 1) the
probability of an event occurring in a very small time period is negligible; and 2) the probability of events occurring in different incremental time periods are independent". At CAPITAL
EQUIPMENT COMPANY it is difficult to use statistics to make decisions for service parts,
because for many parts usage is so low that there are not enough data points to infer results with any degree of confidence.'9
The purpose of data analysis is to be able to efficiently target resources. The goal of targeting resources is correct, but the method can be improved by simplifying data analysis. Based on the flat pareto failure mode it is clear that a simplified prioritization for allocating resources is needed.
3.2 Failure Mode 2: No structured customer driven prioritization Definition of the customer
Based on the previous section it is clear that the quality data is difficult to work with. There is a definite need for a simplified prioritization system. Keep in mind that all of the analysis
discussed in the previous section has been performed in the absence of any customer input. In the context of this research the customer is defined as the internal field service organization, which is the group that is largely responsible for the tactical execution of tool upgrades, service part installation, and planned maintenance. One might be tempted to assign the customer role to the
18 Probability and Statistics Course Notes, Arnold Barnett of MIT Sloan School of Management, 2000
19 Normally 30 data points are considered adequate to define a statistical distribution. This would make it difficult to
final integrated circuit manufacturer, because they are the ultimate tool owners who are directly impacted by poor service part quality. In this situation the business need is for one voice for prioritizing, and field service should be the one voice, because it is directly in the line of fire from the fab customer.
Customer needs
At this point, one may ask what the customers needs are. Three critical customer needs can be identified. First of all, the customers want zero factory escapes. This means that the field
service engineer that receives the part is expecting that the part will work and is the right one for the job. Quality issues are inevitable, but there should enough checks built into the manufacturing
processes such that problems are caught and confined at the factory. Secondly, the customer
demands a quick response. Demand for service part replacement by nature can be unexpected. It is critical that the parts are delivered right away, because equipment downtime is very expensive to the integrated circuit manufacturer. Since the field service engineer is normally at the customer site representing CAPITAL EQUIPMENT COMPANY, they are under substantial pressure from the chipmaker to get the tool up and running. Finally, what customers really want is a voice into the factory, and want to feel that their voice is being heard. With customer needs clearly defined, quality issues that the factory works on can be prioritized.
Difficult to assign priority
Currently, the CAPITAL EQUIPMENT COMPANY quality group gathers the defect data that is reported both internally (factory) and externally (field service). After collecting the data, there is an attempt to prioritize the most important issues for the factory to work on. Sometimes priority is driven by the fact that the customer requires feedback on a particular issue. This can be specifically indicated on the web-based QDMS (quality defect management system) form or it can be escalated and designated as a customer complaint where feedback to the customer is
automatically required. Of course there are non-data driven customer complaints that arrive as phone calls and emails that are not even captured in the QDMS database.
There are methods of manually adjusting the data to parse out priority. The CAPITAL EQUIPMENT COMPANY factory can analyze the cost of the failed parts, the frequency of failure, the criticality of the part, and a host of other factors that can help justify working on a particular part or problem. Unfortunately pareto analysis of different data cuts is unreliable as described earlier,
TQM methods for assigning priority
There are several techniques for building a matrix for prioritizing projects in the TQM literature. One approach looks at evaluating how difficult the problem is to solve. For instance, in one dimension it might be important to determine who is involved (one person or many) and in another dimension it is important to consider whether a simple equipment adjustment is required or if a more complicated adjustment such as methods or human behavior is required. This can help determine how difficult a problem is to solve. Once the difficulty of problem solving is understood then problems can be prioritized by: ease of data collection, ease of potential implementation, urgency/impact, and speed of solution. The high priority problems to work on are the ones that are easy to collect data for, have easy solutions to implement, have high urgency, and can be resolved quickly. Similar approaches could certainly be applied to managing quality issues.
Of course it is possible to set a system like this up, but it would be a time consuming task, and in the end it is most important that the customers are satisfied. The considerations for
prioritizing listed above are subject to ambiguity that would have to be managed, while focusing on customer priorities helps leads to clear action plans.
Prioritize by frequency, cost, and impact on customer
Somehow the data has to be weighted to accurately reflect the most important service part issues to work on. The frequency of part failure should be factored into prioritizing factory work. In addition to frequency, cost is another objective factor that should be considered when prioritizing factory activity. Standard cost is the total raw material cost of the supplied parts required to build the assembly. By combining the objective factors of frequency and standard cost there can be clearer prioritization. Thus an expensive part that fails twice would outweigh the inexpensive part that fails several times. Of course, there are other financial considerations; the cost for rework, machine downtime, or labor cost could also be factored into the total cost, but even these measures contain some subjectivity. The concept of combining the frequency and cost is clear, but that still leaves the voice of the customer as a missing input. Ideally the data should be weighted as a function of frequency, cost, and impact on customer.
20 A New American TQM: Four Practical Revolutions in Management, Shoji Shiba, Alan Graham, Dave Walden,
Factory and field alignment is critical
The greatest risk in not capturing the voice of the customer in prioritizing factory work is the danger of working on the wrong issues. Even though the failure history and cost of a part may indicate that it should be one of the most important issues to resolve, it may not be a top concern for the customer. This is not to say that working on the most frequent and expensive failures is not advisable, but it is important to make sure that the most important problems in the eyes of the
customers are being addressed. In reality, deciding what to work on depends on the capacity that an organization has to handle the workload. Most businesses of any kind face more work than they can handle at any given time. Therefore, certain tasks will never get done and some issues will never be resolved. The important thing to consider is that at a minimum the CAPITAL
EQUIPMENT COMPANY factory should at least be working on the very top customer issues. Overall the results are not driven by a critical few, but individual customers may have a perceived critical few. Since the results will not point to a critical few based on the flat pareto, CAPITAL EQUIPMENT COMPANY can make it easier on the entire quality system by formally soliciting customer input to the prioritization process.
3.3 Failure Mode 3: Unclear ownership
Clear ownership can reduce response cycle time to the customer
Complex problems require the expertise of many people. The more people that are involved in solving a problem, the less clear ownership becomes. The challenge in coordinating complex problem solving is that there is always critical information or action required to keep the process moving forward. Without clear ownership it is not clear whose responsibility it is to move the investigation forward, therefore making a quick response difficult. With clear ownership for quality issues the cycle time for responding to the customer can be reduced. The key is to remove the obstacles to completing the problem resolution process. Clarifying ownership to ensure that progress is always moving forward can reduce the cycle time to the close customer complaints.
Ownership challenges
First of all, the assigned area for the problem may not be the area fully responsible for the root cause solution. It is difficult to assign a factory owner for a problem before a root cause
investigation is conducted. In some cases the original assigned owner or area is not responsible at all. For example, in one case a particular assembly was not completely assembled before it was shipped to the customer. The assembly sustained substantial damage in transit and was unusable when it arrived at the customer site. At first glance, the investigation was assigned to the shipping area. However, as the investigation unfolded it was clear that the factory cell did not adequately finish the assembly and thus were the group primarily responsible for fixing the problem.
Secondly, the owner assigned to the problem is normally not the individual that will carry out the work required to solve the problem. Once ownership is assigned, the owner, usually an area manager, will task a team of people to work on it. Teamwork is an excellent way to solve
complicated issues, but for many customer complaints and other issue resolution situations there may not be a dedicated team leader. In this way, ownership is distributed across many people, creating a situation where many people are working on the problem, but no one really owns the problem. This is a potentially bad situation, because progress cannot be achieved without someone driving the activity and working through the details that impede progress.
Furthermore, even if it is clear which cell area is responsible, it still might require the coordination of many groups to fully address the problem. Sometimes other CAPITAL
EQUIPMENT COMPANY groups such as engineering or even the supplier are involved in solving a problem. This complexity in the products and processes that CAPITAL EQUIPMENT
COMPANY manages is reflected in the difficulty of assigning a single clear owner for specific quality problems.
Finally, the issue of closure is difficult. Customers will not be satisfied if there is either no feedback on issues or if feedback is inadequate. Inadequate feedback may be that the corrective action to fixing a faulty supplied part was simply to ask the supplier for new material that worked. This type of solution would not necessarily address the root cause and is similar to firefighting.
Coordination complexity combined with unclear ownership slows progress
Experience gained by working through three different quality issues at CAPITAL
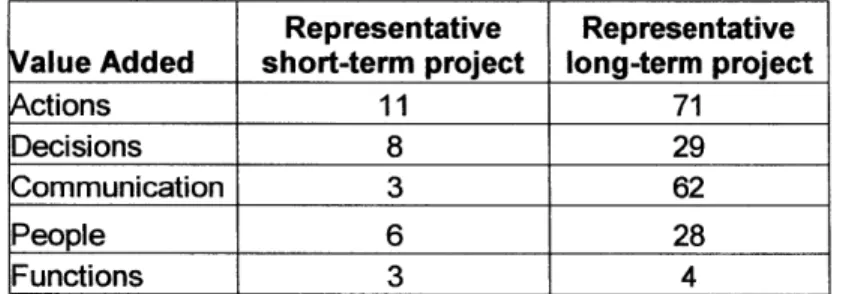
EQUIPMENT COMPANY makes it clear that there are a multitude of details to keep track of when addressing any particular quality problem. This makes coordination of activities very challenging. Figure 3.4 helps shed light on this assessment. The number of value-added activities that are
required for completing a project are shown. The short-term column is an illustration of the activities required for resolving a simple short-term customer complaint. The data in the long-term column comes from an actual project to standardize and improve packaging for a commodity across several suppliers. A definition for each value added activity is given below:
Figure 3.4: Value-added activities required for resolving quality issues
Representative Representative
Value Added short-term project long-term project
Actions 11 71
Decisions 8 29
Communication 3 62
People 6 28
Functions 3 4
Action - A step required to make progress towards completing the project (i.e. writing a revised packaging specification for the suppliers to reflect CAPITAL EQUIPMENT COMPANY
requirements).
Decision - A choice made during the project that is critical for clarity and/or for moving forward (i.e. allowing the suppliers discretion over the thickness of packaging material).
Communication - A mandatory event in which critical information is transferred (i.e. voice mailing or emailing to a supplier in order to set up a conference call).
People - Any individual who has been involved in the project at any level is added to the total. Functions - The number of different departments (i.e. engineering, purchasing, etc.) that are required to advance the project.
The following description helps illustrate a value-added action during a typical project. In the midst of a project at CAPITAL EQUIPMENT COMPANY, the team decides that the CAPITAL EQUIPMENT COMPANY logo should be printed on the new supplier packaging. We approach our suppliers about this, and it turns out that one supplier requires camera-ready artwork and that the rest of the suppliers only need a graphics file of the CAPITAL EQUIPMENT COMPANY logo
must work closely with the marketing communications department, and the whole process takes almost two weeks. This demonstrates how seemingly trivial tasks are not always so simple and that someone has to drive the actions to completion.
The value added decisions present the biggest roadblocks to progress. For example, after two months of work one of the key suppliers finally delivers a quote for new packaging. The supplier says that it will absorb the cost for close to 75% of the parts, because only simple packaging changes are required. For the other 25% of the parts the special box that is required might cost several dollars per piece. Obviously a price increase of several dollars per item is not trivial, so a decision has to be made. The CAPITAL EQUIPMENT COMPANY team knew long beforehand that some of the parts require a box, but CAPITAL EQUIPMENT COMPANY had no choice but to wait until the supplier was able to specifically quote a cost impact before any decision could be made. The team faces a decision that could potentially stop all progress. In this case the team decides to move ahead with new packaging for the simple parts, and in the meantime to search for a cheaper material to make the box out of. This encourages progress and clearly addresses the situation around the expensive packaging. These types of decisions occur often in a complicated work environment and present steep roadblocks to progress.
Even in the case of simple customer complaint, someone has to be responsible for filling out the corrective action report and performing the legwork required in resolving a problem. The complexity of the environment combined with unclear ownership mean that even the smallest detail can destroy any efforts to effectively close a problem. Consider a situation where an out of
specification lot of parts from a supplier reaches CAPITAL EQUIPMENT COMPANY and some parts are subsequently delivered to the field. The supplier may easily be able to fix this type of problem, especially if it is only a machining issue. However, it is important to know the condition of the existing stock at CAPITAL EQUIPMENT COMPANY. The problem might be resolved from the supplier's point of view, because future deliveries will be in spec. However, if the proper precautions are not taken to verify the condition of the existing inventory at CAPITAL
EQUIPMENT COMPANY then efforts can be wasted the next time the part is shipped from CAPITAL EQUIPMENT COMPANY to a customer. To make matters more complicated there could still be out of spec inventory at field service locations that needs to be purged. This is an example of the attention to detail that is required for effective resolution of quality issues.
Coordination complexity results from high task interdependence2 2
It is readily apparent that the trivial tasks are not always so easy to complete, because solving quality problems is highly task interdependent. All three types of task interdependence are evident at CAPITAL EQUIPMENT COMPANY: sequential, reciprocal, and pooled. Sequential task interdependence occurs when certain tasks have to be performed in a specific order for the work to be completed correctly. Reciprocal task interdependence occurs when specific tasks require a reciprocal action for completion. Finally, pooled task interdependence occurs when
several different tasks can be performed in parallel in order to complete a larger task. The previous paragraphs in this section describe the work environment at CAPITAL EQUIPMENT COMPANY
as a constantly changing mixture of all three types of task interdependence.
It is clear that clear ownership for quality problems will result in faster execution of coordinated problem solving, which is important in delivering a quick response to the customer.
3.4 Summary of discovering the failure modes
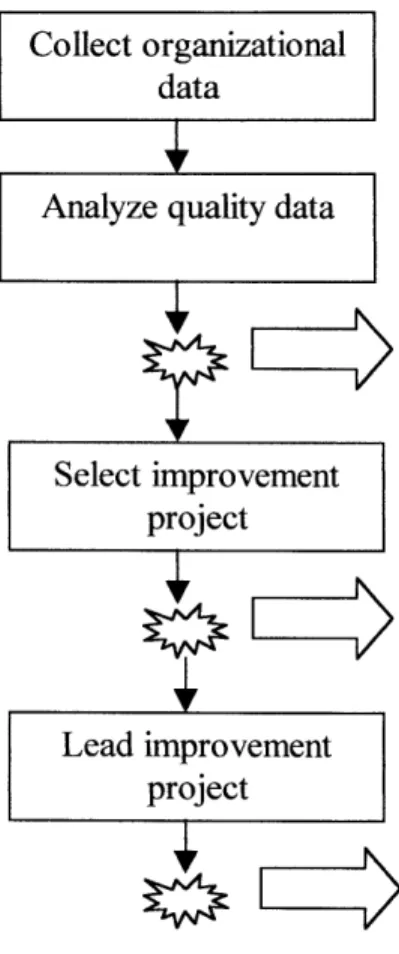
The steps, which have been used to understand the organization and discover the key failure modes in the service parts quality system, are summarized in Figure 3.5. Through these steps, three key failure modes have been identified.
The first step is to collect data about the organization. Interviews are an effective first step at discovering what the current situation is in the organization. For a more specific view on how the organization operates, following several quality case studies through the system can provide insight into how quality is managed. Finally, living the process helps build credibility and develop
relationships with the front line workers. By actually performing someone else's job one can experience first-hand the difficulties in day-to-day organizational life. Throughout this process, small experiments play an instrumental role, both in making discoveries and in validating findings.
After mapping the process and working with quality data for several weeks the first key failure mode came to light (indicated by the small explosion icon in Figure 3.5): CAPITAL EQUIPMENT COMPANY needs a simplified prioritization for allocating resources. Based on experience in selecting quality improvement project, a second quality failure mode was identified: the concerns of the customer in prioritization are not systematically accounted for. Recognizing that listening to the customer is critical for long-term business success, it is natural to use customer
input to help make prioritization easier. Finally, the third failure mode of unclear ownership was discovered through experience gained in the execution phase of an example project.
Figure 3.5: Discovering the failure modes
Collect organizational data
Analyze quality data
Select improvement project Lead improvement project ~±~LZZZ2 -Interview -Case study -Live the process
Failure Mode 1: Flat pareto
Business Need: A simplified prioritization system for allocating resources
Failure Mode 2: No structured customer driven prioritization Business Need: Customer driven prioritization
Failure Mode 3: Unclear ownership
Business Need: Faster execution of coordinated problem solving