HAL Id: hal-00256818
https://hal.archives-ouvertes.fr/hal-00256818
Submitted on 18 Feb 2008
HAL is a multi-disciplinary open access
archive for the deposit and dissemination of
sci-entific research documents, whether they are
pub-lished or not. The documents may come from
teaching and research institutions in France or
abroad, or from public or private research centers.
L’archive ouverte pluridisciplinaire HAL, est
destinée au dépôt et à la diffusion de documents
scientifiques de niveau recherche, publiés ou non,
émanant des établissements d’enseignement et de
recherche français ou étrangers, des laboratoires
publics ou privés.
observations of planets and satellites (1997-2007)
J. E. Arlot, G. Dourneau, J.-F. Le Campion
To cite this version:
J. E. Arlot, G. Dourneau, J.-F. Le Campion. An analysis of Bordeaux meridian transit circle
observa-tions of planets and satellites (1997-2007). Astronomy and Astrophysics - A&A, EDP Sciences, 2008,
484, pp.869. �hal-00256818�
Astronomy & Astrophysicsmanuscript no. bordeaux-transit-v2 ! ESO 2008c January 28, 2008
An analysis of Bordeaux meridian transit circle observations of
planets and satellites (1997-2007)
J.E. Arlot
1, G. Dourneau
2and J.F. Le Campion
21 Institut de M´ecanique C´eleste et de Calcul des Eph´em´erides, 77, avenue Denfert Rochereau, 75014 Paris, UMR 8028 du CNRS, USTL,
UPMC
e-mail: arlot@imcce.fr
2 Universit´e Bordeaux 1, Observatoire Aquitain des Sciences de l"Univers, Laboratoire d"Astronomie de Bordeaux, UMR 5804 du CNRS, 2,
avenue de l"Observatoire, 33270 Floirac
e-mail: dourneau@obs.u-bordeaux1.fr Received ; accepted
ABSTRACT
Context.Meridian transit circle observations of the planets and their satellites are regularly performed for ephemerides improvement. Some have been made in Bordeaux observatory during the period 1997-2007.
Aims.This paper presents these observations and makes an analysis of the data in order to determine the accuracy of the observations, their interest for dynamical purpose and a comparison with the dynamical models of the observed objects.
Methods. For the determination of the positions of the planets, the observations of their satellites have been used, providing pseudo observations of the planet. The method is tested.
Results.The results show the interest of continuing this type of observations. Residuals show what ephemerides have to be improved using the present data.
Key words.planetary ephemerides – meridian transit circle – astrometric observations
1. Introduction
Bordeaux observatory continues to perform meridian transit circle observations and has included in its program of obser-vations some solar system objects. Since it appears that more solar system objects observations are needed and that the ob-servations performed with other transit circle instruments are very useful, we wondered if it was worth to continue our ob-servations. The analysis of the reduction and of the comparison of observational data with ephemerides and with other obser-vations made during the same period of time will answer this question.
2. The observations
2.1. The instrument
The Bordeaux meridian transit circle is a 20cm diameter refrac-tor with a 2.37m focal length. The derived scale of the instru-ment is 87 arcsec/mm. The Bordeaux observatory is located at the following geodetic coordinates: Longitude = 0 deg 31 min 39 sec W, Latitude = 44 deg 50 min 7 sec N and Elevation =
Send offprint requests to: J.E. Arlot
73m. The Bordeaux meridian circle was fully automated from 1984 (Requieme and Mazurier, 1991). It was equipped with a photometric micrometer until 1994 when it received a CCD camera (512x512 pixels) for tests and from 1996 the definitive camera (1024x1024).
A two-stage thermoelectric Peltier unit is used to cool the Thomson 7896M CCD detector below - 40◦C in order to limit the resulting dark noise to about 65e-/s. The size of the pixels is 19 µm x 19 µm, corresponding to 1.65 arcsec x 1.65 arcsec in the sky. In declination, the field of the CCD chip is 28 arcmin. In right ascension, the transit time is 112s/cosδ for stars with a declination of δ. This time corresponds to the exposure time of the instrument when used in the drift scan mode.
Drift scan mode was used instead of classical stare mode. The scan mode appeared necessary in view of the characteris-tics of the transit observations and it allows to observe every night a greater number of stars. Also, the rather long exposure time (about 112s) improves the limiting magnitude up to 16. As stars with a magnitude of 8.5 can be observed without sig-nificant pixel saturation, the dynamical range of the CCD unit appears to be about 7.5 mag. The strips observed in scan mode with the CCD detector are narrow in declination (28 arcmin)
and can be much wider in right ascension, up to several hours. Oppositely, the scan mode presents some drawbacks, as the dis-tortion of star images which can reach a critical level at high declinations. Stars are rejected when their images present an elongation in right ascension six times higher than in declina-tion. As a result, no observation can be done for declinations above 78 degrees. This is not a real problem for the observa-tion of solar system objects orbiting near the equator.
Both GG495 and BG38 filters are used to select a reduced bandwidth of 5200-6800 Å, with a central wavelength of 6050 Å, so as to limit the chromatic refraction to about 0.04 arc-sec tanz. Today, the Bordeaux observatory meridian circle re-mains one of the last instruments of this type in regular opera-tion with the FASTT in Flagstaff (Stone, 1996), the CMASF in San Fernando, Argentina (Muinos et al. 2006) and the Valinhos meridian circle in Brazil (Viateau et al. 1999). For more de-tailed information about the Bordeaux meridian circle, refer to Viateau et al. (1996).
2.2. The program of observations
The regular observations of solar system objects as Uranus and Neptune have begun in 1982 with a photoelectric microme-ter (Rapaport et al. 1987). In 1996, with the automated CCD camera, we have continued this program in observing new objects as Pluto and the main satellites of Uranus as Ariel, Umbriel, Titania and Oberon, as well as Triton, the satellite of Neptune. Moreover, some of the major satellites of Saturn: Titan, Hyperion and Iapetus were observed from 1998. The planet Saturn was not observed, because of its too high bright-ness. Also, the image processing appeared not to be efficient enough to derive an accurate position of the planet Saturn from its irregular shape, due to the vicinity of the rings. Some results of the first observations of Pluto and Saturn"s satellites were obtained by Rapaport et al. (2002).
Further the regular observations of planets and satellites, the Bordeaux meridian circle is currently involved in several other observing programs. In the recent years, the main of these programs was Meridien 2000, planning a systematic ob-servation of the Bordeaux zone of the Astrographic Catalogue (11 deg ≤ δ ≤ 18 deg) for more than 3 years. A very con-sistent catalogue of positions and proper motions of all stars up to magnitude 15 has been derived (Rapaport et al., 2001; Ducourant et al., 2006; Rapaport et al., 2006). Other observ-ing programs concern the asteroids, either to improve their masses (Viateau and Rapaport, 1996) or the accuracy of the prediction of star occultations from last minute observations. More recently, another program involving some extragalactic radiosources as blazars, was developed in order to contribute to improve the ICRF system (Charlot and Le Campion, 2004). 3. The reduction
3.1. Image processing
The first step of the image processing is the extraction of the sky background. Two methods may be used. The first one con-sists in fitting the background to a polynomial of degree from
0 to 3. This is a fast method but it can only be used for mod-erate gradients. In the case of planetary satellites, located in fields with stronger gradients, the median filter method is pre-ferred. This method consists in searching the median value M of a square of 15 x 15 pixels centered on each pixel and to subtract M to the value of the central pixel.
After the extraction of sky background, the identification of objects is processed from the comparison of each pixel to the standard deviation σ of the residuals of the pixels for each col-umn. An object is identified when 2 consecutive pixels present residuals greater than 3 σ. Two objects can be separated if their distance is greater than 5 arcsec. Then, the photo centre of the images is computed from a two-dimensional Gaussian fit. Bright objects with magnitudes lower than 8.5, as some of the solar system objects involved in our observing program, present images with pixels which may be saturated. Then, such saturated pixels are rejected in the Gaussian fit, so as to limit possible consequent bias in the determination of the photo cen-tre.
3.2. Astrometric reduction
For each star of each individual strip observed each night, the following system of equations below is used to rely the cata-logued right ascension αR, declination δR, and magnitude VRof
reference stars to their rectangular measured coordinates (x, y) expressed in pixels and to the measured flux Φ in encoder step units so as:
αR= α0+a1x + a2(y - y0) δR= δ0+b1(y - y0) + b2x + b3Φ VR=V0 2.5 log Φ + cx
αRand δRare the catalogued positions of stars, reduced to
the epoch of observation from their proper motions. α0 repre-sents the local sidereal time at the instant of the beginning of the strip, and δ0 the declination of the centre of the strip y0. The flux term in declination b3Φis used to recover the exces-sive shift of charge in the CCD for the images of bright ob-jects. As this effect appears to be negligible in right ascension, no flux term is used in this coordinate. The constants a1, a2, b1, b2, b3, V0and c, in equations above, are determined by the least-squares method, as well as α0and δ0, also adjusted to ob-servations. Then, the constants are used to determine the new positions and magnitude of the reference stars and of the other non-catalogued objects as secondary stars, planets and satel-lites. A preliminary catalogue is obtained from the mean posi-tions of all the stars common to the different strips, including secondary stars. The positions of this preliminary catalogue are reintroduced in equations above for a second astrometric reduc-tion. The convergence of the constants generally occurs after 5 successive iterations of this procedure. In order to limit atmo-spheric effects which can affect the observed positions, a curve is fitted on the residuals of each night of observations by the B-spline method (Viateau et al.1999). The used reference cat-alogue is Tycho 2 providing data with an accuracy better than 60 mas for positions and 2.5 mas/year for proper motions (Hog et al.2000). So, the positions of solar system objects observed by the Bordeaux meridian circle have a mean accuracy of about
J.-E. Arlot et al.: Bordeaux meridian transit circle observations 3
Fig. 1. Chromatic departure in declination vs (B-V) index, expressed in mas (δ between 11 and 18 degrees).
60 mas. They are topocentric and given in the ICRF system and no chromatic correction has been made.
We made several attempts to evaluate the chromatic effects. The first one was derived from the previous work (Rapaport et al.2001) made in the range of declination between 11 and 18 degrees of the M2000 catalog. Fig. 1 visualizes the de-rived chromatic departure versus (B-V) index. For this range of declination, Fig. 1 shows that chromatic departure is un-significant, as always under 20 mas, for objects with (B-V) index between 0.5 and 1, as most of solar system objects. In the recent years, Saturn"s satellites were located at a declina-tion close to the M2000 zone. So, their posideclina-tions presented in this paper must be unsignificantly affected by chromatic effect and do not need any correction. But Uranus, Neptune and Pluto were located at a negative declination from -10 degrees to -15 degrees during the recent period of observations. As chromatic effect is increasing with the zenital distance, the positions of these objects and their satellites can be affected with an higher departure. Due to their low (B-V) index, we have shown, by extrapolating the curve given in Fig. 1 to lower declinations, that the planets Uranus and Neptune remain only affected with very slight chromatic effect under 20 mas. Only their satellites Titania, Oberon and Triton, as well as the dwarf planet Pluto, due to their higher (B-V) index, can be affected with a signif-icant higher chromatic effect which remains lower than posi-tional errors. A second recent evaluation of chromatic effect involving much more stars, including low declination ones, has shown that this effect should be lower than 10 mas, whatever the declination and the (B-V) index of solar system objects. This last evaluation, obtained from real observations, appears to be more realistic than the first one which was derived from an extrapolation of observational effects. Finally, no chromatic correction has been made. Anyway, this point still remains un-der consiun-deration for the future.
4. The data obtained
The observations were carried out through the program of ob-servations of the Bordeaux transit circle. Planets and their
satel-lites were included in the program when possible. We did not include all the objects for several reasons. For some planets, it was unnecessary to make such observations because of the large sets of modern data (radar or from space probes) avail-able, sufficient for dynamics purpose (Mercury, Venus, Mars). For some planets such as Jupiter and Saturn, and some satel-lites, such as the Galilean satelsatel-lites, the magnitude did not al-low the observation. Anyway, the accuracy of the transit circle observations of the planets Jupiter and Saturn themselves will not be sufficient for dynamics purpose. We were not able to observe the Galilean, but we observed the Saturnian satellites. The good results obtained will lead us to solve the technical problems in order to observe the Galilean satellites. We will see further that the positions of the satellites may be used in order to propose pseudo-observed positions of their primary that is very useful for Saturn: we observe a satellite, then we calculate the theoretical positions of the center of mass of the system and get a pseudo-positions of the planet. The error on such a posi-tion is the one of the dynamical model of the satellite which is much smaller than the error on the measurement of the position of the center of mass of the planet itself. We provide in Table 1, the main characteristics of the observed objects, in Table 2, the number of observations made, and in Table 3 the rms of each series of data calculated as follows:
rms = !
Σ(r− rm)2
(N− 1) (1)
where r is the O-C on one observation and rm the mean (O-C) for the series. N is the number of observations. The used ephemerides are DE405 for the planets, TASS for the Saturnian satellites (Vienne and Duriez, 1995; Duriez and Vienne, 1997), LA06 by Lainey and Arlot (2007) for the Uranian satellites and Jacobson (1991) for Triton. It is clear that the quality of the ob-servations depends on the magnitude of the object as shown in Fig. 2. For magnitude larger than 14, the accuracy decreases rapidly as it is obvious in Table 3 for Hyperion and the Uranian satellites. Note that differences appear in right ascension and declination. These differences did not come from chromatic ef-fects but confirm only that a meridian transit circle is more ac-curate in right ascension than in declination.
All the observational data have been published extensively in the Note Scientifique et Technique de l"IMCCE n◦ S089 (Dourneau et al. 2007). They are available at the Web address: http://www.imcce.fr/page.php?nav=fr/publications/nst
Fig. 2. Dispersion of the residuals (in mas) as a function of the V-magnitude. Table 1. Main characteristics of the observed objects
Object mag radius radius phase phase orbital max
at angle defect period elong
opp. km arcsec degrees mas days arcsec
Titan 8.3 2440 0.35 6 13.8 15.9 209 Hyperion 14.2 200 0.03 6 1.3 21.3 254 Iapetus 11.9 720 0.10 6 3.5 79.3 610 Uranus 5.5 24500 1.75 3 34.4 - -Ariel 14.4 580 0.04 3 8.1 2.5 15 Umbriel 15.3 585 0.04 3 8.1 4.1 21 Titania 13.9 800 0.06 3 12.3 8.7 35 Oberon 14.2 760 0.05 3 11.8 13.5 47 Neptune 7.8 25100 1.15 2 15.0 - -Triton 13.7 1350 0.06 2 0.8 5.9 17 Pluto 15.0 1200 0.05 2 0.7 -
-Table 2. Number of observations
Object 1997 1998 1999 2000 2001 2002 2003 2004-05 2006 2007 all Titan - - 14 - 13 - 4 7 12 12 62 Hyperion - - 15 - 11 - 7 8 18 11 70 Iapetus - - 15 - 16 - 9 9 21 14 84 Uranus 18 10 2 - 50 9 26 22 28 - 165 Ariel - - - 2 - - - 2 Umbriel 2 2 - - 1 - 6 2 7 - 20 Titania 14 5 1 - 29 5 14 12 16 - 96 Oberon 13 6 1 - 38 9 20 12 18 - 117 Neptune - - 4 - - - 50 19 29 - 102 Triton - - 3 - - - 48 18 26 - 95 Pluto - - - 23 - - 33 - 56
J.-E. Arlot et al.: Bordeaux meridian transit circle observations 5 T able 3. Rms of the residuals for each se ries of data in mas Object 1997 1998 1999 2000 2001 2002 2003 2004-0 5 2006 2007 all α δ α δ α δ α δ α δ α δ α δ α δ α δ α δ α δ T itan -58 99 -41 101 -58 88 39 121 78 78 53 125 79 106 Hyperion -175 252 -217 344 -257 188 249 360 173 282 219 302 219 302 Iapetus -55 61 -76 78 -53 64 34 95 54 54 66 85 92 78 Uranus 41 87 94 92 15 251 -64 114 85 93 66 135 81 142 83 251 -71 156 Ariel -Umbriel 2 37 155 100 509 -174 210 5 129 320 251 -229 250 T itania 144 1 48 84 48 -217 223 158 115 115 250 104 165 118 135 -155 196 Oberon 153 94 102 174 -262 2 31 113 317 237 269 128 240 227 276 -214 253 Neptune -50 91 -61 77 87 86 93 128 -86 114 T riton -105 236 -122 233 261 308 321 254 -219 251 Pluto -86 209 -111 137 -103 178 T able 4. Mean residuals (O-C) in α and δ in mas Object 1997 1998 1999 2000 2001 2002 2003 20 04-05 2006 2007 all α δ α δ α δ α δ α δ α δ α δ α δ α δ α δ α δ T itan -3 -7 -95 -2 -136 -37 79 -11 99 -77 174 -86 91 -3 7 Hyperion --70 -14 --22 171 -46 310 238 -9 126 -79 146 15 69 36 Iapetus --54 -90 -38 -88 -110 23 94 -72 92 -68 171 -103 71 -72 Uranus -96 -63 -108 -128 -78 69 --104 -123 -76 -179 -81 -87 -129 -226 -102 -144 --101 -129 Ariel -Umbriel 53 94 -8 9 208 --230 -142 -30 93 -100 -80 --121 -40 T itania -128 -5 1 -78 -97 --124 -105 -67 -228 -84 -152 -155 -271 -133 -185 --120 -141 Oberon -125 -18 -122 -73 --186 -69 -77 -318 -198 -143 -160 -281 -109 -218 --154 -142 Neptune --97 -127 --15 -164 -37 -112 -30 -125 --28 -122 T riton --75 -216 --4 -212 14 -181 -32 -237 --10 -213 Pluto --62 -42 --21 -158 --38 -110
5. Comparison of the observations with the ephemerides
We calculated the (O-C) between the observations and the ephemerides in order to see the interest of the observations for the improvement of the dynamics of the observed objects. The figures show the (O-C). Figs. 4 and 6 show the (O-C) in right ascension and declination depending on time and Figs. 5 and 7 the (O-C) of all the observations. Note that the ephemerides are DE405 for the planets, TASS or Do93 by Dourneau (1993) for the Saturnian satellites and LJ86 (Laskar and Jacobson 1987) or LA06 for the Uranian satellites (Arlot et al. 2007).
Table 4 gives the values of the mean (O-C)s for each object and for each opposition. We have to notice that the motions of the planets are slow enough to have a very small variation of the (O-C) over one opposition (a few months) that is not true for the satellites which have a fast motion and then, a variation of the (O-C)s with time over the same period. However, the mean (O-C) for the satellite over one opposition should be very close to the mean (O-C) for the planet. For the Saturnian sys-tem, only three satellites were observed showing similar (O-C)s which should correspond to the one of the planet. Hyperion, the magnitude of which is 14.2, has a worse accuracy due to a bad S/N ratio. For the Uranian system, we find the same sta-tus. Contrarily to the Saturnian system, the planet itself has been observed that confirms that the satellites show similar (O-C) than the planet. Ariel should be excluded because its poor observation history and Umbriel because the bad astrometric results as consequence of its magnitude. For the Neptunian system, Triton"s (O-C)s discrepancy is larger than the one of Neptune and we do not find similar values. For Pluto, system-atic negative (O-C)s seem to appear, as well as for Uranus and Neptune.
In conclusion, assuming that the objects have a magnitude brighter than 15, the observations have an accuracy making them useful for dynamical purpose.
6. Positions of planets derived from observed positions of satellites
The accuracy of the observations of some bright satellites of the planets and the fact that their (O-C)s are mainly coming from the position of the planet, may allow us to make pseudo-observations of the planets through the observation of their satellites. The dynamical models of the motion of the satellites may allow this, since the satellites are orbiting around the cen-tre of mass of the system planet-satellites which is of interest. Note that the direct observation of the planet provides a posi-tion of an unknown point, needing a model to go to this cen-tre of mass. The question is: what theoretical model should be the best for that purpose? Fig. 4 shows the (O-C) of the planet Saturn deduced from the observations of Titan, and Fig. 5, the (O-C)s in right ascension versus declination for all the observa-tions. It appears clearly that the ephemerides DE405 of Saturn shows a systematic offset. Fig. 5 a shows the (O-C)s when us-ing the TASS ephemeris for Titan, Fig. 5b when usus-ing Do93 Dourneau ephemeris for Titan. The offset to DE405 is quite similar, showing the weak impact of the theoretical model of
Table 5. Mean residuals (O-C) in α and δ in mas for the period 1997-2005
Object Bordeaux Flagstaff
α δ α δ
Uranus -120 -130 -10 -20
Umbriel -120 -40 -
-Titania -120 -140 -100 -80
Oberon -150 -140 -130 -100
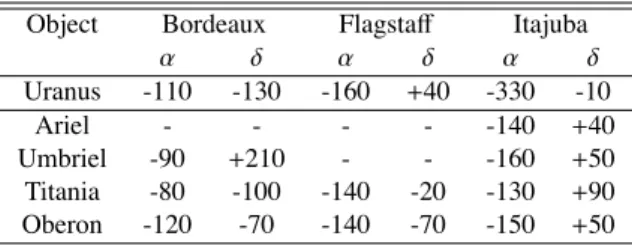
Table 6. Mean residuals (O-C) in α and δ in mas for the 1998 opposi-tion
Object Bordeaux Flagstaff Itajuba
α δ α δ α δ Uranus -110 -130 -160 +40 -330 -10 Ariel - - - - -140 +40 Umbriel -90 +210 - - -160 +50 Titania -80 -100 -140 -20 -130 +90 Oberon -120 -70 -140 -70 -150 +50
the motion of the satellite on the making of the pseudo ob-servations of the planet. Contrarily, the impact of the chosen satellite used for the making of the pseudo observation of the planet is very large. Fig. 5c shows what happens when using Hyperion instead of Titan. The discrepancy is very large and the observation of Saturn deduced from the one of Hyperion badly accurate. This was obvious when looking at Table 3: the rms of the residuals reach 0.22/0.30 arcsec for Hyperion and 0.08/0.11 for Titan for all the series of data. In the case of Iapetus, the accuracy of the measurement seems to be better than for Hyperion but the theoretical model is worse than the one of Titan that encourages us to use Titan for determining pseudo-positions of the planet at the present time.
7. Comparison of the observations with other sets of data made at the same time - comparison of the (O-C)s from DE403 and DE405
Since similar series of observations are made in other observa-tories, it is interesting to compare the results obtained. From 1997 to 2005, observations were performed at Flagstaff us-ing FASTT transit circle facilities. Since Uranus is movus-ing slowly, we may compare the (O-C)s issued from Flagstaff and Bordeaux. Table 5 provides the mean (O-C)s calculated us-ing the LJ86 ephemeris for the satellites and DE 405 for the planet. For Titania and Oberon, both series of observations are in agreement, but for the planet Uranus, the results disagree. It is puzzling that the observations from Bordeaux for Uranus are in agreement with the observations of the satellites, and that is not the case for Flagstaff. Table 6 provides a comparison of the (O-C)s obtained for the opposition of 1998, with also, observa-tions made at Itajuba, Brazil, with a classical CCD target on a 1.6m-telescope (Veiga and Vieira-Martins 1999). The results are much more in agreement except for Uranus itself, proba-bly because of the brightness of the planet which decreases the observational accuracy.
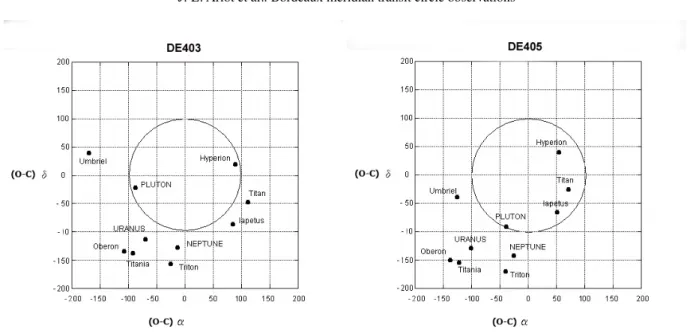
J.-E. Arlot et al.: Bordeaux meridian transit circle observations 7 Table 7. Comparison of DE403 and DE405 ephemerides derived from mean residuals (O-C) in α and in δ of Bordeaux meridian circle 1997-2006 observations (in mas unit)
Mean residuals (O-C)
Object Period N DE403 DE405
α δ α δ Titan 1999-2006 50 111 -47 71 -26 Hyperion 1999-2006 59 89 20 54 40 Iapetus 1999-2006 70 84 -86 51 -66 Uranus 1997-2005 165 -70 -113 -101 -129 Ariel 1998-2003 2 -1775 561 -1797 546 Umbriel 1997-2005 20 -88 -22 -125 -39 Titania 1997-2005 96 -92 -138 -122 -154 Oberon 1997-2005 113 -108 -134 -138 -150 Neptune 1999-2005 102 -13 -128 -26 -142 Triton 1999-2005 89 -26 -156 -40 -170 Pluto 2002-2005 54 170 40 -39 -91
Mean residuals in Table 7 are displayed in Fig. 3 visu-alizing residuals in declination versus residuals in right as-cension. Fig. 3 shows that the DE405 ephemeris presents no real improvement to the DE403, excepted for Saturn. For the planet Saturn, this result showing the improvement of DE405 with respect to DE403 is in good agreement with Rapaport et al.(2002). For Uranus and Neptune, we confirm the very small discrepancies between both ephemerides, pre-viously mentioned by Rapaport et al.(2002). Fig. 3 shows that such discrepancies are less than 20 mas. We can observe they are rather favourable to DE403 but this is not really significant as we are under the observational accuracy. For Pluto, Fig. 3 also confirms the improvement of DE405 in right ascension and the theoretical difference DE405-DE403 of about 100mas in declination presented by Rapaport et al.(2002). But in this case, we can see in Fig. 3 that this significative difference in Pluto declination does not appear to be in favour of DE405. Finally, the most important improvement of DE405 with re-spect to DE403 is obtained for Saturn. This can be due to the fact that only new accurate observations of Saturn derived from spacecraft data were used in the DE405 in order to improve the DE403 ephemeris.
8. Comparison of the theories of motion of Saturn’s satellites.
Table 8 shows that most of the lowest standard errors are de-rived from TASS theory by Vienne and Duriez (1995) and by Duriez and Vienne (1997). However, the lowest absolute mean residuals are generally obtained for the other theories Do93 (Dourneau 1987, 1993) for Titan in right ascension and HT93 (Harper and Taylor 1993; Taylor 1992) for Titan in declination as well as for Iapetus in right ascension.
For Hyperion, TASS theory presents all the lowest mean and standard residuals. This means that TASS has really im-proved HT93 Taylor"s theory (1992) which had previously im-proved Do93 Dourneau"s theory (1987). The latest theory ap-pears to need, for this satellite, a real improvement so as to include a series of perturbation terms that have not been intro-duced in comparison to Taylor and TASS theories.
This analysis shows that TASS theory, presenting most of the lowest standard errors, certainly proposes the best model for representing the real orbits of Saturnian satellites. However, this theory appears to need an improvement so as a new fit to observations in order to reduce the significant shift that we have observed in right ascension and in declination.
As a conclusion about the comparison of Saturnian satel-lites theories, TASS appears to give the best model of orbits as it considers additional terms not included in other theories. But both of the other theories Do93 and HT93 present a better fit to observations than TASS theory for Iapetus in right ascension and for Titan in right ascension and in declination.
9. Conclusion
In conclusion, it appears that transit circle observations are still useful either for the observations of the planetary satellites and for the planets. The pseudo positions of the planets deduced from the observation of the satellites are valuable, mainly for Jupiter and Saturn the centers of mass of which are not easy to measure directly and also for Uranus, increasing the amount of data since Uranus itself is measurable. These observations have an accuracy similar to the one of the direct observations. These observations have allowed us to obtain some results concern-ing the consistency of planetary and satellite theoretical mod-els. For the planets we have shown that the DE405 ephemeris presents no real improvement to the DE403 ephemeris, except for Saturn. For the satellites of Saturn, the TASS theory has ap-peared to give the best model of their orbits, but we have shown that the other models Do93 and HT93 can present a better fit to the observations for some satellites such as Titan and Iapetus. So, we encourage the continuation of such regular automatic observations allowing to keep a sample of observations well distributed in time.
Acknowledgements. This paper has been made possible thanks to the
staff of the meridian circle of Bordeaux Observatory.
References
Fig. 3. Comparison of mean residuals (O-C) in mas derived from DE403 and from DE405.
Table 8. Mean residuals (O-C) in α and δ, and standard errors on the residuals (σα, σδ) in mas of the Saturnian satellites for three available
theories. The lower residuals are boldfaced.
Object Period N Theory (O-C)α (O-C)δ σα σδ
Titan 1999-2007 62 TASS 91 -37 120 111 Do93 87 -36 126 113 HT93 89 -35 133 116 Hyperion 1999-2007 70 TASS 69 36 228 302 Do93 523 -114 876 365 HT93 111 -51 752 356 Iapetus 1999-2007 84 TASS 71 -72 115 106 Do93 32 -81 263 195 HT93 8 -89 311 133
Charlot, P. and Le Campion, J.F., 2004, in Highlights 2004, Paris, Combes, F. et al. (eds), EDP Sciences, p. 425
Dourneau, G., 1987, These de Doctorat d’Etat, Universit´e Bordeaux 1 Dourneau, G., 1993, A&A 267, 292
Ducourant, Le Campion, J. F., Rapaport, M., Camargo, J. I. B., Soubiran, C., P´eri´e, J. P., Teixeira, R., Daigne, G., Triaud, A., R´equi´eme, Y., Fresneau, A., Colin, J., 2006, A&A 448, 1235 Dourneau, G., Le Campion, J.F., Rapaport, M., Benevides-Soares,
P., Bosq, F., Chauvet, F., Daigne, G., Desbats, J.M., Ducourant, C., Montignac, G., Mazurier, J.M., P´eri´e, J.P., R´equi´eme, Y., Soubiran, C., Soulette, M., Teixeira, R., Viateau, B. : 2007, Note
scientifique et technique de l"IMCCE n◦S089, Paris.
Duriez, L., Vienne, A., 1997, A&A 324, 366 Harper, D., Taylor, D.B., 1993, A&A 268, 326
Hog, E., Fabricius, C., Makarov, V.V., Urban, S, Corbin, T, Wycoff, G., Bastian, U., Schwekendieck, P. and Wicenec, A., 2000, A&A 357, 367
Jacobson, R.A., Reidel, J.E. and Taylor A.H., 1991, A&A 247, 565 Laskar J., Jacobson R.A., 1987, A&A 118, 212
Muinos, J.L., Belizon, F., Vallejo, M, Montojo, F. J., Mallamaci, C. C., Prez, J. A.: 2006, Revista Mexicana de Astronomia y Astrofisica 25, 47
Rapaport, M., Requieme, Y., Mazurier, J. M., Francou, G.: 1987, A&A 179, 317
Rapaport, M., Le Campion, F., Soubiran, C., Daigne, G., P´eri´e, J.-P., Bosq, F., Colin, J., Desbats, J.-M., Ducourant, C., Mazurier, J.-M., Montignac, G., Ralite, N., R´equi´eme, Y., Viateau, B., 2001, A&A 376, 325
Rapaport, M., Teixeira, R., Le Campion, J. F., Ducourant, C., Camargo, J. I. B., Benevides-Soares, P., 2002, A&A 383, 1054 Rapaport, Ducourant, C., Le Campion, J. F., Fresneau, A., Argyle, R.
W., Soubiran, C., Teixeira, R., Camargo, J. I. B., Colin, J., Daigne, G., P´eri´e, J. P., R´equi´eme, Y., 2006, A&A 449, 435
Requieme, Y., Mazurier, J. M.: 1991, A&AS 89, 311
Stone, Ronald C., Monet, David G., Monet, Alice K. B., Walker, Richard L., Ables, Harold D., 1996, AJ 111, 4
Stone, R.C., Harris, F.H., 2000, AJ 119, 1985 Stone, R.C., 2001, AJ 122 2723
Taylor, D.B., 1992, A&A 265, 825
Veiga, C. and Vieira-Martins, R., 1999, A&AS 138, 247 Viateau, B. and Rapaport, M., 1996, A&A 334, 729
Viateau, B., R´equi´eme, Y., Le Campion, J. F., Benevides-Soares, P., Teixeira, R., Montignac, G., Mazurier, J. M., Monteiro, W., Bosq, F., Chauvet, F., Colin, J., Daigne, G., Desbats, J. M., Dominici, T. P., P´eri´e, J. P., Raffaelli, J., Rapaport, M., 1999, A&AS 134, 173 Vienne, A., Duriez, L., 1995, A&A 297, 508
J.-E. Arlot et al.: Bordeaux meridian transit circle observations 9
Fig. 4. Residuals (O-C) vs time on the positions of Saturn deduced from the observed positions of Titan.
Fig. 5. Residuals (O-C) in α vs δ on the positions of Saturn deduced from the observed positions of the satellites (a: from Titan TASS theory; b: from Titan Do93 theory; c: from Hyperion TASS theory).
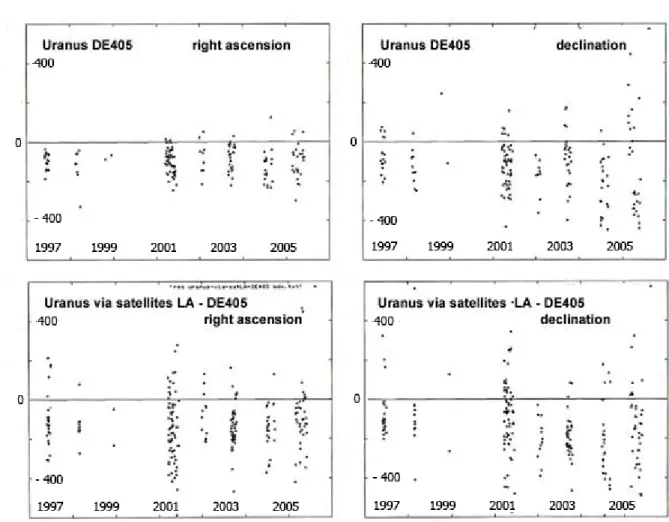
Fig. 6. Residuals (O-C) vs time on the positions of Uranus directly observed and deduced from the observed positions of the satellites.