HAL Id: inserm-02504186
https://www.hal.inserm.fr/inserm-02504186
Submitted on 10 Mar 2020
HAL is a multi-disciplinary open access
archive for the deposit and dissemination of
sci-entific research documents, whether they are
pub-lished or not. The documents may come from
teaching and research institutions in France or
abroad, or from public or private research centers.
L’archive ouverte pluridisciplinaire HAL, est
destinée au dépôt et à la diffusion de documents
scientifiques de niveau recherche, publiés ou non,
émanant des établissements d’enseignement et de
recherche français ou étrangers, des laboratoires
publics ou privés.
126,000 food products of the French market
Eloi Chazelas, Mélanie Deschasaux, Bernard Srour, Emmanuelle Kesse-Guyot,
Chantal Julia, Benjamin Allès, Nathalie Druesne-Pecollo, Pilar Galan, Serge
Hercberg, Paule Latino-Martel, et al.
To cite this version:
Eloi Chazelas, Mélanie Deschasaux, Bernard Srour, Emmanuelle Kesse-Guyot, Chantal Julia, et al..
Food additives: distribution and co-occurrence in 126,000 food products of the French market.
Scien-tific Reports, Nature Publishing Group, 2020, 10 (1), pp.3980. �10.1038/s41598-020-60948-w�.
�inserm-02504186�
food additives: distribution and
co-occurrence in 126,000 food
products of the French market
eloi chazelas
1*, Mélanie Deschasaux
1, Bernard Srour
1, Emmanuelle Kesse-Guyot
1,
Chantal Julia
1,2, Benjamin Alles
1, Nathalie Druesne-pecollo
1, Pilar Galan
1, Serge Hercberg
1,2,
paule Latino-Martel
1, Younes esseddik
1, Fabien Szabo
1, Pierre Slamich
3, Stephane Gigandet
3& Mathilde touvier
1Background. More than 330 food additives (e.g. artificial sweeteners, emulsifiers, dyes) are authorized in Europe, with a great variability of use across food products. Objective. The objective of this study was to investigate the distribution and co-occurrence of food additives in a large-scale database of foods and beverages available on the French market. Design. The open access crowdsourced Open Food Facts database (https://world.openfoodfacts.org/) was used to retrieve the composition of food and beverage products commonly marketed on the French market (n = 126,556), based on the ingredients list. Clustering of food additive variables was used in order to determine groups of additives frequently co-occurring in food products. The clusters were confirmed by network analysis, using the eLasso method. Results. Fifty-three-point eight percent of food products contained at least 1 food additive and 11.3% at least 5. Food categories most likely to contain food additives (in more than 85% of food items) were artificially sweetened beverages, ice creams, industrial sandwiches, biscuits and cakes. The most frequently used food additives were citric acid, lecithins and modified starches (>10,000 products each). Some food additives with suspected health effects also pertained to the top 50: sodium nitrite, potassium nitrate, carrageenan, monosodium glutamate, sulfite ammonia caramel, acesulfame K, sucralose, (di/tri/poly) phosphates, mono- and diglycerides of fatty acids, potassium sorbate, cochineal, potassium metabisulphite, sodium alginate, and bixin (>800 food products each). We identified 6 clusters of food additives frequently co-occurring in food products. Conclusions. Food additives are widespread in industrial French products and some clusters of additives frequently co-occurring in food products were identified. These results pave the way to future etiological studies merging composition data to food consumption data to investigate their association with chronic disease risk, in particular potential ‘cocktail effects’.
In the Western world, the last decades were marked by an increase in the consumption of ‘ultra-processed’ foods, i.e. foods undergoing multiple physical, biological, and/or chemical processes and containing various food addi-tives1–6. In France, the 2017 nationally representative INCA3 nutritional survey highlighted a rise in processed
food consumption, mainly accounted for by industrially-processed foods7. In this context, results of observational
epidemiological studies linking ‘ultra-processed’ food intake and health outcomes is accumulating worldwide8–17.
A clinical trial also highlighted an association between ultra-processed food and increased ad libitum energy intake and weight gain over a 2-week period18. In addition to the poorer nutritional composition, the presence of
neo-formed compounds and of substances migrating from packaging, food additives is one of the main hypoth-eses that could help explain these results. Ultra-processed foods indeed often contain mixtures of additives. They represent about 330 authorized compounds in the European Union (EU)19, where their use is legislated
by Regulation (EC) No 1333/2008. The restriction may vary, for example, only 48 food additives are allowed in organic food products. The additive content of a food product is mandatorily provided on its packaging/label with a list of all substances identified by their E number (EU identifier), name (e.g. E466 carboxymethylcellulose)
1Sorbonne Paris Nord - Paris 13 University, Inserm U1153, Inrae U1125, Cnam, Nutritional Epidemiology Research
Team (EREN), Epidemiology and Statistics Research Center – University of Paris (CRESS), Bobigny, France. 2Public
Health Department, Avicenne Hospital, AP-HP, Bobigny, France. 3Open Food Facts, Saint-Maur-des-Fossés, France.
*email: e.chazelas@eren.smbh.univ-paris13.fr
and function in the final product. They are commonly used as antioxidants, dyes, emulsifiers, stabilizers, gel-ling agents, thickeners, preservatives and sweeteners20, and some are undoubtedly useful for increasing shelf
life and food safety. Most of them probably have no impact on health and some may even be beneficial (e.g. anti-microbial, antioxidants, polyphenols). However, some concerning results, mainly derived from animal and/ or cell-based experimental studies, have emerged regarding several additives. For instance, nitrates/nitrites21–23,
carrageenans24, glutamate25–27, bixin28,29, artificial sweeteners30–34, phosphates35,36, emulsifiers37–39, caramel40,41,
titanium dioxide (TiO2)42, tartrazine43,44 and butylated hydroxyanisole/butylated hydroxytoluene (BHA/BHT)43
were previously linked to metabolic, gut microbiota or endocrine perturbations along with carcinogenic, inflam-matory and/or oxidative stress effects. Besides, some experimental results suggest that different additives may interact (among themselves and/or with the food matrix) and thus lead to synergistic or antagonist effects, but few studies have been performed on this topic to-date45–50.
Maximum authorized levels of food additives are set by the European Food Safety Authority (EFSA)20 - and
the WHO-FAO JECFA at the international level51 and are theoretically intended to protect consumers against
the potential adverse effects of each individual substance in a given food product. Yet, despite the substantial amount of work on the literature review and the collective expertise at these institutions, the evaluation (and subsequent recommendations and regulations) has been based only on the currently available scientific evidence which is mainly derived from in-vitro or in-vivo experimental research and simulations of exposure in humans. In that context, information regarding: (1) the health impact of regular and cumulative intake of food additives in humans, and (2) the potential ‘cocktail’ effects/interactions is still missing yet urgently needed.
Furthermore, the presence of these substances in the foods available on the French market has been poorly studied. In order to pave the way for etiological studies, it is essential to document which food additives are the most widespread and in which food categories they are more likely to be found. In addition, the study of their co-occurrence in foods will identify various food additive mixtures that are relevant in real life. Thus, objectives of this work were (1) to investigate the distribution of food additives in a large-scale database of food and beverage products available on the French market and (2) to identify mixtures of food additives frequently co-occurring in food products raising the issue of possible cocktail effects.
Methods
Open food facts database.
The Open Food Facts database was used to retrieve composition of food prod-ucts (http://world.openfoodfacts.org/). Open Food Facts is an open collaborative database of food products mar-keted worldwide, licensed under the Open Database License (ODBL). This French initiative contains data on hundreds of thousands of products. The initiative started in France in 2012, providing extensive coverage of the French food market, and an increasing number of products are becoming available for other countries worldwide. Contributors (citizens and active Open Food Facts contributors) permanently add products to this crowdsourced database, by scanning the barcode and sending photographs of the packaging. The information is automatically treated to record a wealth of information for each food product, such as commercial name, brand, list of ingre-dients, presence/absence of each food additive and nutritional composition. As food products formulations may evolve, old products are regularly updated when they are re-informed by consumers.The Global Trade Item Number (GTIN) embedded in the barcode acts as an identifier of each product. For the present study, data was retrieved from the Open Food Facts database on April 10, 2019. Duplicates (different formats, e.g. packs “x4” or “x8”) were removed for products of the same brand and same composition. The information of additives in the list of ingredients is mandatory in Europe. All products currently marketed in France with available list of ingredients were included (n = 126,556, see Appendix 1 for flowchart) and corre-sponding information on the presence and nature of food additives was extracted for each food or beverage item. Food categorization has been previously described52. Thirty-five food categories were identified (Appendix 2).
Distribution of food additives in foods and beverages.
We calculated the percentage of food items in each food category, the percentage of food items containing at least one, two, three, etc. food additives, the percentage of food items containing at least one additive per food category, and the number of food products containing each food additive.Clustering of food additives frequently co-occurring in food products.
In order to assess their co-occurrence in food and beverage items, clustering of food additives was performed using the R package ClustOfVar, specifically dedicated to the clustering of variables53. Each food product (n = 126,556) was described by presence/absence of each food additive (141 binary variables, after exclusion of food additives present in less than 100/126,556 food products). Following the ClustOfVar methodology, ascendant hierarchical clustering of variables was performed on this dataset (141 binary variables)54, thus providing clusters of food additives strongly co-occurring.
For each cluster, a squared loading is attributed to each additive, corresponding to the strength of the correla-tion between the food additive and its cluster. For each cluster of food additives variables, a synthetic variable (or score) is also generated by the package. For a given food product, the value of this synthetic variable for clusteri
increases when the number of food additives of clusteri present in this food increases. In other words, the higher
the number of clusteri food additives in a given product, the higher the clusteri synthetic variable for that product.
For each cluster, food products with higher synthetic variable (>99th percentile of the distribution) were high-lighted to show the food items which were the largest food additive carriers of this cluster. See Appendix 3 for more details on the ClustOfVar algorithm.
Network analysis.
In order to visualize the co-occurrence of food additives and to confirm the information provided by the clustering of variables by a complementary method, network analysis was performed with the R package IsingFit (see Appendix 4 for details). Based on the eLasso method, this package is specifically dedicatedto the estimation of binary data network structures and provides an overview of the co-occurrences of additives, mutually adjusted for all the relationships of the network55. It can be interpreted as follows: when two food
addi-tives are connected by a blue line, it means that they are often found together in food products, when they are connected by a red line, it means that they are rarely found together. Bolder is the line, higher is the number of products concerned. For better visualization, the network was generated for the 50 food additives most present in food products, and additives were colored according to clusters defined by the ClustOfVar method.
Additional descriptors.
The Nutri-Score was used to provide information on the global nutritional qual-ity of food products56. This score is based on a modified version of the Food Standard Agency (FSA)nutri-ent profiling system, and it has been endorsed by the French, Spanish, and Belgian governmnutri-ents as the official front-of-pack label in these countries (Appendix 5). It classifies foods into 5 classes, ranging from A/dark green (better nutritional quality) to E/dark orange-red (worst nutritional quality)52,57. Food products from the Open
Food Facts database were also categorized into one of the four food NOVA groups, a food classification system developed by researchers from the University of São Paulo58, based on the extent and purpose of industrial food
processing58–60. NOVA classifies all foods and food products into four groups: (1) unprocessed or minimally
pro-cessed foods, (2) propro-cessed culinary ingredients, (3) propro-cessed foods, (4) ultra-propro-cessed foods (Appendix 6)58.
Transparency statement.
Dr. Touvier (the guarantor) affirms that the manuscript is an honest, accurate, and transparent account of the study being reported; that no important aspects of the study have been omitted; and that any discrepancies from the study as planned have been explained.Results
Distribution of food items across food categories.
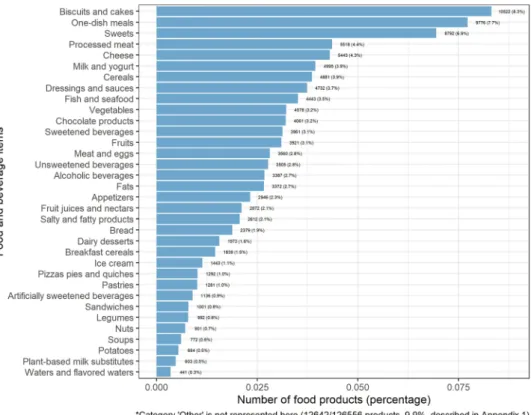
The number and percentage of food or beverage items by food categories available in the Open Food Facts database is illustrated in Fig. 1. Out of 126,556 products, the most represented food categories were biscuits and cakes (8.3%), one-dish meals (7.7%), sweets (6.9%), processed meat (4.4%), cheese (4.3%), milk and yogurt (3.9%), cereal products (3.9%) and dressings and sauces (3.7%).Number of food additives per food product.
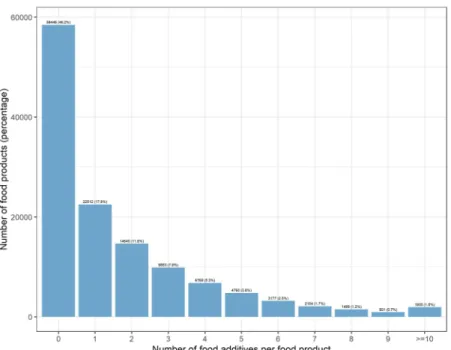
In all, 329 additives were found in the database, among which 141 were present in at least 100 food products. Figure 2 shows the number of food additives present in food products: overall 53.8% of products (68 110/126,556) contained at least one food additive; 17.8% contained one, 11.6% two, 7.8% three, 5.3% four and 11.3% five or more food additives.Proportion of food products containing additives in each food category.
Figure 3 shows the per-centage of products containing food additives, per food category. Virtually all artificially sweetened beverages (99.4% of products), 95.0% of ice creams, 88.7% of industrial sandwiches, and 87.1% of biscuits and cakes con-tained at least one food additive.Figure 1. Percentage of food and beverage items by food category in the Open Food Facts database (n = 126,556
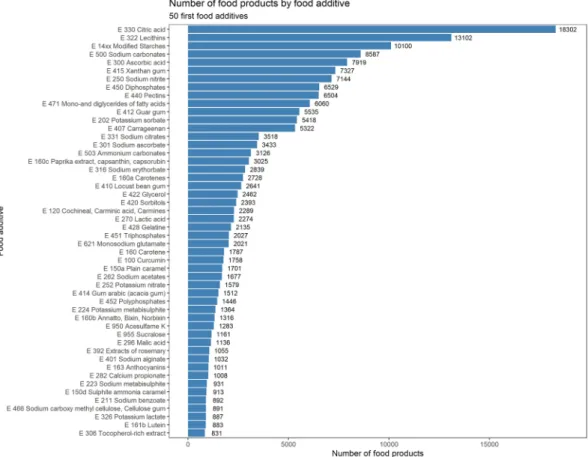
Most frequently used food additives.
The number of food products containing each food additive is presented in Fig. 4 for the 50 most spread additives and in Appendix 7 for all food additives authorized on theFigure 3. Percentage of food and beverage items containing at least one additive per food category, Open Food
Facts database (n = 126,556 products), France 2019.
Figure 2. Number of food additives per food product, Open Food Facts database (n = 126,556 products),
EU market. The most frequently used food additives were citric acid, lecithins and modified starches (found in >10,000 products). The top 50 also included sodium nitrite, potassium nitrate, carrageenan, monosodium glutamate, sulfite ammonia caramel, acesulfame K, sucralose, (di/tri/poly)phosphates, mono- and diglycer-ides of fatty acids, potassium sorbate, cochineal, potassium metabisulphite, sodium alginate, bixin and sodium carboxymethylcellulose.
Clusters of food additives frequently co-occurring in food products.
After graphic assessment (Appendix 8a), 6 clusters of food additives were extracted (Fig. 5). Appendix 8b shows food additives present in each cluster and their respective squared loadings. Table 1 shows the 50 products most characteristic of each cluster, i.e., with the highest cluster synthetic variable (score). Network analysis also illustrated the co-occurrence of food additives (Fig. 6) and confirmed the clusters described here. The clusters were described as follows:Cluster 1: dyes and glazing agents mostly used in sweets (n = 24 food additives).
This cluster was mostly represented by carnauba wax (used to produce a glossy finish), beeswax (glazing agent), titanium dioxide (dye), curcumin (dye), brilliant blue FCF and patent blue V (dye). Foods most representative of this clus-ter (99th percentile of the score for cluster 1) were sweets. The distribution of their Nutri-Score was 0.6% A, 14.0%B, 6.0% C, 56.2% D, 23.2% E and their repartition across NOVA categories was 0.1% 1 and 99.9% 4.
Cluster 2: wide range of additives mostly used in sandwiches and sugary desserts (n = 61 food
additives).
This cluster was mostly represented by xanthan gum, modified starches, mono- and diglycerides of fatty acids, guar gum and carrageenan. They have a wide range of functions, such as emulsifiers, stabilizers, colorings, antioxidants and are used in a wide variety of products. Foods most representative of this cluster (99thpercentile) were sandwiches and sugary desserts. The distribution of their Nutri-Score was 3.6% A, 9.2% B, 24.7% C, 49.9% D, 12.6% E and their repartition across NOVA categories was 0.1% 3, and 99.9% 4.
Cluster 3: stabilizers and emulsifiers mostly used in biscuits and cakes (n = 13 food
addi-tives).
This cluster is mostly represented by sodium carbonate, diphosphates, lecithins, ammonium car-bonates, and glycerol. These additives are mostly used as acidity regulators, stabilizers and emulsifiers. Foods most representative of this cluster (99th percentile) were biscuits and cakes. The distribution of their Nutri-Scorewas 0.2% A, 3.5% B, 5.4% C, 46.0% D, 44.9% E and their repartition across NOVA categories was 100% 4.
Figure 4. Number of food products containing each food additive, Open Food Facts database (n = 126,556
Cluster 4: sweeteners mostly used in sugar-free chewing gums and artificially sweetened
bev-erages (n = 19 food additives).
This cluster is mostly represented by sweeteners such as acesulfame K, aspartame, xylitol, maltitols, mannitol and the antioxidant butylated hydroxytoluene (BHT). Foods most rep-resentative of this cluster (99th percentile) were sweets (mostly chewing-gums with sweeteners) and artificiallysweetened beverages. The distribution of their Nutri-Score was 13.1% A, 43.6% B, 20.3% C, 17.2% D, 5.8% E and their repartition across NOVA categories was 0.1% 2, 0.6% 3, and 99.3% 4.
Cluster 5: flavor enhancers additives mostly used in instant noodles and other umami-tasting
foods (n = 13 food additives).
This cluster is represented by flavor enhancers disodium inosinate, diso-dium guanylate and monosodiso-dium glutamate, used in synergy to provide the umami taste and potassium car-bonates, disodium 5′-ribonucleotides and ammonia caramel. Foods most representative of this cluster (99thFigure 5. Dendrogram of food additives frequently co-occurring in food products generated by cluster
Cluster 1: dyes and glazing agents mostly used in sweets Cluster 2: wide range of additives mostly used in sandwiches and sugary desserts Cluster 3: stabilizers and emulsifiers mostly used in biscuits and cakes Product
n° Food group Generic name Cluster score Nutri-Score Product n° Food group nameGeneric Cluster score Nutri-Score Product n° Food group Generic name Cluster score Nutri-Score
1 Chocolate products chocolate 49,03 E 1 Biscuits and cakes pastry 21,67 D 1 Biscuits and cakes éclair 14,07 D 2 Chocolate products chocolate 49,03 E 2 Biscuits and cakes pastry 21,17 D 2 Biscuits and cakes cake 13,56 E 3 Chocolate products chocolate 45,31 E 3 Sandwiches fish burger 18,22 D 3 Biscuits and cakes chocolate cake 13,56 E 4 Sweets chocolate 43,53 E 4 Sandwiches burger 18,08 D 4 Biscuits and cakes chocolate cake 13,56 E 5 Chocolate products chocolate 40,17 E 5 Ice cream creamvanilla ice 17,47 D 5 Biscuits and cakes strawberry cake 12,89 D 6 Sweets candy 39,89 D 6 Ice cream chocolate ice cream 17,47 D 6 Biscuits and cakes chocolate cake 12,89 D 7 Sweets candy 39,89 D 7 Sandwiches burger 16,90 D 7 Biscuits and cakes chocolate cake 12,89 D 8 Chocolate products chocolate 39,72 E 8 Sandwiches burger 16,90 D 8 Biscuits and cakes chocolate cake 12,89 D 9 Sweets candy 39,24 D 9 Biscuits and cakes pastry 16,71 D 9 Biscuits and cakes éclair 12,89 D 10 Sweets candy 39,24 D 10 Biscuits and cakes pastry 16,55 D 10 Biscuits and cakes chocolate cake 12,89 D 11 Sweets candy 37,06 D 11 Biscuits and cakes pastry 16,53 C 11 Biscuits and cakes pastry 12,86 E 12 Sweets candy mix 35,41 D 12 Biscuits and cakes pastry 16,31 E 12 Biscuits and cakes biscuits 12,38 E 13 Chocolate products chocolate 35,41 C 13 Sandwiches burger 16,02 D 13 Biscuits and cakes biscuits 12,38 E 14 Chocolate products chocolate 35,35 E 14 Biscuits and cakes pastry 15,44 C 14 Biscuits and cakes pastry 12,01 D 15 Chocolate products chocolate 35,35 E 15 Sandwiches burger 15,40 D 15 Biscuits and cakes pastry 12,01 E 16 Sweets candy mix 35,31 D 16 Pastries brioche 15,32 D 16 Biscuits and cakes pastry 12,01 D 17 Sweets candy mix 34,89 D 17 Pastries brioche 15,32 D 17 Biscuits and cakes chocolate cake 11,90 E 18 Sweets candy mix 34,89 D 18 Ice cream ice cream 15,12 C 18 Biscuits and cakes chocolate cake 11,90 E 19 Sweets candy mix 34,82 D 19 Sandwiches burger 15,11 D 19 Biscuits and cakes biscuits 11,90 E 20 Sweets candy mix 34,68 D 20 Sandwiches burger 14,92 D 20 Biscuits and cakes chocolate cake 11,90 E 21 Sweets candy mix 34,68 D 21 Sandwiches burger 14,92 D 21 Biscuits and cakes chocolate cake 11,90 E 22 Sweets candy mix 34,68 D 22 Biscuits and cakes pastry 14,91 D 22 Biscuits and cakes assorted biscuits 11,82 E 23 Sweets candy mix 34,68 D 23 Biscuits and cakes macaroon 14,89 D 23 Biscuits and cakes biscuits 11,82 E 24 Sweets candy mix 34,68 D 24 Dairy desserts pastry 14,70 C 24 Biscuits and cakes biscuits 11,82 E 25 Sweets candy mix 34,68 D 25 Dairy desserts pastry 14,70 C 25 Biscuits and cakes biscuits 11,75 E 26 Sweets candy mix 34,68 D 26 Biscuits and cakes pastry 14,69 D 26 Biscuits and cakes strawberry cake 11,70 D 27 Sweets candy mix 34,68 D 27 Sandwiches sandwich 14,68 D 27 Biscuits and cakes Japaneese cake 11,70 D 28 Ice cream ice cream 34,37 D 28 Biscuits and cakes pastryraspberry 14,39 D 28 Biscuits and cakes pastry 11,69 D 29 Ice cream vanilla ice cream 34,06 C 29 Biscuits and cakes brioche 14,21 D 29 Biscuits and cakes pastry 11,59 D 30 Sweets candy 33,69 D 30 Biscuits and cakes pastry 14,20 C 30 Biscuits and cakes pastry 11,59 D 31 Sweets candy mix 33,23 D 31 Dairy desserts moussecoco 14,15 C 31 Biscuits and cakes éclair 11,59 D 32 Sweets candy 32,95 D 32 Sandwiches burger 14,12 D 32 Biscuits and cakes éclair 11,59 D 33 Sweets candy 32,95 D 33 Biscuits and cakes pastrystrawberry 14,10 C 33 Biscuits and cakes pastry 11,44 D
Cluster 1: dyes and glazing agents mostly used in sweets Cluster 2: wide range of additives mostly used insandwiches and sugary desserts Cluster 3: stabilizers and emulsifiers mostly used inbiscuits and cakes Product
n° Foodgroup Genericname Clusterscore Nutri-Score Productn° Food group Genericname Clusterscore Nutri-Score Productn° Food group Genericname Clusterscore Nutri-Score
34 Sweets candy 32,95 D 34 Biscuits and cakes pastry 14,09 D 34 Biscuits and cakes chocolate cake 11,32 D 35 Sweets candy 32,82 E 35 Ice cream baked Alaska 13,99 D 35 Biscuits and cakes chocolate cake 11,32 D 36 Sweets candy 32,32 E 36 Ice cream fruit ice cream 13,92 D 36 Biscuits and cakes chocolate cake 11,32 D 37 Chocolate products chocolate 32,10 E 37 Sandwiches fish burger 13,86 D 37 Biscuits and cakes éclair 11,21 D 38 Sweets candy 31,92 D 38 Ice cream creamfruit ice 13,78 C 38 Biscuits and cakes éclair 11,21 D 39 Sweets candy mix 31,64 D 39 Dairy desserts entremets 13,72lemon E 39 Biscuits and cakes chocolate cake 11,21 D 40 Sweets candy 31,23 D 40 Biscuits and cakes pastry 13,60 D 40 Biscuits and cakes chocolate cake 11,21 D 41 Chocolate products chocolate 31,22 D 41 Other pastry 13,56 D 41 Biscuits and cakes chocolate cake 11,18 E 42 Chocolate products chocolate 30,81 E 42 Biscuits and cakes pastry 13,52 D 42 Biscuits and cakes biscuits 11,09 C 43 Sweets candy mix 30,28 C 43 Sandwiches burger 13,51 D 43 Biscuits and cakes chocolate cake 11,06 E 44 Sweets candy 29,78 E 44 Sandwiches sandwich 13,44 D 44 Biscuits and cakes pastry 10,82 C 45 Sweets candy mix 29,56 D 45 Biscuits and cakes pastry 13,40 D 45 Biscuits and cakes pastry 10,82 D 46 Sweets candy 28,96 E 46 Sandwiches sandwich 13,36 D 46 Biscuits and cakes pastry 10,82 C 47 Chocolate products chocolate 28,96 E 47 Sandwiches chicken sandwich 13,36 D 47 Biscuits and cakes pastry 10,82 D 48 Biscuits and cakes biscuits 28,60 D 48 Fish and seafood fish salad 13,35 C 48 Biscuits and cakes pastry 10,69 E 49 Sweets candy 28,54 D 49 One-dish meals crepe 13,28 D 49 Biscuits and cakes pastry 10,69 E 50 Sweets candy 28,29 D 50 Pastries brioche 13,23 D 50 Biscuits and cakes pastry 10,69 E
Cluster 4: sweeteners mostly used in sugar-free chewing
gums and artificially sweetened beverages Cluster 5: flavor enhancers additives mostly used in instant noodles and other umami-tasting foods Cluster 6: preservatives and antioxidants mostly used in processed meat Product
n° Food group Generic name Cluster score Nutri-Score Product n° Food group Generic name Cluster score Nutri-Score Product n° Food group Generic name Cluster score Nutri-Score
1 Sweets chewing gum with
sweeteners 49,23 B 1
One-dish
meals instant noodles 35,75 E 1 One-dish meals pork macaroni
gratin 19,95 C 2 Sweets chewing gum with
sweeteners 49,23 B 2
One-dish
meals instant noodles 33,48 C 2 One-dish meals endive gratin with
pork 19,95 C 3 Sweets chewing gum with
sweeteners 48,53 D 3
One-dish
meals instant noodles 33,27 C 3 Processed meat diced ham 19,48 D 4 Sweets chewing gum with
sweeteners 48,53 B 4
One-dish
meals instant noodles 32,76 C 4 Sandwiches croque-monsieur 19,38 D 5 Sweets chewing gum with
sweeteners 48,53 B 5
One-dish
meals instant noodles 32,53 C 5 Pizzas pies and quiches quiche with ham 18,61 D 6 Sweets chewing gum with
sweeteners 46,59 B 6
One-dish
meals instant noodles 32,53 C 6 Pizzas pies and quiches quiche with ham 18,61 D 7 Sweets chewing gum with
sweeteners 46,59 B 7
One-dish
meals instant noodles 31,83 E 7 Pizzas pies and quiches quiche with ham 18,61 D 8 Sweets chewing gum with
sweeteners 46,59 B 8
One-dish
meals instant noodles 31,41 C 8 Processed meat diced ham 18,18 D 9 Sweets chewing gum with
sweeteners 46,59 B 9
One-dish
meals instant noodles 31,32 C 9 Pizzas pies and quiches quiche with ham 17,76 D 10 Sweets chewing gum with
sweeteners 46,59 B 10
One-dish
meals instant noodles 31,32 C 10 One-dish meals sauerkraut 17,55 D
Cluster 4: sweeteners mostly used in sugar-free chewing
gums and artificially sweetened beverages Cluster 5: flavor enhancers additives mostly used ininstant noodles and other umami-tasting foods Cluster 6: preservatives and antioxidants mostly usedin processed meat Product
n° Foodgroup Genericname Clusterscore Nutri-Score Productn° Food group Genericname Clusterscore Nutri-Score Productn° Food group Genericname Clusterscore Nutri-Score
11 Sweets chewing gum with
sweeteners 46,59 B 11
One-dish
meals instant noodles 31,20 C 11 One-dish meals cassoulet 17,55 B 12 Sweets chewing gum with
sweeteners 46,59 B 12
One-dish
meals instant noodles 31,20 C 12 Processed meat sauerkraut 17,55 D 13 Sweets chewing gum with
sweeteners 46,59 B 13
One-dish
meals instant noodles 30,69 C 13 One-dish meals
Cantonese rice with
ham 17,02 D 14 Sweets chewing gum with
sweeteners 46,59 D 14
One-dish
meals instant noodles 30,69 C 14 Pizzas pies and quiches quiche with ham 16,24 B 15 Sweets chewing gum with
sweeteners 46,59 B 15
One-dish
meals instant noodles 29,28 C 15 Pizzas pies and quiches quiche with ham 15,96 D 16 Sweets chewing gum with
sweeteners 46,59 B 16
One-dish
meals instant noodles 29,25 C 16 Pizzas pies and quiches quiche with ham 15,96 D 17 Other chewing gum with
sweeteners 46,59 C 17
One-dish
meals instant noodles 29,25 C 17 Pizzas pies and quiches quiche with ham 15,96 C 18 Sweets chewing gum with
sweeteners 46,59 C 18
One-dish
meals instant noodles 29,25 C 18 Pizzas pies and quiches quiche with ham 15,96 D 19 Sweets chewing gum with
sweeteners 46,59 C 19
One-dish
meals instant noodles 28,82 C 19 One-dish meals crepe with ham 15,83 D 20 Sweets chewing gum with
sweeteners 46,59 B 20
One-dish
meals instant noodles 28,82 C 20 Processed meat chicken ham 15,81 C 21 Sweets chewing gum with
sweeteners 46,59 B 21
One-dish
meals instant noodles 28,82 C 21 Meat and eggs turkey ham 15,81 C 22 Sweets chewing gum with
sweeteners 46,59 B 22
One-dish
meals instant noodles 28,08 C 22 Processed meat chicken ham 15,81 C 23 Sweets chewing gum with
sweeteners 46,59 B 23 Other
dried
broth 27,61 D 23 Meat and eggs pork roulades 15,61 D 24 Sweets chewing gum with
sweeteners 46,59 B 24
One-dish
meals instant noodles 27,49 C 24 Processed meat sausage 15,61 D 25 Sweets chewing gum with
sweeteners 46,59 B 25
One-dish
meals instant noodles 27,40 C 25 Processed meat sausage 15,61 E 26 Sweets chewing gum with
sweeteners 46,59 C 26
One-dish
meals instant noodles 27,40 C 26 Processed meat sausage 15,61 E 27 Sweets chewing gum with
sweeteners 46,47 B 27
One-dish
meals instant noodles 27,40 C 27 Processed meat sausage 15,61 E 28 Sweets chewing gum with
sweeteners 46,47 B 28
One-dish
meals instant noodles 27,40 C 28 Processed meat sausage 15,61 E 29 Sweets chewing gum with
sweeteners 45,78 B 29
One-dish
meals instant noodles 26,98 C 29 Processed meat sausage 15,61 E 30 Sweets chewing gum with
sweeteners 44,54 B 30
One-dish
meals instant noodles 26,98 E 30 Processed meat sausage 15,61 D 31 Sweets chewing gum with
sweeteners 43,79 B 31
One-dish
meals instant noodles 26,98 C 31 Processed meat sausage 15,61 E 32 Sweets chewing gum with
sweeteners 43,79 B 32
One-dish
meals instant noodles 26,98 C 32 Processed meat sausage 15,61 D 33 Sweets chewing gum with
sweeteners 43,79 B 33
One-dish
meals instant noodles 26,98 C 33 Processed meat sausage 15,61 D 34 Sweets chewing gum with
sweeteners 43,79 B 34
One-dish
meals instant noodles 26,98 C 34 Processed meat sausage 15,61 E
percentile) were one-dish meals (mostly instant noodles) and appetizers (mostly salted crisps). The distribution of their Nutri-Score was 4.3% A, 10.8% B, 21.5% C, 42.1% D, 21.3% E and their repartition across NOVA catego-ries was 1.3% 1, 0.2% 2, 1.9% 3 and 96.6% 4.
Cluster 6: preservatives and antioxidants mostly used in processed meat (n = 11 food additives).
This cluster is mostly represented by sodium nitrite, sodium erythorbate, sodium ascorbate, triphosphates and sodium acetates. Sodium nitrite is a preservative used in a wide variety of processed meat. It can be used with sodium erythorbate, which increases the rate at which nitrite reduces to nitric oxide. Foods most representative of this cluster (99th percentile) were processed meat and one-dish meals containing processed meat. The distribution
of their Nutri-Score was 2.8% A, 9.1% B, 20.2% C, 42.5% D, 25.4% E and their repartition across NOVA categories was 0.8% 3, and 99.2% 4.
Cluster 4: sweeteners mostly used in sugar-free chewing
gums and artificially sweetened beverages Cluster 5: flavor enhancers additives mostly used ininstant noodles and other umami-tasting foods Cluster 6: preservatives and antioxidants mostly usedin processed meat Product
n° Foodgroup Genericname Clusterscore Nutri-Score Productn° Food group Genericname Clusterscore Nutri-Score Productn° Food group Genericname Clusterscore Nutri-Score
35 Sweets chewing gum with
sweeteners 43,09 B 35
One-dish
meals instant noodles 26,98 C 35 Processed meat sausage 15,48 E 36 Sweets chewing gum with
sweeteners 42,94 C 36
One-dish
meals instant noodles 26,98 C 36 One-dish meals delicatessen product 15,48 D 37 Sweets chewing gum with
sweeteners 41,20 B 37
One-dish
meals instant noodles 26,98 C 37 Meat and eggs
cooked chicken
slices 15,22 E 38 Sweets chewing gum with
sweeteners 41,20 B 38
One-dish
meals instant noodles 26,98 C 38 Processed meat sausage 15,18 B 39 Sweets chewing gum with
sweeteners 41,20 C 39
One-dish
meals instant noodles 26,98 C 39 Processed meat sausage 15,18 D 40 Sweets chewing gum with
sweeteners 40,30 B 40
One-dish
meals instant noodles 26,98 C 40 Processed meat turkey ham 14,87 D 41 Sweets chewing gum with
sweeteners 39,81 B 41
One-dish
meals instant noodles 26,98 C 41 One-dish meals tandoori chicken 14,87 D 42 Sweets chewing gum with
sweeteners 39,64 B 42
One-dish
meals instant noodles 26,98 C 42 Sandwiches croque-monsieur 14,87 C 43 Sweets chewing gum with
sweeteners 39,64 B 43
One-dish
meals instant noodles 26,98 C 43 Cereals
ready to eat pastas with
ham 14,78 D 44 Sweets chewing gum with
sweeteners 39,64 B 44
One-dish
meals instant noodles 26,98 D 44 Processed meat delicatessen product 14,77 C 45 Sweets chewing gum with
sweeteners 39,60 B 45
One-dish
meals instant noodles 26,98 C 45 Processed meat delicatessen product 14,77 D 46 Sweets chewing gum with
sweeteners 39,60 B 46
One-dish
meals instant noodles 26,78 C 46 Meat and eggs rabbit roulades 14,62 D 47 Sweets chewing gum with
sweeteners 39,48 B 47
One-dish
meals instant noodles 26,78 C 47 Meat and eggs rabbit roulades 14,62 D 48 Sweets chewing gum with
sweeteners 39,48 B 48
One-dish
meals instant noodles 26,78 C 48 One-dish meals delicatessen product 14,44 D 49 Sweets chewing gum with
sweeteners 39,48 B 49
One-dish
meals instant noodles 26,78 C 49 One-dish meals ham cake 14,24 D 50 Sweets chewing gum with
sweeteners 39,48 B 50
One-dish
meals instant noodles 26,75 C 50 Processed meat turkey ham 14,24 D
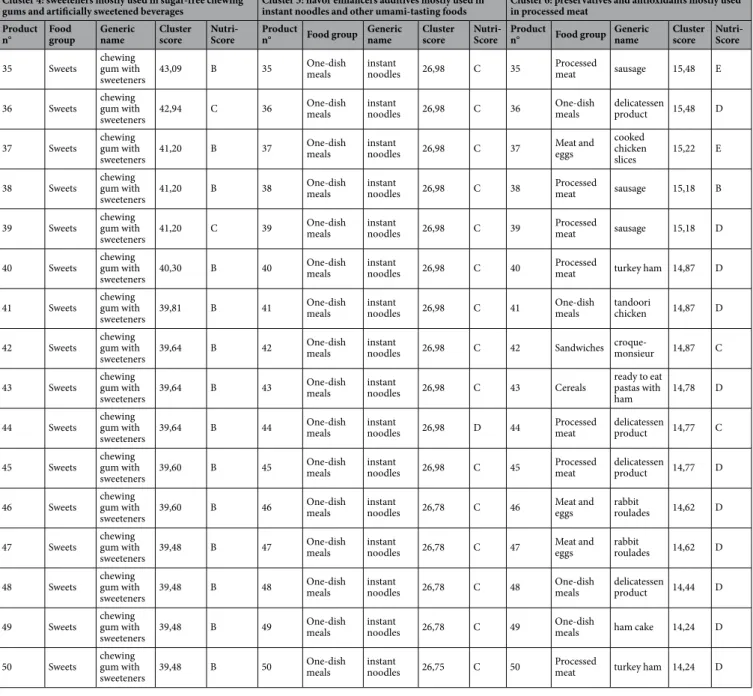
Table 1. Foods and beverage items most representative of each cluster of food additives, Open Food Facts
database, France 2019*. *This table displays the 50 food or beverage items with the highest score (synthetic cluster variable) for each of the 6 food additive clusters. Details on food additive clusters are available in Appendix 8. All food products in this table were categorized as NOVA “4”.
Discussion
This paper provides for the first time an overview of the presence and co-occurrences of food additives in 126,556 packaged food products available on the French food market. Food additives were present in 53.8% of products and covered a wide variety of categories illustrating their widespread use in French manufactured products. More than 10% of products contained 5 or more food additives. We identified 6 clusters of food additives frequently co-occurring in food products that were confirmed by network analysis and which corresponded to additives typically found in sweets, sandwiches & sugary desserts, biscuits & cakes, sugar-free chewing-gums & artificially sweetened beverages, instant noodles & other umami-tasting foods, and processed meat. The most frequently used food additives were citric acid, lecithins and modified starches (>10,000 products). Other additives of the top 50 were: sodium nitrite, potassium nitrate, carrageenan, monosodium glutamate, sulfite ammonia caramel, acesulfame K, sucralose, (di/tri/poly)phosphates, mono- and diglycerides of fatty acids, potassium sorbate, coch-ineal, potassium metabisulphite, sodium alginate, bixin and sodium carboxymethylcellulose.
A recent study by the French food observatory “Observatoire de l’Alimentation” (Oqali) evaluated the fre-quency of use of certain food additives and the evolution between 2012 and 2018 in a selection of food products61.
The most frequently used additives where consistent with our study (e.g. citric acid, modified starches and leci-thins in the top 3; acesulfame K as the most used sweetener). Their report suggests a diminution of the use of food additives since 2012 in half of the food categories studied, but an increase in some food additives such as carote-noids used as colors but also some artificial sweeteners (sorbitol syrup, sucralose in sweet beverages), and sulfites in aperitive products and salsas. Our study was based on a larger sample of manufactured products present on the French market (126,556 vs 30,125) and covered all food groups, whereas some categories such as sweets, chewing gums, and confectionary were not analyzed in the Oqali report.
For several frequently used additives (i.e. pertaining to the “top 50” in the present study), potential adverse health effects have been suggested in in-vivo/in-vitro, and - more rarely - epidemiological studies. For instance, sodium nitrite and potassium nitrate (e250/e252, 7144/1579 food products, respectively) have been associated in prospective cohorts with all-cause mortality (nitrates/nitrites from preserved/processed meat)23, and gastric and
pancreatic cancers21,22. Phosphates have been associated with vascular effects (e.g. endothelial dysfunction and
vascular calcification) in experimental studies among humans35,36. Monosodium glutamate (e621, 2021 products)
might have patho-physiological and toxicological effects on human health25,27 and was associated with overweight
in a prospective cohort26. Sulfites (among which potassium metabisulphite, e224, 1364 products) have been
asso-ciated with alteration of the gut and mouth microbiome in vitro at concentrations considered as safe for food62.
Nonnutritive sweeteners such as acesulfame K, sucralose and aspartame (e950/e955/e951, 1283/1161/669 prod-ucts, respectively) still have controversial effects on human cardiometabolic health and adiposity30 and have been
linked with hematopoietic neoplasia and gut microbiota alteration in experimental studies on rodents31–34. Sulfite
ammonia caramel (e150d, 913 products), present in almost every cola, might carry 4-methylimidazole (4-MEI) defined as possibly carcinogenic to humans by the International Agency for Research on Cancer, IARC40,41.
Carrageenan (e407, 5322 products) has been linked to fasting hyperglycemia and with exacerbated glucose
Figure 6. Network of food additives frequently co-occurring in food products generated by eLasso method,
intolerance and hyperlipidemia without effect on weight among mice24. Carboxymethylcellulose (e466, 891
prod-ucts) has been associated with changes in microbiota composition, intestinal inflammation and metabolic syn-drome (in-vivo)37,63–65, pro-inflammation (in-vivo, ex-vivo)66–69 and promotion of tumor development (in-vivo)38.
Finally, an experimental study among humans suggests a link between lecithins (e322, 13102 products) and coronary artery disease through the production of a proatherosclerotic metabolite, trimethylamine-N-oxide (TMAO)70. On the other hand, some food additives could be candidates for beneficial long-term health effects.
For instance, bixin (e160b, 1316 products) has shown reduction of postprandial inflammatory and oxidative stress responses to high-calorie meals in a human randomized-controlled trial71. Furthermore, ascorbic acid
(e300, 7919 products) used as an antioxidant might beneficially contribute to total ascorbic acid intake, as sug-gested by EFSA combined exposure assessment72). Also, some food additives such as extracts of rosemary (e392,
1055 products) could also be of interest as many of their components are phenolic acids. Finally, sodium alginate (e401, 1032 products) has been suggested to improve liver steatosis, insulin resistance, chronic inflammation, and oxidative stress, preventing the development of liver tumorigenesis among obese and diabetic mice73. Contrasted
health effects have been suggested in experimental data for modified starches. For instance, distarch phosphate (e1412) and hydroxypropyl-distarch phosphate (e1442) showed potential beneficial effects on postprandial glycaemia and insulin response in human trials74,75. In contrast, maize hydroxypropylated distarch phosphate
(e1442) promoted a less varied microbiota in faeces of healthy infant donors of 2–3 months of age76.
The two methods used to identify food additives frequently co-occurring in food products were comple-mentary. In the IsingFit methods, the edges in a network represent conditional dependencies: if there is an edge between additive X1 and X2, they are related even after controlling for all other connections in the network. If two variables X2 and X3 are not connected in the network representation, it means that they are not directly related, but they might be correlated by sharing connections with other variables in the network. When condi-tioned on all other variables, the relationship between X2 and X3 disappears — it is explained away by the other variables. On the other side, the ClustOfVar method groups together variables which are strongly related to each other (directly or indirectly) and does not adjust for other variables as this is not the aim of a clustering method. Despite small discrepancies due to these methodological differences, the two methods provided overall consistent results, as highlighted when the network obtained by eLasso was colored according to the clusters generated by the ClustOfVar method (Fig. 6).
Each food additive cluster occurred in several broad food sectors. Among the 6 clusters of food additives frequently co-occurring in food products identified in the present study, 2 clusters were found mostly in salty products (instant noodles and processed meat) and 4 clusters occurred mainly in sweet products (sweets, sand-wiches & sugary desserts, sugar-free chewing-gums & artificially sweetened beverages, and biscuits & cakes). The additives that constituted each cluster had sometimes complementary functional properties. For instance in clus-ter 3, main food additives where sodium carbonate (e500), diphosphates (e450), ammonium carbonates (e503) and glycerol (e422) which are widely used in biscuits and cakes as acidity regulators, stabilizers and emulsifiers.
More than 10% of manufactured products contained 5 or more additives. Thus, consumers are regularly exposed to mixtures of food additives, but this multiple exposure has rarely been studied in the literature. For instance, the 3 first food additives of cluster 3 (sodium carbonate (e500), diphosphates (e450) and lecithins (e322)) co-occur in 1667 products, mostly biscuits. Also, the cumulative exposure to the 3 first food additives of cluster 4 (acesulfame K (e950), aspartame (e951) and xylitol (e967)) could be of interest as these three additives co-occur in 87 products in our study sample, among which some very popular sugar-free chewing-gums.
So far, detailed information on potential cocktail effects is lacking but several studies started to suggest inter-actions and synergies between food additives. For example, mixes of colorings with sodium benzoate (e211) were associated with increased hyperactivity in 3-year-old and 8/9-year-old children45. Neurotoxic effects were also
observed between combinations of brilliant blue (e133) with L-glutamic acid (e620), and quinoline yellow (e104) with aspartame (e951) in vitro46 and a mixture of food coloring additives increased oxidative stress in rats47.
Future prospective studies and experimental research should investigate the effects of chronic exposures to these cocktails of food additives, as consumed in real life.
Strengths of our study included the large number of food and beverage items displayed by the Open Food Facts database and the originality of the cluster and network-based statistical approach applied to depict the food additives frequently co-occurring in food products. Conversely, some limitations should be acknowledged. First, the collaborative Open Food Facts database does not exhaustively cover all industrial food items available on the French market. Such exhaustive formulation database does not exist so far. However, it provides an extensive cov-erage with nearly 130,000 complete references of different products, and its crowdsourced nature by consumers guarantees the fact that all frequently consumed products are registered. Second, as any contributor-based data, some errors in food composition may not be excluded and some formulation data may have evolved since their entry in the database. However, despite the fact that the information is contributor-based, errors are minimized by performant text and picture recognition algorithms allowing automated checks. Besides, systematic control campaigns including random sampling and checking of food products as well as update of information (taking into account reformulations) are regularly performed. Moreover, an increasing number of manufacturers regu-larly implement their validated data directly in the system. Third, this study focused on the presence/absence of additives in food products, without data on the doses of additives used. Such information is not mandatory on food labels in the current regulation. Using the relative position of additives in the ingredient list would provide very little information on the real additive amounts. Indeed, additives are generally all mentioned at the end of the ingredient list since their amounts are much lower than main ingredients (flour, sugar, etc.). Regarding rela-tive amounts between addirela-tives, ingredient list would bring no information for all food products with only one additive (i.e. 33% of products containing additives). Besides, even if the order of additives in the ingredients’ list is similar between two food products, it may represent very different absolute amounts of additives in the two prod-ucts. However, the paradigm “the dose makes the poison” is currently being challenged in toxicology, with effects
at very low doses suggested for many chemical substances. Thus, the information on presence/absence of addi-tives is already interesting in itself. Next, the Open Food Facts database does not provide information on sales, so it was not possible to weight the analysis according to purchase volumes or frequency. To obtain a complete picture of mixtures of food additives frequently ingested, the next step will be to merge the present composition data with detailed consumption data (which is even more accurate than sales data at the individual level). Finally, on food packaging, the detail on the type of modified starch is often not specified and only the broad category “modified starch” is mentioned. Thus, the number of products containing each of the specific modified starches may be underestimated in the database.
This study illustrates the widespread of food additives in foods available on the French market and allowed us to identify 6 clusters of frequently co-occurring food additives. It is important that this type of industrial food composition database remains open-access and freely available to guarantee the transparency for the consumers and for public researchers and stakeholders, making it possible to monitor the trends in food additive use and to perform etiological research. To concretely expand etiological research on food additives and health, doses of additives should also be made available in complete transparency. As a key perspective of this study, our research team is currently launching a large-scale program on chronic exposure to mixtures of food additives and health that will notably rely on the NutriNet-Santé cohort77, in which commercial names and brands of industrial
prod-ucts consumed are reported by the participants through detailed and repeated dietary records, which is crucial for an accurate evaluation of exposure at the individual level, due to the high variability in additive composition between brands for a similar type of product. Within this framework, we have planned different strategies to col-lect quantitative information on food additive content, including ad hoc laboratory assays of strategic additives in specific food matrixes and pro-active collection of dose data from manufacturers. In the meanwhile and following the precautionary principle, French health authorities recommend to limit the consumption of ultra-processed foods and, in practice, to choose food products with a better nutritional quality (as scored by the Nutri-Score) and with no or as few additives as possible.
Received: 26 November 2019; Accepted: 13 February 2020; Published: xx xx xxxx
References
1. Monteiro, C. A. et al. Ultra-processed foods: what they are and how to identify them. Public Health Nutrition (2018).
2. Adams, J. & White, M. Characterisation of UK diets according to degree of food processing and associations with socio-demographics and obesity: cross-sectional analysis of UK National Diet and Nutrition Survey (2008–12). Int. J. Behav. Nutr. Phys.
Act. 12, 160 (2015).
3. Steele, E. M. et al. Ultra-processed foods and added sugars in the US diet: evidence from a nationally representative cross-sectional study. BMJ Open. 6, e009892 (2016).
4. Moubarac, J.-C., Batal, M., Louzada, M. L., Martinez Steele, E. & Monteiro, C. A. Consumption of ultra-processed foods predicts diet quality in Canada. Appetite. 108, 512–520 (2017).
5. Poti, J. M., Mendez, M. A., Ng, S. W. & Popkin, B. M. Is the degree of food processing and convenience linked with the nutritional quality of foods purchased by US households? Am. J. Clin. Nutr. 101, 1251–1262 (2015).
6. Slimani, N. et al. Contribution of highly industrially processed foods to the nutrient intakes and patterns of middle-aged populations in the European Prospective Investigation into Cancer and Nutrition study. Eur. J. Clin. Nutr. 63(Suppl 4), S206–225 (2009). 7. ANSES. Etude Individuelle Nationale des Consommations Alimentaires 3 (INCA 3). (2017).
8. Mendonca, R. D. et al. Ultraprocessed food consumption and risk of overweight and obesity: the University of Navarra Follow-Up (SUN) cohort study. Am. J. Clin. Nutr. 104, 1433–1440 (2016).
9. Mendonca, R. D. et al. Ultra-Processed Food Consumption and the Incidence of Hypertension in a Mediterranean Cohort: The Seguimiento Universidad de Navarra Project. Am. J. Hypertens. 30, 358–366 (2017).
10. Fiolet, T. et al. Consumption of ultra-processed foods and cancer risk: results from NutriNet-Santé prospective cohort. BMJ. k322,
https://doi.org/10.1136/bmj.k322 (2018).
11. Schnabel, L. et al. Association Between Ultra-Processed Food Consumption and Functional Gastrointestinal Disorders: Results From the French NutriNet-Santé Cohort. Am. J. Gastroenterol. 113, 1217–1228 (2018).
12. Schnabel, L. et al. Association Between Ultraprocessed Food Consumption and Risk of Mortality Among Middle-aged Adults in France. JAMA Intern Med, https://doi.org/10.1001/jamainternmed.2018.7289 (2019).
13. Adjibade, M. et al. The Inflammatory Potential of the Diet Is Associated with Depressive Symptoms in Different Subgroups of the General Population. J.Nutr. 147, 879–887 (2017).
14. Srour, B. et al. Ultra-processed food intake and risk of cardiovascular disease: prospective cohort study (NutriNet-Santé). BMJ 365, l1451 (2019).
15. Rico-Campà, A. et al. Association between consumption of ultra-processed foods and all cause mortality: SUN prospective cohort study. BMJ 365, l1949 (2019).
16. Kim, H., Hu, E. A. & Rebholz, C. M. Ultra-processed food intake and mortality in the United States: Results from the Third National Health and Nutrition Examination Survey (NHANES III 1988-1994). Public. Health Nutr. 22, 1777–1785 (2019).
17. Monteiro, C. A., Cannon, G., Lawrence, M., Costa Louzada, M. L. da & Pereira Machado, P. Ultra-processed foods, diet quality, and health using the NOVA classification system. Rome, FAO (2019).
18. Hall, K. D. et al. Ultra-Processed Diets Cause Excess Calorie Intake and Weight Gain: An Inpatient Randomized Controlled Trial of Ad Libitum Food Intake. Cell Metab. 30, 67–77.e3 (2019).
19. Database on Food Additives. https://webgate.ec.europa.eu/foods_system/main/?sector=FAD&auth=SANCAS.
20. European Food Safety Authority. Food Additives. European Food Safety Authority https://www.efsa.europa.eu/en/topics/topic/food-additives.
21. Song, P., Wu, L. & Guan, W. Dietary Nitrates, Nitrites, and Nitrosamines Intake and the Risk of Gastric Cancer: A Meta-Analysis.
Nutrients 7, 9872–9895 (2015).
22. Quist, A. J. L. et al. Ingested nitrate and nitrite, disinfection by-products, and pancreatic cancer risk in postmenopausal women. Int.
J. Cancer 142, 251–261 (2018).
23. Etemadi, A. et al. Mortality from different causes associated with meat, heme iron, nitrates, and nitrites in the NIH-AARP Diet and Health Study: population based cohort study. BMJ 357, j1957 (2017).
24. Bhattacharyya, S., O-Sullivan, I., Katyal, S., Unterman, T. & Tobacman, J. K. Exposure to the common food additive carrageenan leads to glucose intolerance, insulin resistance and inhibition of insulin signalling in HepG2 cells and C57BL/6J mice. Diabetologia.
25. Ataseven, N., Yüzbaşıoğlu, D., Keskin, A. Ç. & Ünal, F. Genotoxicity of monosodium glutamate. Food Chem. Toxicol. 91, 8–18 (2016).
26. He, K. et al. Consumption of monosodium glutamate in relation to incidence of overweight in Chinese adults: China Health and Nutrition Survey (CHNS). Am. J. Clin. Nutr. 93, 1328–1336 (2011).
27. Chakraborty, S. P. Patho-physiological and toxicological aspects of monosodium glutamate. Toxicol. Mech. Methods 29, 389–396 (2019).
28. Hagiwara, A. et al. A thirteen-week oral toxicity study of annatto extract (norbixin), a natural food color extracted from the seed coat of annatto (Bixa orellana L.), in Sprague–Dawley rats. Food Chem. Toxicol. 41, 1157–1164 (2003).
29. Uysal, H., Semerdöken, S., Çolak, D. A. & Ayar, A. The hazardous effects of three natural food dyes on developmental stages and longevity of Drosophila melanogaster. Toxicol. Ind. Health. 31, 624–629 (2015).
30. Azad, M. B. et al. Nonnutritive sweeteners and cardiometabolic health: a systematic review and meta-analysis of randomized controlled trials and prospective cohort studies. CMAJ. 189, E929–E939 (2017).
31. Bandyopadhyay, A., Ghoshal, S. & Mukherjee, A. Genotoxicity Testing of Low-Calorie Sweeteners: Aspartame, Acesulfame-K, and Saccharin. Drug. Chem. Toxicol. 31, 447–457 (2008).
32. Suez, J. et al. Artificial sweeteners induce glucose intolerance by altering the gut microbiota. Nature. 514, 181–186 (2014). 33. Soffritti, M. et al. Sucralose administered in feed, beginning prenatally through lifespan, induces hematopoietic neoplasias in male
swiss mice. Int. J. Occup. Env. Health 22, 7–17 (2016).
34. Abou-Donia, M. B., El-Masry, E. M., Abdel-Rahman, A. A., McLendon, R. E. & Schiffman, S. S. Splenda alters gut microflora and increases intestinal p-glycoprotein and cytochrome p-450 in male rats. J. Toxicol. Environ. Health Part. A 71, 1415–1429 (2008). 35. Ritz, E., Hahn, K., Ketteler, M., Kuhlmann, M. K. & Mann, J. Phosphate additives in food-a health risk. Dtsch. Arztebl Int. 109, 49–55
(2012).
36. McCarty, M. F. & DiNicolantonio, J. J. Bioavailable dietary phosphate, a mediator of cardiovascular disease, may be decreased with plant-based diets, phosphate binders, niacin, and avoidance of phosphate additives. Nutr. 30, 739–747 (2014).
37. Chassaing, B. et al. Dietary emulsifiers impact the mouse gut microbiota promoting colitis and metabolic syndrome. Nature. 519, 92–96 (2015).
38. Viennois, E., Merlin, D., Gewirtz, A. T. & Chassaing, B. Dietary Emulsifier-Induced Low-Grade Inflammation Promotes Colon Carcinogenesis. Cancer Res. 77, 27–40 (2017).
39. Viennois, E. & Chassaing, B. First victim, later aggressor: How the intestinal microbiota drives the pro-inflammatory effects of dietary emulsifiers? Gut Microbes. 9, 289–291 (2018).
40. Smith, T. J. S. et al. Caramel Color in Soft Drinks and Exposure to 4-Methylimidazole: A Quantitative Risk Assessment. PLoS One
10 (2015).
41. International Agency for Research on Cancer. 4-Methylimidazole. In IARC Monographs on the Evaluation of Carcinogenic Risks to Humans. vol. 101: Some Chemicals Present in Industrial and Consumer Products, Food and Drinking-water, pp. 447–459. (2013). 42. Bettini, S. et al. Food-grade TiO2 impairs intestinal and systemic immune homeostasis, initiates preneoplastic lesions and promotes
aberrant crypt development in the rat colon. Sci. Rep. 7, 40373 (2017).
43. Sasaki, Y. F. et al. The comet assay with 8 mouse organs: results with 39 currently used food additives. Mutat. Res. 519, 103–119 (2002).
44. Leo, L. et al. Occurrence of azo food dyes and their effects on cellular inflammatory responses. Nutrition. 46, 36–40 (2018). 45. McCann, D. et al. Food additives and hyperactive behaviour in 3-year-old and 8/9-year-old children in the community: a
randomised, double-blinded, placebo-controlled trial. Lancet 370, 1560–1567 (2007).
46. Lau, K., McLean, W. G., Williams, D. P. & Howard, C. V. Synergistic interactions between commonly used food additives in a developmental neurotoxicity test. Toxicol. Sci. 90, 178–187 (2006).
47. Başak, K. et al. Does maternal exposure to artificial food coloring additives increase oxidative stress in the skin of rats? Hum. Exp.
Toxicol. 36, 1023–1030 (2017).
48. Stevens, L. J. et al. Mechanisms of behavioral, atopic, and other reactions to artificial food colors in children. Nutr. Rev. 71, 268–281 (2013).
49. Chen, Z. et al. Combined effect of titanium dioxide nanoparticles and glucose on the cardiovascular system in young rats after oral administration. J Appl Toxicol, https://doi.org/10.1002/jat.3750 (2018).
50. Amchova, P., Kotolova, H. & Ruda-Kucerova, J. Health safety issues of synthetic food colorants. Regul. Toxicol. Pharmacol. 73, 914–922 (2015).
51. Codex General Standard for Food Additives (GSFA, Codex STAN 192-1995). http://www.fao.org/fao-who-codexalimentarius/sh-proxy/en/?lnk=1&url=https%253A%252F%252Fworkspace.fao.org%252Fsites%252Fcodex%252FStandards%252FCODEX%2BS TAN%2B192-1995%252FCXS_192e.pdf (2018).
52. Julia, C. et al. Application of the British Food Standards Agency nutrient profiling system in a French food composition database.
Br.J Nutr. 112, 1699–1705 (2014).
53. Chavent, M., Kuentz-Simonet, V., Liquet, B. & Saracco, J. ClustOfVar: An R Package for the Clustering of Variables. J. Stat. Softw. 50, 1–16 (2012).
54. Kiers, H. A. L. Simple structure in component analysis techniques for mixtures of qualitative and quantitative variables.
Psychometrika 56, 197–212 (1991).
55. van Borkulo, C. D. et al. A new method for constructing networks from binary data. Sci. Rep. 4, 5918 (2014).
56. Julia, C., Etilé, F. & Hercberg, S. Front-of-pack Nutri-Score labelling in France: an evidence-based policy. Lancet Public. Health 3, e164 (2018).
57. Egnell, M., Hercberg, S. & Julia, C. Development and validation of the Nutri-Score A colour-coded summary front-of-pack nutrition label. eFOOD Lab_International (2019).
58. Monteiro, C. A. et al. The UN Decade of Nutrition, the NOVA food classification and the trouble with ultra-processing. Public Health
Nutr. 1–13, https://doi.org/10.1017/S1368980017000234 (2017). 59. Monteiro, C. A. et al. NOVA. star. shines bright. 1(7), 28–38 (2016).
60. Moubarac, J.-C., Parra, D. C., Cannon, G. & Monteiro, C. A. Food Classification Systems Based on Food Processing: Significance and Implications for Policies and Actions: A Systematic Literature Review and Assessment. Curr. Obes. Rep. 3, 256–272 (2014). 61. Oqali. Bilan et évolution de l’utilisation des additifs dans les produits transformés. (2019).
62. Irwin, S. V., Fisher, P., Graham, E., Malek, A. & Robidoux, A. Sulfites inhibit the growth of four species of beneficial gut bacteria at concentrations regarded as safe for food. PLOS ONE 12, e0186629 (2017).
63. Holder, M. K. & Chassaing, B. Impact of food additives on the gut-brain axis. Physiol. Behav. 192, 173–176 (2018).
64. Zinöcker, M. K. & Lindseth, I. A. The Western Diet-Microbiome-Host Interaction and Its Role in Metabolic Disease. Nutrients 10 (2018).
65. Roca-Saavedra, P. et al. Food additives, contaminants and other minor components: effects on human gut microbiota-a review. J.
Physiol. Biochem. 74, 69–83 (2018).
66. Chassaing, B., Van de Wiele, T., De, B. J., Marzorati, M. & Gewirtz, A. T. Dietary emulsifiers directly alter human microbiota composition and gene expression ex vivo potentiating intestinal inflammation. Gut 66, 1414–1427 (2017).
67. Viennois, E. & Chassaing, B. First victim, later aggressor: How the intestinal microbiota drives the pro-inflammatory effects of dietary emulsifiers? Gut Microbes 1–4, https://doi.org/10.1080/19490976.2017.1421885 (2018).
68. Swidsinski, A. et al. Bacterial overgrowth and inflammation of small intestine after carboxymethylcellulose ingestion in genetically susceptible mice. Inflamm. Bowel Dis. 15, 359–364 (2009).
69. Martino, J. V., Van Limbergen, J. & Cahill, L. E. The Role of Carrageenan and Carboxymethylcellulose in the Development of Intestinal Inflammation. Front. Pediatr. 5, 96 (2017).
70. Tang, W. H. W. et al. Intestinal Microbial Metabolism of Phosphatidylcholine and Cardiovascular Risk. N. Engl. J. Med. 368, 1575–1584 (2013).
71. Roehrs, M. et al. Annatto carotenoids attenuate oxidative stress and inflammatory response after high-calorie meal in healthy subjects. Food Res. Int. 100, 771–779 (2017).
72. Scientific Opinion on the re-evaluation of ascorbic acid (E 300). sodium ascorbate (E 301) and calcium ascorbate (E 302) as food additives. EFSA J. 13, 4087 (2015).
73. Miyazaki, T. et al. Sodium alginate prevents progression of non-alcoholic steatohepatitis and liver carcinogenesis in obese and diabetic mice. Oncotarget 7, 10448–10458 (2016).
74. Shimotoyodome, A., Suzuki, J., Kameo, Y. & Hase, T. Dietary supplementation with hydroxypropyl-distarch phosphate from waxy maize starch increases resting energy expenditure by lowering the postprandial glucose-dependent insulinotropic polypeptide response in human subjects. Br. J. Nutr. 106, 96–104 (2011).
75. Stewart, M. & Zimmer, J. A High Fiber Cookie Made with Resistant Starch Type 4 Reduces Post-Prandial Glucose and Insulin Responses in Healthy Adults. Nutrients 9, 237 (2017).
76. González-Bermúdez, C. A., López-Nicolás, R., Peso-Echarri, P., Frontela-Saseta, C. & Martínez-Graciá, C. Effects of different thickening agents on infant gut microbiota. Food Funct. 9, 1768–1778 (2018).
77. Hercberg, S. et al. The Nutrinet-Sante Study: a web-based prospective study on the relationship between nutrition and health and determinants of dietary patterns and nutritional status. BMC Public. Health. 10, 242 (2010).
Acknowledgements
The authors warmly thank the Open Food Facts team and contributors. This work was supported by a PhD grant from Paris 13 University (E. Chazelas), by a Post-doctoral fellowship from the Fondation pour la Recherche Médicale (ARF201809007046, M. Deschasaux), by the French Ministry of Health (DGS Arrêté 29 Novembre 2019), The French National Cancer Institute (INCa_14059) and the European Research Council (ERC CoG ADDITIVES_864219). The authors declare no competing interest and financial relationships with any organization that might have an interest in the submitted work in the previous three years; no other relationships or activities that could appear to have influenced the submitted work. Researchers were independent from funders. Funders had no role in the study design, the collection, analysis, and interpretation of data, the writing of the report, and the decision to submit the article for publication. Open Food Facts is a non-profit association. The Open food facts data-base is available in open-access: https://world.openfoodfacts.org/data.
Author contributions
E.C. and M.T. Designed the research; S.G. and P.S. coordinated the constitution of the Open Food Facts Database; E.C. Performed statistical analysis; M.T. Supervised statistical analysis; E.C. Drafted the manuscript; M.T. Supervised the writing; E.C., M.D., B.S., E.K.G., C.J., B.A., N.D.P., P.G., S.H., P.L.M., Y.E., P.S., S.G. and M.T. Contributed to the data interpretation and revised each draft for important intellectual content. All authors read and approved the final manuscript. M.T. Had primary responsibility for the final content, she is the guarantor. None of the authors reported a conflict of interest related to the study. The funders had no role in the design, implementation, analysis, or interpretation of the data. The corresponding author (E.C.) attests that all listed authors meet authorship criteria and that no others meeting the criteria have been omitted.
Competing interests
The authors declare no competing interests.
Additional information
Supplementary information is available for this paper at https://doi.org/10.1038/s41598-020-60948-w.
Correspondence and requests for materials should be addressed to E.C. Reprints and permissions information is available at www.nature.com/reprints.
Publisher’s note Springer Nature remains neutral with regard to jurisdictional claims in published maps and
institutional affiliations.
Open Access This article is licensed under a Creative Commons Attribution 4.0 International
License, which permits use, sharing, adaptation, distribution and reproduction in any medium or format, as long as you give appropriate credit to the original author(s) and the source, provide a link to the Cre-ative Commons license, and indicate if changes were made. The images or other third party material in this article are included in the article’s Creative Commons license, unless indicated otherwise in a credit line to the material. If material is not included in the article’s Creative Commons license and your intended use is not per-mitted by statutory regulation or exceeds the perper-mitted use, you will need to obtain permission directly from the copyright holder. To view a copy of this license, visit http://creativecommons.org/licenses/by/4.0/.