HAL Id: halshs-01385002
https://halshs.archives-ouvertes.fr/halshs-01385002
Preprint submitted on 20 Oct 2016
HAL is a multi-disciplinary open access archive for the deposit and dissemination of sci-entific research documents, whether they are pub-lished or not. The documents may come from teaching and research institutions in France or abroad, or from public or private research centers.
L’archive ouverte pluridisciplinaire HAL, est destinée au dépôt et à la diffusion de documents scientifiques de niveau recherche, publiés ou non, émanant des établissements d’enseignement et de recherche français ou étrangers, des laboratoires publics ou privés.
Evidence from Developing Countries
Idrissa Ouedraogo, Samuel Guérineau, Relwende Sawadogo
To cite this version:
Idrissa Ouedraogo, Samuel Guérineau, Relwende Sawadogo. Life Insurance Development and Eco-nomic Growth: Evidence from Developing Countries. 2016. �halshs-01385002�
C E N T R E D'E T U D E S E T D E R E C H E R C H E S S U R L E D E V E L O P P E M E N T I N T E R N A T I O N A L
SÉRIE ÉTUDES ET DOCUMENTS
Life Insurance Development and Economic Growth: Evidence from
Developing Countries
Idrissa Ouédraogo
Samuel Guérineau
Relwendé Sawadogo
Études et Documents n° 16
October 2016To cite this document:
Ouédraogo I., Guérineau S., Sawadogo R. (2016) “Life Insurance Development and Economic Growth: Evidence from Developing Countries”, Études et Documents, n° 16, CERDI.
http://cerdi.org/production/show/id/1827/type_production_id/1
CERDI
65 BD. F. MITTERRAND
63000 CLERMONT FERRAND – FRANCE TEL.+33473177400
FAX +33473177428
2
The authors
Idrissa Ouédraogo, Professor, CEDRES - Université Ouaga 2, Burkina Faso. E-mail : [email protected]
Samuel Guérineau, Associate Professor, CERDI – Clermont Université, Université d’Auvergne, UMR CNRS 6587, 65 Bd F. Mitterrand, 63009 Clermont-Ferrand, France.
E-mail: [email protected]
Relwendé Sawadogo, Ph.D in Economics, Temporary Teacher and Researcher, CERDI – Clermont Université, Université d’Auvergne, UMR CNRS 6587, 65 Bd F. Mitterrand, 63009 Clermont-Ferrand, France.
E-mail: [email protected]
Corresponding author: Relwendé Sawadogo
This work was supported by the LABEX IDGM+ (ANR-10-LABX-14-01) within the program “Investissements d’Avenir” operated by the French National Research Agency (ANR).
Études et Documents are available online at: http://www.cerdi.org/ed
Director of Publication: Vianney Dequiedt Editor: Catherine Araujo Bonjean
Publisher: Mariannick Cornec ISSN: 2114 - 7957
Disclaimer:
Études et Documents is a working papers series. Working Papers are not refereed, they
constitute research in progress. Responsibility for the contents and opinions expressed in the working papers rests solely with the authors. Comments and suggestions are welcome and should be addressed to the authors.
3
Abstract
This article examines the relation between the development of life insurance sector and economic growth, for a sample of 86 developing countries over the period 1996-2011. We also examine the heterogeneous effect of life insurance on growth. The econometric results show on the one hand that the development of life insurance has a positive effect on economic growth per capita and, on the other hand, that this effect varies according to the structural characteristics of countries. Thus, the marginal positive impact of the development of life insurance decreases with the levels of deposit interest rate, bank credit and stock market value traded, while the effect is greater in countries with high-quality institutions. Finally, life insurance effect on growth is less for SSA and British legal system countries, compared to non-SSA and non-British legal system countries.
Keywords
Life insurance market, Economic growth, Developing countries.
JEL codes
4 1. Introduction
In the course of recent years, insurance sector in particular its life branch, in developing countries knows an increase even if the level of development of this one remains low comparatively to developed countries. Indeed, life insurance penetration in economy (life insurance premiums total volume as a percentage of GDP) of low and middle income countriesrose from 0.19% of GDP in 1996 to 0.30% in 2011, while at the world level, it rose from 0.43% to 0.70 and this one of high-income countries 2.01 percent to 2.20 in the course of the same period1.Thus, life insurance premiums have increased by 60.21% in low and middle income countries, while it has increased that 9.43% in high-income countries for period 1996 to 2011. This shows that the relative share of life insurance sector in domestic economy increases faster in developing countries than at the world level and at developed countries level.
Development of life insurance sector like all the financial intermediaries has a significant training effects on economy. Life insurance companies all as the contractual savings institutions, in addition to offer a social protection to economic agents, are specialized in mobilization of domestic savings from many small investors; and to channel it to productive investment opportunities (Dickinson, 2000). In addition, the insurance companies all as mutual fund companies of investment and retirement are the largest institutional investors on the stock, bond and real estate markets (Haiss and Sümegi, 2008).For example, life insurance companies as investment vehicle, incite to a higher level of specialization and professionalism of the part of financial market participants (enterprises and financial institutions). This allows to finance the projects that are more daring, to exploit the economies of scale by reducing the transaction costs and to encourage the financial innovation (Catalan et al., 2000; Impavido et al., 2003). In this context, it is interesting to know if the development of life insurance sector contributes to economic growth in developing countries.
Furthermore, since first session in 1964, UNCTAD formally acknowledged that “a sound
national insurance and reinsurance market is an essential characteristic of economic growth2”. In the stride, the economic literature (Ward and Zurbruegg, 2000; Webb et al.,
2002; Kugler and Ofoghi, 2005) has shown that the economic growth and the development of
1
Martin Čihák, Aslı Demirgüç-Kunt, Erik Feyen, and Ross Levine, 2012. "Benchmarking Financial Systems Around the World." World Bank Policy Research Working Paper 6175, World Bank, Washington, D.C. 2 Proceedings of the United Nations Conference on Trade and Development (1964), Final Act and Report, p.55, annex A.IV.23.
5
insurance sector are interdependent and that an economy without insurance services would be much less developed and stable. Indeed, a sector of insurance more developed and in particular life insurance provides long and stable maturity funds for development of public infrastructure and at the same time, reinforce the country's financing capacity (Dickinson, 2000).
However, until now, most of the empirical works on financial sector have focused more on effect of banking sector and stock market on economic growth (Beck and Levine, 2004). Although, the literature (Skipper, 1997) has highlighted the contribution to life insurance sector on economic growth, it has hardly been studied empirically especially in developing countries and those with low-income. The empirical studies on impact of the development of life insurance sector on growth are more focused on developed and emergingcountries (Ward and Zurbruegg, 2000; Webb et al., 2002; Arena, 2008; Avram et al. 2010; Chen et al. 2012; Lee et al, 2013; etc.).
In this context, the goal of this paper is to contribute to literature, by assessing the empirical effect of the development of life insurance on economic growth and to highlight heterogeneity of life insurance effect among countries. Thus, the sample is constituted of 86 developing and emerging countries3 over the period 1996-2011. Firstly, we use a linear model to analyze the direct effect of life insurance premiums on real GDP per capita growth and secondly, we test the presence of non-linearity in impact of life insurance penetration. To accomplish this task, the regressions are realized by the method of instrumental variables developed by Baum et al. (2007) in order to overcome at best the endogeneity bias that arise from reverse causality and / or omitted variables. Thus, we used the percentage of the Muslim population and life insurance penetration lagged two periods as instruments of the development of life insurance. In addition, the legal origin code is used as instrument for banking and stock market variables in non-linearity model.
The contribution of this study to empirical literature is at two levels. Firstly, this study provides empirical evidence to literature on the relationship between life insurance and economic growth by using a much larger sample of developing countries compared to previous studies (Webb et al., 2002; Arena, 2008 and Chen et al, 2012). Secondly, we highlight the presence of heterogeneity in impact of the development of life insurance on growth by including interaction variables. This allows us to go beyond the direct effect and to
6
analyze the conditional effects of impact of the development of life insurance on the economic growth in developing countries. These conditional variables are financial, income, regional and institutional. Thus, the conditional coefficients will allow also to know if life insurance effect is mitigated (negative coefficient) or magnified (positive coefficient) by these conditional variables.
The rest of the paper is organized as follows. Section 2 provides a brief review of empirical literature on the relationship between the development of life insurance market activity and economic growth. The section 3 presents the methodology of estimation and the different variables of this study. Section 4 presents and discusses our main results, while Section 4 concludes and draws some policy implications.
2. Review of the relationship between life insurance and economic growth literature.
In this section we shed light on the role of life insurance and its contribution to economic development and we do an overview of the main empirical conclusions by having analyzed the relationship between the development of life insurance and economic growth. A more detailed listing can be found in Appendix A-1.
Regarding to the life insurance supply, the existing studies (Skipper, 1997; Skipper and Kwon, 2007; Arena, 2008) have showed that the insurance industry contributes to economic growth. Indeed, insurance activity encourages the economic development through various channels: it reduces the costs of the necessary financing for firms, stimulates the investments and innovation by creating an economic environment that is more certain; insurers are strong partners in development of a social protection system of workers, in particular in the retirement and health coverage and as institutional investors, the insurers also contribute to the modernization of the financial markets and facilitate the accumulation of new capital by firms (Skipper, 1997; Dickinson, 2000; Skipper and Kwon, 2007; Njegomir and Stojić, 2010). The empirical literature on the relationship between financial development and economic growth is more focused on banking development and financial market (Levine, 1998 and 1999; Levine and Zervos, 1998; Levine et al., 2000; Beck and Levine, 2004). Some research on the link between the economic growth and life insurance development are more concerned by the effects of growth on the consumption of life insurance rather than the inverse relationship (Outreville, 1996; Enz, 2000; Beck and Webb, 2003; Chang and Lee, 2012).
7
The literature has analyzed the role of life insurance on economic growth from several angles. First, there are studies which properly are concerned with the causality between life insurance premiums and economic growth.Thus, Ward and Zurbruegg (2000) indicate that in long run, there is a bidirectional causal relationship between real insurance premiums and real GDP for Australia, Canada, Italy, and Japan, whereas a unidirectional causality exist from real GDP to real insurance premiums for France. In interpreting the findings, the authors refer to cultural predispositions towards uncertainty avoidance (Hofstede, 1995; Fukuyama, 1995) and resulting propensity for insurance and the effects of regulation for explain this situation. Kugler and Ofoghi (2005) analyzed also the causality between insurance premiums and economic growth on the period 1966-2003 for United Kingdom. Through the Johansen cointegration test, they highlight a causality running from insurance to economic growth. Then, Webb et al. (2005) also found a bidirectional causality between life insurance and economic growth for a sample of 55 developed and emerging countries. By using a vector error correction model (VECM), Vadlamannati (2008) analyzed the short-run causality between life and non-life insurance and economic growth in India and indicated there is a bidirectional causality between life insurance sector and economic growth.In contrast, Adams et al. (2009) provided evidence of unidirectional causality running from insurance to economic growth, but with no reverse effect, in the case of Sweden. Finally, Lee et al. (2013) have used the cointegration technique to examine the relationship between life insurance premiums and growth in 41 countriesaccording to their economic development level during the course of the period 1979-2007. The results show that there is a relationship of long-term equilibrium between real GDP per capita and life insurance demand. Thus, the estimated long-term results indicate that life insurance demand contributes positively to real GDP growth. Then, they also show the presence of bidirectional causality between life insurance premiums and economic growth at short-term and long-term.
In addition to the studies on the causality between life insurance premiums and economic growth, there are those which have analyzed the empirical impact of the development of life insurance on economic growth. Thus, Avram et al. (2010) have examined the relationship between insurance and economic growth over the 1980-2006 period using both Ordinary Least Squares (OLS) on cross-sectional data and Generalized Method of Moments (GMM) estimations on panel data. They found a positive effect of the insurance (life and non-life) on growth. They also show that at the disaggregated level, life insurance and non-life premiums per capita have a positively influence on economic growth. Then, Hou et al. (2012) have
8
studied the impact of financial institutions on economic growth on a panel of 12 European countries during the period 1980-2009. They use a fixed effects model and find that life insurance development and banking activity are important determinants of economic development. Finally, Keke and Houedokou (2013) have analyzed the contribution of insurance (life and non-life insurance)to economic growth in WAEMU1 countries during the period 1999-2009. They also made a comparative analysis between the results of WAEMU countries and those of CEMAC2. The estimation of a dynamic panel grouping all the countries of the African Franc Zone did not provide clear results on the contribution of insurance sector to economic growth. Furthermore, the results conclude that there is no significant effect of life insurance on economic growth in the WAEMU and CEMAC zone, while the non-life3 insurance has a significant effect.
Regarding the empirical analysis of nonlinear effects of life insurance on economic growth, Arena (2008) has showed that life insurance positively influences economic growth in 56 countries (both developed and developing). More specifically, he establishes that impact of life insurance on economic growth is driven by high-income countries only. Furthermore, the results indicate that the financial development and insurance sector have complementary effects on economic growth. In other terms, life insurance has a bigger impact on economic growth in country with stock market development deeper, particularly for intermediate and high stages of stock market development. As regards Chen et al. (2012), they have analyzed life insurance effect on economic growth and the conditions factors that affect the relationship between life insurance market and economic growth. Thus, the insurance-growth nexus varies across countries with different conditions. For example, the positive impact on economic growth is mitigated in middle-income countries, but amplified in low-income countries. Moreover, both the development of stock market and life insurance market are substitutes rather than complements.
Our study is in continuity of two previous studies (Arena, 2008 and Chen et al., 2012) by adopting the same methodology but differs in several levels.First, this study goes beyond that of Chen et al. (2012) by introducing the variables of the institutions quality and legal environment to analyze the heterogeneities.Indeed, the taking into account of the institutions
1 WAEMU: West Africa Economic and Monetary Union includes Benin, Burkina Faso, Ivory Coast, Mali, Niger, Senegal, Togo and Guinea-Bissau.
2
CEMAC: Central African Economic and Monetary Community includes Cameroon, Congo, Gabon, Equatorial Guinea, Central African Republic and Chad.
9
quality as conditional factors is justified by the fact that the effect of institutional environment on the development of life insurance in high-income economies is not as significant as those in low-income economies (Outreville, 2008). Thus, according Outreville (2008), the quality of institutions has more effect in developing countries than in developed countries. Hence, the interaction variable between life insurance premiums and institutions quality also allows to capture to what extent the marginal effect of life insurance premiums is influenced by the quality of institutional environment. Secondly, unlike studies of Arena (2008) and Chen et al (2012) we use a larger sample of developing countries and a relatively long period (1996-2011) to take advantage on maximum information contained in the data. Finally, at the estimation method level, we use technique of instrumental variables (IV/GMM) developed by Baum et al (2007) that is robust in the presence of heteroscedasticity of the errors.
3. The econometric strategy and data
3.1. The econometric model and estimation method
Our empirical strategy to test the effect of the development of life insurance on economic growth, uses the methodology by Beck and Levine (2004) to analyze the empirical relationship between banks, stock markets and economic growth. Thus, our regression equation of growth is defined as follows:
Yi,t− Yi,t−1 = α ∗ Yi,t−1+ β ∗ INSi,t+ δ′∗ X
i,t+ η𝑡+ εi,t (1)
Where (Yi,t− Yi,t−1) is real GDP per capita growth4, X represents a vector of control variables
(population growth5, index of human capital, domestic investment, inflation, government consumption, openness to trade and terms of trade), Yi,t−1, the logarithm of initial GDP per
capita to control the conditional convergence effect of the standard Solow-Swan growth theory and INS is life insurance penetration6 defined as ratio of life insurance premiums to GDP. ηi is time fixed effects, εi,tis the idiosyncratic error term and thesubscripts i= 1,…, N
4 We use the following approximation to calculate the real GDP per capita growth between t et t − 1 : yt−yt−1 yt = ∆yt
yt ≅ Ln(yt) − Ln(yt−1).
5According to literature on growth regressions to Solow, authors such as Mankiw et al. (2002), Caselli et al. (1996) or Hoeffler (2002) make assuming of a rate of technical progress and of a depreciation rate of the physical capital constants, the sum of which is 𝜌 + 𝑑 = 0.05. This is why the variable of population used in the regressions is actually the logarithm of the sum of the population growth rate and 0.05.
6
We also study an alternative measure of insurance development commonly used in the literature, life insurance density, to test the robustness of our results.
10
and t= 1,…, T represent country and time period, respectively. In equation (1), β is our coefficient of interest and allows to determine the direct effect of life insurance premiums on economic growth. We anticipate a positive sign for β. Furthermore, the convergence hypothesis between the economies studied suggests that the coefficient (α ) of Yi,t−1 is
negative and significant in our growth model, ie 0 < 1 + α < 1.
To examine the heterogeneity for the effect of life insurance on economic growth, we specify an augmented version of equation (1) as follows:
Yi,t− Yi,t−1= α′∗ Yi,t−1+ β′∗ INSi,t+ ρ ∗ [INSi,t∗ Mi,t] + γ ∗ Mi,t+ θ′∗ Xi,t+ ηt′
+ εi,t (2) Where Mi,t represents the conditional variables of country-specific structural characteristics which are financial, economic development level, region and institutions quality and legal system.
The four categories of conditional variables defined above include variables described as follows: first, to determine whether the effect of life insurance demand on growth is influenced by the development of local financial institutions, we retain the private credit by deposit money banks to GDP, interest rate of bank deposits and stock market total value traded to GDP. Indeed, insurance market activity cannot only contribute directly to economic growth, by itself but also through complementarities with banking sector and stock market. Thus, by reducing information and transaction costs, pooling risk, enhancing financial intermediation through the channeling of savings to domestic investment, and fostering a more efficient capital allocation through the gathering of substantial firm information, insurance activity may contribute to reinforcing the process of resource allocation done by banks and capital markets (Arena, 2008). In contrast, life insurance sector activity may have a substitution effect with banking sector in the mobilization of savings by reducing the market shares of other financial systems particularly in developing countries (Allen and Santomero, 2001). Then, heterogeneity related to the economic development level is proxied by income per capita of country. Thus, we introduce dummies for Low and Middle income (LMY) and for Upper Middle income (UMC). Regional condition variables are defined by the dummies of Sub-Saharan Africa (SSA), Europe and Central Asia (ECA), Latin America and Caribbean (LAC), Middle East and North Africa (MNA), South Asia (SAS) and East Asia and Pacific (EAP). Finally, last category of conditional variable measures the institutions quality that are bureaucratic quality, control of corruption and Law and order. In addition to these institutional
11
indicators, we capture the overall effect of the institutions quality by the average of these three indicators (IQ). But before introducing these indicators in econometric estimates, we normalize them on a scale of 0-1 in order to facilitate the calculation of the composite index of the institutions quality (IQ) and comparisons of the different equations. A higher score represents a better institutional quality. We also analyze the effect of legal environment, by introducing the dummies for British legal system (British) and french (French).
From the equations (1) and (2), the marginal effect of life insurance premiums on economic growth can be determined as follows:
∂(Yi,t− Yi,t−1)
∂INSi,t = β (3)
∂(Yi,t− Yi,t−1)
∂INSi,t = β′+ ρMi,t (4) Equation (3) is obtained from equation (1) and aims at measuring the direct effect of life insurance premiums on growth (β). Equation (4) result of the equation (2); the term (ρMi,t) represents the indirect effect and (β′+ ρM
i,t ) is the marginal effect of the development of life
insurance on economic growth. More specifically, if β′> 0 and ρ < 0 then life insurance development has a positive link with economic growth and a negative coefficient for the variable Mi,t apparently reduces positive impact of the particular life insurance development on economic growth. On the other hand, if β′> 0 and ρ > 0, then the conditional variable Mi,t favorably affects that positive impact of the development of life insurance.
The estimate of the influence of life insurance premiums on growth (equation 1 and 2) by OLS estimator raises a number of problems of which the most important constitutes the endogeneity bias. Indeed, this problem may originate from a number of sources. The existence of a correlation between the dependent variable lagged and individual effects leads OLS estimators biased and not convergent. Also in the case of reverse causality or omission of variables, OLS estimator is inconsistent and biased. To face these problems, we draw on instrumental variables techniques and thus on several instruments to estimate the impact of the life insurance activity on economic growth. Thus, we instrument the development of life insurance by the percentage of the Muslim population and the value of life insurance premiums lagged two years. Indeed, previous studies have shown that Muslims believe that the purchase of life insurance is inconsistent with the Koran. Thus, they have found that the proportion of Muslim population has a negative and significant effect on the demand for life
12
insurance (Browne and Kim, 1993; Webb et al. 2002; Ward and Zurbruegg, 2002; Beck and Webb, 2003; Feyen et al, 2011).
However, even whether there are mechanisms to circumventing to formal assurance in the Muslims countries through the creation of Islamic insurance as Takaful insurance, we always note that in these countries a low consumption of life insurance. Thus, we think that the instrument is relevant. Then, by basing on work of Laporta et al. (1998), we use legal origin system dummy (English or French) as instruments of banking and stock market variables in our equation (2). In addition, life insurance indicator lagged two years and conditional variable is also used as instrument in our augmented equation (2). Thus, the equations (1) and (2) are estimated with the heteroskedastic-efficient two-step generalized method of moments (IV-GMM) estimator developed by Baum et al (2007), which generates efficient coefficients as well as consistent standard errors estimates. Indeed, the advantages of IV-GMM over IV are clear: if heteroskedasticity is present, the IV-GMM estimator is more efficient than the simple IV estimator, whereas if heteroskedasticity is not present, IV-GMM estimator is no worse asymptotically than the IV estimator (Baum et al. 2007).
3.2. Definition of data sources and statistical analyses
The data used in this study are annual data from 1996 to 2011 for 86 developing countries (see Appendix A-4 for countries list). Our main variable of interest, life insurance premiums total value to GDP measures the penetration of insurance activity in economy, and is obtained from the database «Benchmarking Financial Systems Around the World» of Čihák et al. (2012). To test, the robustness of our results, we have recourse to life insurance premiums per capita (life insurance density)7 as an alternative measure of the consumption of life insurance. The financial condition variables such as the bank credit to private sector and rate of stock market transaction and bank deposit interest rate, also come from Čihák et al. (2012). Real GDP per capita growth defined by the logarithm difference of real GDP per capita is extracted from World Development Indicators (2014) compiled by the World Bank. Similarly, population growth, inflation rate, government consumption,openness to trade, terms of trade, dummies of the economic development level (Low and Middle income = LMY and Upper Middle income = UMC) and regional dummies (Sub-Saharan Africa, Europe and Central
13
Asia, Latin America and Caribbean, Middle East and North Africa, South Asia and East Asia and Pacific) all taken from World Development Indicators. The human capital index is derived from Penn World Table 8.0. Finally, the variables of the institutions quality condition are extracted from International Country Risk Guide (CGRI) database, (2013) Appendix A-2 presents full definitions and sources of the different variables.
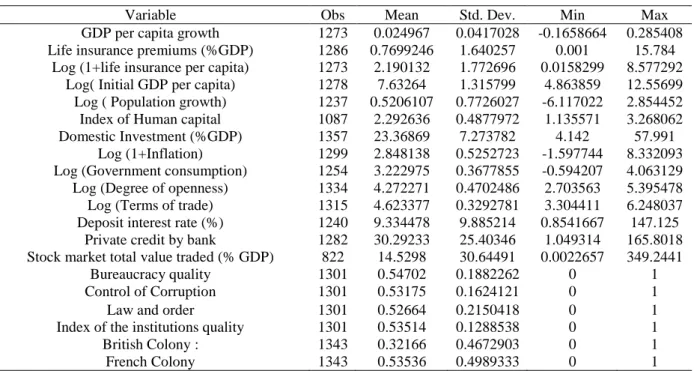
The table 1 presents descriptive statistics of our variables in basic model. There is considerable variation in share of life insurance premiums in GDP across countries, ranging from 0.001% in Albania (average 2011) to 15.784% in South Africa (average 1996-2011). Real GDP per capita growth also shows variation, ranging from -0.165 in Madagascar to 0.2854 in Azerbaijan (both for 1996-2011). Most of the control variables also presents disparities between countries in the period.
Table 1:Summary statistics
Variables Obs Mean Std. Dev. Min Max
GDP per capita growth 1273 0.02496 0.0417 -0.1658 0.2854
Life insurance premiums (%GDP) 1286 0.76992 1.6402 0.001 15.784 Log( Initial GDP per capita) 1278 7.6326 1.3157 4.8638 12.556
Log (Population growth) 1237 0.5206 0.7726 -6.1170 2.8544
Index of Human capital 1087 2.2926 0.4877 1.1355 3.2680
Domestic Investment (%GDP) 1357 23.368 7.2737 4.142 57.991
Log (1+Inflation) 1299 2.8481 0.5252 -1.5977 8.332
Log (Government consumption) 1254 3.2229 0.3677 -0.5942 4.0631
Log (Degree of openness) 1334 4.2722 0.4702 2.7035 5.3954
14 4. Results of the estimates and discussions
4.1. Results of the basic model
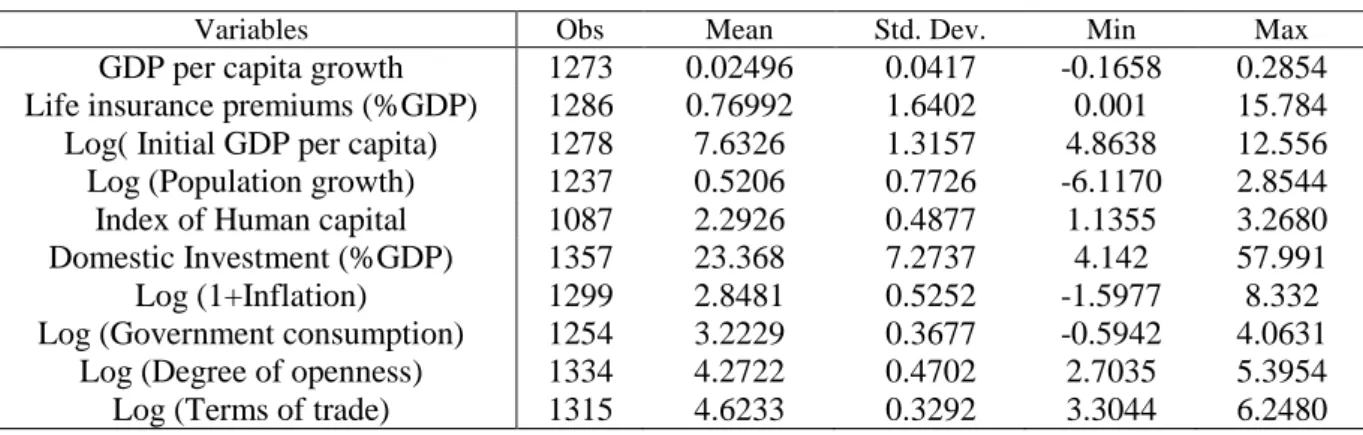
Our results show that the development of life insurance activity is an important determinant of economic growth on the sample of 86 developing countries over the period 1996-20118. The diagnostic tests on the efficient of IV-GMM estimator are presented in table 2 below. The quality of the instruments is validated by the statistics of Fisher and Hansen over-identification test of the first stage estimation results. Thus, the diagnostic test validates the instruments used.
Columns 1 to 4 of the table 2 indicate the results of life insurance penetration effect by controlling the other determinants of economic growth. We note that whatever the specifications, life insurance penetration has a positive and significant effect on real GDP per capita growth. This result suggests that life insurance demand contributes to economic growth in our sample of developing countries. Indeed, in terms of impact, the coefficient is between 0.0011 and 0.0017. Thus, on the basis of results of complete empirical model (column 4), an increase in one standard deviation in life insurance premiums to GDP, ceteris paribus, would imply an increase of 0.2132% in economic growth. This result is consistent with the theoretical of financial development of Patrick (1966) based "supply-leading" which stipulates that the financial development improves the economic growth. Thus, the insurance companies as well as mutual fund investment and pensions constitute one of main institutional investors in the stock, bond and real estate market that induce the economic growth. The results also confirm empirical studies that found that the development of life insurance significantly influences economic growth (Outreville, 1996; Webb et al., 2002; Arena, 2008; Haiss and Sümegi, 2008; 2008; Han et al. 2010; Lee, 2010; Chiu and Lee, 2012; Lee et al., 2013; etc.).
Regarding the control variables, real GDP per capita initial, population growth, inflation, degree of openness and terms of trade have negative effects on economic growth while the human capital and domestic investment positively influence the economic growth. Thus, the negative effect of the population is in conformity with the growth theory of Solow (1956) which stipulates that population growth reduced the quantity of capital per capita and
8
We do not test the stationarity of variables because the time dimension is small (16 years) and according to Hurlin and Mignon (2006) for that the problematic of stationarity presents an interest, the time dimension of the panel must exceed 20 years.
15
therefore the product per capita. Moreover, the positive effect of human capital is in conformity with that found by Barro (1997) and suggests that an increase of investment in human capital is a growth stimulating factor. However, negative effect of Degree of openness and the terms of trade is against intuitive and which may be explained by the fact that the developing countries are more dependents of the imports.
Table 2: Base line: Two-step IV/GMM estimation of life insurance penetration impact on Economic growth
Dependent Variable: GDP per capita growth
VARIABLES (1) (2) (3) (4)
Life insurance premiums (%GDP) 0.00128*** (0.000418) 0.00119*** (0.000410) 0.00173*** (0.000572) 0.00136*** (0.000453) Log (Initial GDP per capita) -0.00669***
(0.00124) -0.00688*** (0.00119) -0.00685*** (0.00131) -0.00657*** (0.00133) Log (Population Growth)9 -0.00731***
(0.00158) -0.00753*** (0.00156) -0.00765*** (0.00163) -0.00707*** (0.00150) Index of Human capital 0.0129***
(0.00338) 0.0131*** (0.00329) 0.0136*** (0.00354) 0.0135*** (0.00351) Domestic Investment (%GDP) 0.00169*** (0.000205) 0.00166*** (0.000200) 0.00179*** (0.000209) 0.00166*** (0.000194) Log (1+ Inflation) -0.00987** (0.00398) -0.00801* (0.00467) -0.00995** (0.00450)
Log (Government consumption) -0.00430
(0.00366)
-0.00459 (0.00346)
Log (Degree of openness) -0.00552**
(0.00253)
Log (Terms of trade) -0.0101**
(0.00469) Constant 0.00751 (0.0113) 0.0373** (0.0152) 0.0417*** (0.0156) 0.106*** (0.0280)
Year FE Yes Yes No Yes
Observations R² Centered Hansen J, p-value First-stage F-statistic (p-value) 795 0.318 0.3748 477.601 0.0000 771 0.332 0.5120 589.089 0.0000 736 0.228 0.3983 666.607 0.0000 702 0.352 0.8281 640.773 0.0000 Note: Life insurance variable is instrumented by percentage of the Muslim papulations and life insurance penetration lagged two period. Robust standard errors are in parentheses. *Significantly different from zero at the 10 percent significance level, ** 5 percent significance level, *** 1 percent significance level.
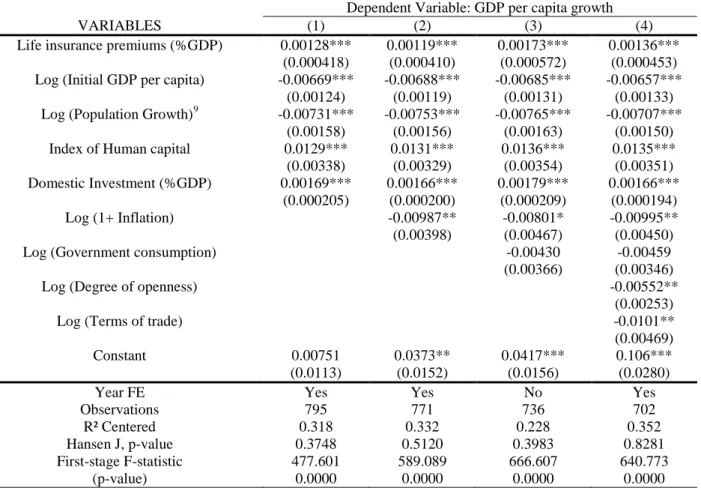
In terms of robustness, we replace life insurance penetration by life insurance density as an alternative measure of indicator of the development of life insurance. The results are reported in table 3 below. As previously, we include the control variables to test the stability of the life insurance density effect on economic growth (columns 1 to 4). Column 4 integrates
9 Referring to Mankiw et al. (1992), Caselli et al. (1996) and Hoeffler (2002), population growth rate has been adjusted for capital depreciation and growth rate of technical progress, the sum of which worth conventionally 0.05.
16
simultaneously all explanatory model as variables previously. We observe that the tests of diagnostic associated to the specification gives the satisfying results. For example, the statistic of Fisher Hansen J overidentification test (which is robust to heteroskedasticity) does not reject the validity of instrumental variables.
Table 3: Robustness: Two-step IV/GMM estimation of life insurance density impact on Economic growth
Dependent Variable: GDP per capita growth
VARIABLES (1) (2) (3) (4)
Log (1+life insurance per capita) 0.00216** (0.00104) 0.00215* (0.00118) 0.00253** (0.00123) 0.00196* (0.00107) Log (initial GDP per capita) -0.00841***
(0.00165) -0.00874*** (0.00172) -0.00890*** (0.00173) -0.00821*** (0.00173) Log (Population Growth) -0.00672***
(0.00157) -0.00734*** (0.00167) -0.00710*** (0.00165) -0.00648*** (0.00149) Index of Human capital 0.0124***
(0.00339) 0.0132*** (0.00355) 0.0136*** (0.00359) 0.0137*** (0.00354) Domestic Investment (%GDP) 0.00165*** (0.000203) 0.00178*** (0.000204) 0.00175*** (0.000207) 0.00161*** (0.000193) Log (1+ Inflation) -0.00873** (0.00437) -0.00796* (0.00467) -0.00980** (0.00452)
Log (Government consumption) -0.00382
(0.00366)
-0.00409 (0.00346)
Log (Degree of Openness) -0.00592**
(0.00249)
Log (Terms of trade) -0.00909*
(0.00479) Constant 0.00778 (0.0131) 0.0417*** (0.0147) 0.0518*** (0.0167) 0.129*** (0.0306)
Year FE Yes No No Yes
Observations R² Centered Hansen J, p-value First-stage F-statistic (p-value) 792 0.318 0.2879 65.906 0.0000 768 0.226 0.2803 68.791 0.0000 733 0.226 0.2592 26.076 0.0000 699 0.351 0.7002 83.277 0.0000 Note: Life insurance variable is instrumented by percentage of the Muslim papulations and life insurance density lagged two period. Robust standard errors are in parentheses. *Significantly different from zero at the 10 percent significance level, ** 5 percent significance level, *** 1 percent significance level
We generally find the same results as above with life insurance penetration. Indeed, in all the equations, life insurance density has a positive and significant effect on growth. Thus, in terms of impact, the logarithm of life insurance density coefficient is between 0.0019 and 0.0025. From column (4), a one standard deviation increase in the logarithm of the life premiums per capita would increase real GDP per capita growth by 0.3374%. Hence, we show that the positive impact of life insurance density on growth is conform to previous studies that have also used the life insurance density, such as those of Avram et al. (2010),
17
Lee (2010), Han et al. (2010), Lee and Chiu (2012), Lee et al. (2013), etc. The control variables also keep their sign as previously which confirms the robustness of our results. Similarly, initial GDP per capita is also significant.
4.2. Testing for heterogeneity in the life insurance-growth nexus
As shown in the previous analysis, the development of life insurance increases real GDP per capita growth. In this sub-section, we examined whether the relationship between the development of life insurance sector and economic growth could be influenced by different structural characteristics of the country. Thus, in addition to variables of the basic model (equation (1)), we include the conditional variables (M) and interaction variables (INS x M) by highlighting the simultaneous effect of life insurance penetration and conditional variables.
4.2.1. Financial development and life insurance effect on growth
Table 4 presents the results of estimation (IV-GMM) in cross-section, by using financial indicators such as conditional variables. These indicators are private credit by deposit money banks to GDP (Private credit), stock market total value traded to GDP (Stocktra) and bank deposit interest rate to measure the financialstructure. The coefficients of the interaction term between life insurance development and financial variables are significant and negative; suggesting that life insurance development is positively related to economic growth, but the positive effect is moderated by the private credit and stock market transaction and deposit interest rate. Indeed, as illustrated in column 1 of Table 4 below, a country in our sample that sees its deposit interest rate increased by 5 to 10%, the marginal impact of its life insurance activity on growth decreases from 0.00737 to 0.0073010. Thus, the mitigating effect of interest rate on the relationship between life insurance and growth is due to the fact that high interest rates encourage economic agents to do banking investment rather than to subscribe to contractual savings (life insurance). Furthermore, private credit (column 2) or stock market transaction (column 3) reduces the positive effect of life insurance penetration on economic growth. In other words, the results suggest that the development of banking sector or stock market restrain the marginal impact of life insurance activity on economic growth until it is neutralized from a certain threshold. For example, regarding the banking system, the threshold of private credit to GDP from which the marginal impact of life insurance on growth
10∂(Yi,t−Yi,t−1)
18
neutralizes is 72%11. For the stock market transaction, the threshold is 79.678%. The substitution effect between life insurance development and other financial segments (banks and stock market) isnot intuitive to the theoretical literature which stipulate a complementary effect between those financial systems. Moreover, this result is not going towards the same sense as Webb et al. (2005) and Arena (2008) who have found a complementarity effect between bank, stock market and life insurance development in a samples of 55 developed and developing countries. However, unlike developed economies where insurance companies play an important role in the financial sectors and their importance as providers of financial services and investment funds in capital markets is very pronounced, there are striking differences in many developing countries where insurance premiums remain low (Lee, Huang, et al 2013; Lee et al., 2013). Thus, the situation of low development of life insurance can explain our findings of substitution effect between life insurance activity and banking credit in developing countries. In addition, our results confirm the study of Chen et al. (2012) who have also found the substitution effect between the development of the stock market and life insurance on the growth process. Then, our results can be also supported by, Haiss and Sümegi (2008) who have indicated that the life insurance sector expansion can weaken the banking sector effect on economic growth by reducing the market share of the banking sector in the mobilization of savings (Allen and Santomero, 2001).
Furthermore, to analyze the direct effect of the three financial segments (insurance, banks and stock market) on economic growth, we have introduced in addition to life insurance premiums, other financial indicators in our basic model (equation 5.1 above). Thus, we are trying to check the previous studies as Webb et al. (2002), Beck and Levine (2004) and Lee (2010) who also have analyzed the effect of the different financial services on economic growth. Results show that the development of life insurance sector and stock market has a positive and significant effect on income per capita growth while bank credit has not significant impact (column 4 and 5). The results are going to the same direction as the results of previous empirical studies (Beck and Levine, 2004 and Arena, 2008) who have also found that life insurance development and stock market have a positive effect on economic growth. However, bank credit to private sector has a not significant effect on economic growth and is not conform to Beck and Levine (2004).
11The marginal effect of life insurance is determined by ∂(Yi,t−Yi,t−1)
∂INSi,t = β + ρ ∗ Mi,t, if β and ρ have opposite
signs, a threshold level arises ∂(Yi,t−Yi,t−1)
∂INSi,t = β + ρ ∗ Mi,t= 0 and we have Mi,t ∗= β
ρ with Mi,t
∗ measures the
19
Table 4:Life insurance and growth, and interaction with financial condition variables
Dependent Variable: GDP per capita growth
VARIABLES (1) (2) (3) (4) (5)
Life insurance premiums (%GDP) 0.00738*** (0.00260) 0.00828*** (0.00296) 0.00396*** (0.00113) 0.00114** (0.000549) 0.000579 (0.000508) Deposit interest rate (%) -0.000610*
(0.000341) Life insurance*Deposit interest
rate
-0.000709** (0.000296)
Private credit by bank (% GDP) 0.000203** (8.89e-05)
5.52e-05 (7.90e-05) Life insurance*Private credit -0.000115***
(4.38e-05) Stock market total value traded
(% GDP)
0.000136*** (4.60e-05)
8.08e-05** (4.03e-05)
Life insurance*Stocktra -4.97e-05***
(1.32e-05) Log (initial GDP per capita) -0.00620***
(0.00149) -0.00745*** (0.00137) -0.00713*** (0.00143) -0.0067*** (0.00133) -0.00660*** (0.00145) Log (Population growth) -0.00704***
(0.00161) -0.00739*** (0.00211) -0.00571*** (0.00149) -0.0074*** (0.00151) -0.00718*** (0.00211) Index of Human capital 0.0115***
(0.00384) 0.0134*** (0.00346) 0.0159*** (0.00419) 0.0126*** (0.00354) 0.0115*** (0.00410) Domestic Investment (%GDP) 0.00168*** (0.000217) 0.00134*** (0.000220) 0.00170*** (0.000170) 0.00145*** (0.000221) 0.00162*** (0.000168) Log (1+ Inflation) 0.00348 (0.00528) -0.00572 (0.00500) -0.0158*** (0.00515) -0.00535 (0.00453) -0.0126*** (0.00443) Log (Government consumption) -0.00352
(0.00415) -0.0118*** (0.00371) -0.0105** (0.00416) -0.0092*** (0.00344) -0.0109*** (0.00405) Log (Degree of openness) -0.00554*
(0.00311) -0.00567** (0.00250) -0.00724** (0.00285) -0.00455* (0.00249) -0.00339 (0.00250) Log (Terms of trade) -0.0143***
(0.00541) -0.00515 (0.00491) -0.00971* (0.00533) -0.00755 (0.00485) -0.00769 (0.00529) Constant 0.103*** (0.0311) 0.103*** (0.0285) 0.160*** (0.0364) 0.117*** (0.0296) 0.118*** (0.0328)
Year FE No Yes Yes Yes Yes
Observations R² Centered Hansen J, p-value First-stage F-statistic (p-value) 622 0.253 0.6064 63.822 0.0000 658 0.360 0.2008 32.214 0.0000 514 0.450 0.2171 35.428 0.0000 680 0.351 0.1594 33.560 0.0000 506 0.431 0.3277 88.021 0.0000 Note: Life insurance variable is instrumented by percentage of the Muslim papulations and life insurance lagged two period.In addition, banking and stock market variables are instrumented by legal origin. Robust standard errors are in parentheses. *Significantly different from zero at the 10 percent significance level, ** 5 percent significance level, *** 1 percent significance level.
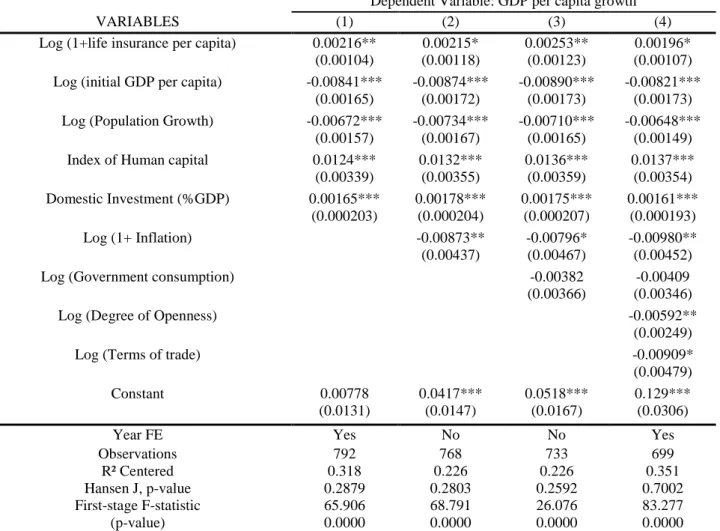
4.2.2. A country’s stage development and the life insurance-growth relationship
To answer to thequestion whether the different stages of economic development influence the relationship between life insurance and growth. Our sample of 86 developing countries
20
include Low and middle income countries (LMY) and Upper middle income countries (UMC). The results of income group12 effect are presented in table 5.
Table 5:Economic development level on life insurance-growth relationship
Dependent Variable: GDP per capita growth
VARIABLES (1) (2)
Life insurance premiums (%GDP) 0.00109** (0.000435)
0.00581* (0.00301) Low & middle income dummy (LMY) -0.0107***
(0.00400) Life insurance premiums*LMY 0.00324
(0.00303)
Upper middle income dummy (UMC) 0.0118***
(0.00402)
Life insurance premiums*UMC -0.00476
(0.00307) Log (initial GDP per capita) -0.00949***
(0.00167)
-0.00931*** (0.00167) Log (Population growth) -0.00714***
(0.00150)
-0.00698*** (0.00149) Index of Human capital 0.0116***
(0.00355) 0.0108*** (0.00355) Domestic Investment (%GDP) 0.00150*** (0.000218) 0.00150*** (0.000217) Log (1+ Inflation) -0.00807* (0.00450) -0.00874* (0.00451) Log (Government consumption) -0.00597*
(0.00337)
-0.00639* (0.00338) Log (Degree of openness) -0.00285
(0.00255)
-0.00315 (0.00256) Log (Terms of trade) -0.00741
(0.00463) -0.00876* (0.00469) Constant 0.119*** (0.0292) 0.134*** (0.0313)
Year FE Yes Yes
Observations R² Centered Hansen J, p-value First-stage F-statistic (p-value) 702 0.356 0.1217 41.614 0.0000 702 0.357 0.5548 42.748 0.0000
Note: Life insurance variable is instrumented by percentage of the Muslim papulations, life insurance lagged two period and interaction between life insurance and dummy of development level lagged two years. Robust standard errors are in parentheses. *Significantly different from zero at the 10 percent significance level, ** 5 percent significance level, *** 1 percent significance level.
The results show that the income group does not influence the marginal effect of life insurance on the economic growth inlow and middle income countries (column 1) and upper- middle income countries (column 2). Thus, our results are in the same direction as those of
12
The analysis is done by interacting a dummy variable, which takes the value of 1 when the country is in the category of income group, with the insurance variables. The sample is not divided into two groups to perform the analysis.
21
Arena (2008) and Chen et al. (2012) who have found the same results for developing countries. However, we note a negative effect of the coefficient of dummy for low and middle income countries on growth (column 1) and a positive effect for upper- middle income countries (column 2). Thus, the negative effect for low and middle income countries can be explained by the lack of the necessary structure and framework to promote economic growth via the financial sector (Avram et al., 2010).
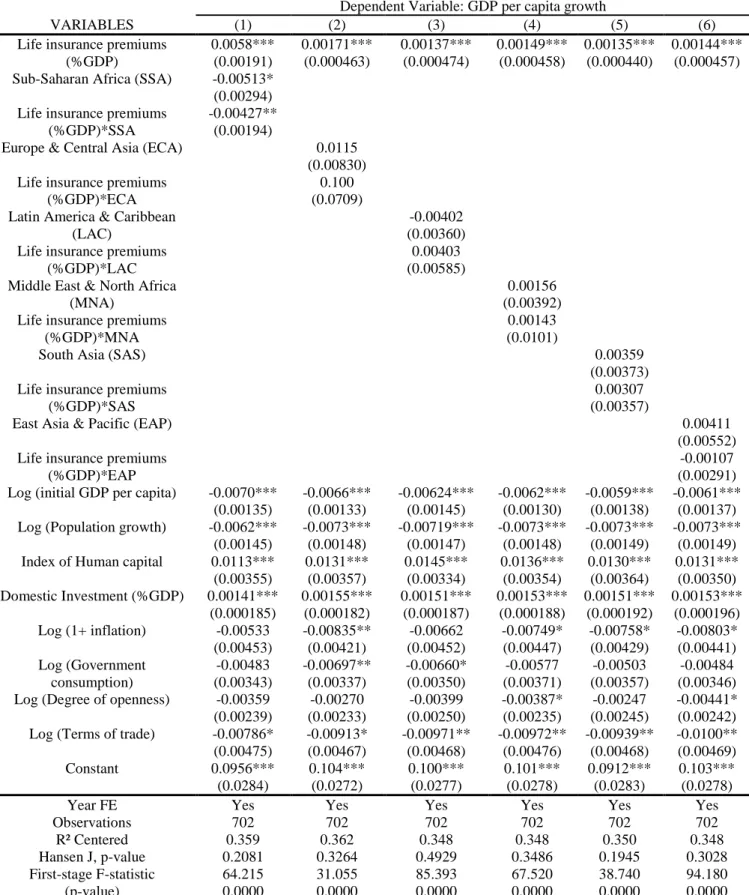
4.2.3. Life insurance development and economic growth: role of regional specificities.
Table 6 reports the results using regional dummies. We observe that the dummy of Sub-Saharan Africa (SSA) region has a negative and significant effect and negatively influences the impact of life insurance on economic growth (column 1). Other regions do not significantly influence the effect of insurance on growth (column 2 to 6). Thus, the marginal effect of life insurance on economic growth is less for SSA countries compared to non-SSA countries. Specifically, a percentage point increase of life insurance premiums to GDP induces a 0.153percentage pointsincrease in real GDP per capita growth for SSA countries13. This compares with a 0.580percentage points increase for a comparable country in non-SSA (either 0.427 percentage points lower for SSA countries). The negative and significant effect of the Sub-Saharan Africa region dummy can be explained by the socio-political situation in the region characterized by the political instabilities that do not favor the growth and play unfavorable on the development of life insurance sector.
22
Table 6:Regional effect and life insurance-growth relationship
Dependent Variable: GDP per capita growth
VARIABLES (1) (2) (3) (4) (5) (6)
Life insurance premiums (%GDP) 0.0058*** (0.00191) 0.00171*** (0.000463) 0.00137*** (0.000474) 0.00149*** (0.000458) 0.00135*** (0.000440) 0.00144*** (0.000457) Sub-Saharan Africa (SSA) -0.00513*
(0.00294) Life insurance premiums
(%GDP)*SSA
-0.00427** (0.00194)
Europe & Central Asia (ECA) 0.0115 (0.00830) Life insurance premiums
(%GDP)*ECA
0.100 (0.0709) Latin America & Caribbean
(LAC)
-0.00402 (0.00360) Life insurance premiums
(%GDP)*LAC
0.00403 (0.00585) Middle East & North Africa
(MNA)
0.00156 (0.00392) Life insurance premiums
(%GDP)*MNA
0.00143 (0.0101)
South Asia (SAS) 0.00359
(0.00373) Life insurance premiums
(%GDP)*SAS
0.00307 (0.00357)
East Asia & Pacific (EAP) 0.00411
(0.00552) Life insurance premiums
(%GDP)*EAP
-0.00107 (0.00291) Log (initial GDP per capita) -0.0070***
(0.00135) -0.0066*** (0.00133) -0.00624*** (0.00145) -0.0062*** (0.00130) -0.0059*** (0.00138) -0.0061*** (0.00137) Log (Population growth) -0.0062***
(0.00145) -0.0073*** (0.00148) -0.00719*** (0.00147) -0.0073*** (0.00148) -0.0073*** (0.00149) -0.0073*** (0.00149) Index of Human capital 0.0113***
(0.00355) 0.0131*** (0.00357) 0.0145*** (0.00334) 0.0136*** (0.00354) 0.0130*** (0.00364) 0.0131*** (0.00350) Domestic Investment (%GDP) 0.00141*** (0.000185) 0.00155*** (0.000182) 0.00151*** (0.000187) 0.00153*** (0.000188) 0.00151*** (0.000192) 0.00153*** (0.000196) Log (1+ inflation) -0.00533 (0.00453) -0.00835** (0.00421) -0.00662 (0.00452) -0.00749* (0.00447) -0.00758* (0.00429) -0.00803* (0.00441) Log (Government consumption) -0.00483 (0.00343) -0.00697** (0.00337) -0.00660* (0.00350) -0.00577 (0.00371) -0.00503 (0.00357) -0.00484 (0.00346) Log (Degree of openness) -0.00359
(0.00239) -0.00270 (0.00233) -0.00399 (0.00250) -0.00387* (0.00235) -0.00247 (0.00245) -0.00441* (0.00242) Log (Terms of trade) -0.00786*
(0.00475) -0.00913* (0.00467) -0.00971** (0.00468) -0.00972** (0.00476) -0.00939** (0.00468) -0.0100** (0.00469) Constant 0.0956*** (0.0284) 0.104*** (0.0272) 0.100*** (0.0277) 0.101*** (0.0278) 0.0912*** (0.0283) 0.103*** (0.0278)
Year FE Yes Yes Yes Yes Yes Yes
Observations R² Centered Hansen J, p-value First-stage F-statistic (p-value) 702 0.359 0.2081 64.215 0.0000 702 0.362 0.3264 31.055 0.0000 702 0.348 0.4929 85.393 0.0000 702 0.348 0.3486 67.520 0.0000 702 0.350 0.1945 38.740 0.0000 702 0.348 0.3028 94.180 0.0000 Note: Life insurance variable is instrumented by percentage of the Muslim papulations, life insurance lagged two period and interaction between life insurance and dummy of region lagged two years. Robust standard errors are in parentheses. *Significantly different from zero at the 10 percent significance level, ** 5 percent significance level, *** 1 percent significance level
23
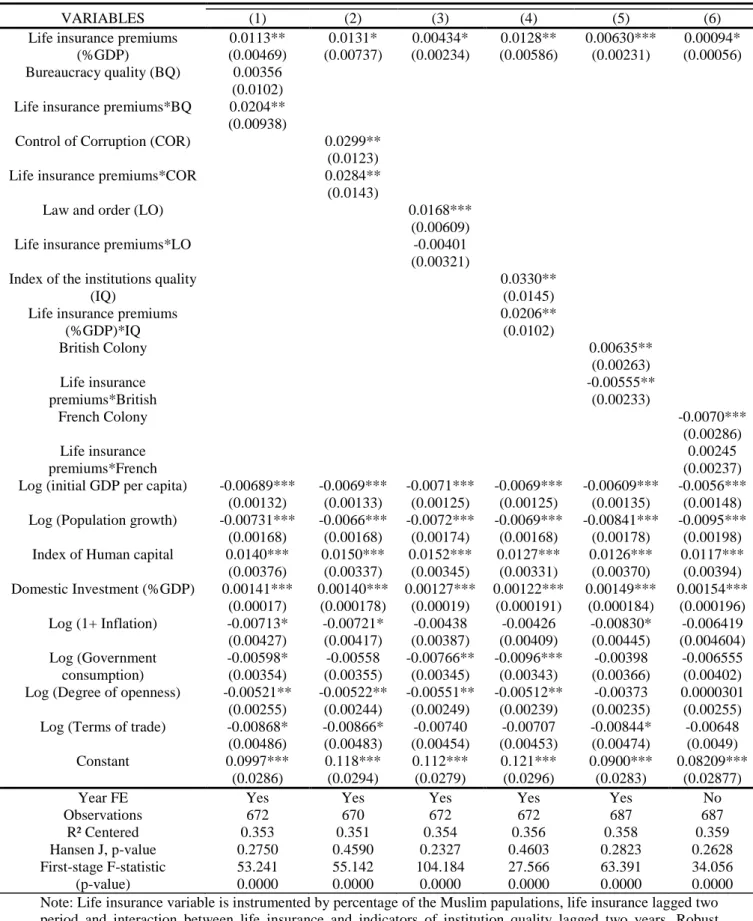
4.2.4. Life insurance and economic growth: role of the institutions quality and legal environment
In this section we discuss the hypothesis on which the responsiveness of economic growth to life insurance development depends, in a linear fashion, upon institutional quality and legal origin. The regression results from the estimation of Equation (2) are reported in Table 7. Each institutional variable is included along with its interaction with life insurance penetration. Diagnostic tests of Fisher and Hansen are favorable to the validity of our instruments. Our results support the prediction that the responsiveness of economic growth to life insurance development depends on the level of institutional quality and legal environment.
The interaction terms of life insurance and the quality of bureaucracy (BQ), control of corruption (COR) and the composite index of the institutions quality (IQ) are positive and significant with coefficients equal to 0.0204, 0.0284 and 0.0206, respectively (column 1, 2 and 4). Thus, the improvement of the institutions quality contributes to improve the marginal positive effect of life insurance premiums on economic growth. Indeed, the positive signs of interactive terms suggest that the positive effect of the development of life insurance on economic growth is more pronounced for countries with high-quality institutions. These results imply an important economically effect of institutions on the responsiveness of economic growth to life insurance development. In terms of impact, ceteris paribus, when the index of the institutions quality increases from 0.25 to 0.75 percentage points (column 4), the marginal impact of life insurance growth increases by 0.0179 to 0.0282. As for quality of the bureaucracy and control of corruption, the responsiveness of economic growth to the life insurance development increases from 0.0102 and 0.0142, respectively (column 1 and 2). Regarding the role of the legal environment, we note that British legal system dummy positively and significantly influences the economic growth while the interaction term with life insurance is negative (column 5). In other words, life insurance development positively influence the economic growth, but its marginal impact is less for British colonial countries. In contrary, French legal system has a negative effect on growth but does not influences the marginal effect of life insurance (column 6). This result can be explained by the fact that life insurance is most developed in English legal system countries while in French legal system, there is an obligatory social security system for public and private sector workers.
24
Table 7:Life insurance and institutions quality and legal environment
VARIABLES (1) (2) (3) (4) (5) (6)
Life insurance premiums (%GDP) 0.0113** (0.00469) 0.0131* (0.00737) 0.00434* (0.00234) 0.0128** (0.00586) 0.00630*** (0.00231) 0.00094* (0.00056) Bureaucracy quality (BQ) 0.00356 (0.0102) Life insurance premiums*BQ 0.0204**
(0.00938)
Control of Corruption (COR) 0.0299** (0.0123) Life insurance premiums*COR 0.0284**
(0.0143)
Law and order (LO) 0.0168***
(0.00609)
Life insurance premiums*LO -0.00401
(0.00321) Index of the institutions quality
(IQ)
0.0330** (0.0145) Life insurance premiums
(%GDP)*IQ 0.0206** (0.0102) British Colony 0.00635** (0.00263) Life insurance premiums*British -0.00555** (0.00233) French Colony -0.0070*** (0.00286) Life insurance premiums*French 0.00245 (0.00237) Log (initial GDP per capita) -0.00689***
(0.00132) -0.0069*** (0.00133) -0.0071*** (0.00125) -0.0069*** (0.00125) -0.00609*** (0.00135) -0.0056*** (0.00148) Log (Population growth) -0.00731***
(0.00168) -0.0066*** (0.00168) -0.0072*** (0.00174) -0.0069*** (0.00168) -0.00841*** (0.00178) -0.0095*** (0.00198) Index of Human capital 0.0140***
(0.00376) 0.0150*** (0.00337) 0.0152*** (0.00345) 0.0127*** (0.00331) 0.0126*** (0.00370) 0.0117*** (0.00394) Domestic Investment (%GDP) 0.00141*** (0.00017) 0.00140*** (0.000178) 0.00127*** (0.00019) 0.00122*** (0.000191) 0.00149*** (0.000184) 0.00154*** (0.000196) Log (1+ Inflation) -0.00713* (0.00427) -0.00721* (0.00417) -0.00438 (0.00387) -0.00426 (0.00409) -0.00830* (0.00445) -0.006419 (0.004604) Log (Government consumption) -0.00598* (0.00354) -0.00558 (0.00355) -0.00766** (0.00345) -0.0096*** (0.00343) -0.00398 (0.00366) -0.006555 (0.00402) Log (Degree of openness) -0.00521**
(0.00255) -0.00522** (0.00244) -0.00551** (0.00249) -0.00512** (0.00239) -0.00373 (0.00235) 0.0000301 (0.00255) Log (Terms of trade) -0.00868*
(0.00486) -0.00866* (0.00483) -0.00740 (0.00454) -0.00707 (0.00453) -0.00844* (0.00474) -0.00648 (0.0049) Constant 0.0997*** (0.0286) 0.118*** (0.0294) 0.112*** (0.0279) 0.121*** (0.0296) 0.0900*** (0.0283) 0.08209*** (0.02877)
Year FE Yes Yes Yes Yes Yes No
Observations R² Centered 672 0.353 670 0.351 672 0.354 672 0.356 687 0.358 687 0.359 Hansen J, p-value First-stage F-statistic (p-value) 0.2750 53.241 0.0000 0.4590 55.142 0.0000 0.2327 104.184 0.0000 0.4603 27.566 0.0000 0.2823 63.391 0.0000 0.2628 34.056 0.0000 Note: Life insurance variable is instrumented by percentage of the Muslim papulations, life insurance lagged two period and interaction between life insurance and indicators of institution quality lagged two years. Robust standard errors are in parentheses. *Significantly different from zero at the 10 percent significance level, ** 5 percent significance level, *** 1 percent significance level.
25 5.Conclusion
This paper has examined the effect of life insurance activity on economic growth and heterogeneity of insurance effect. Using a sample of 86 developing countries over the period 1996-2011 and controlling for endogeneity of life insurance premiums, the econometric results suggest that countries with better-developed life insurance activity have to higher level of economic growth.This result is robust to the addition of other determinants of growth and other specifications with alternative measure of the development of life insurance. However, the results highlight some important heterogeneities on life insurance effect among countries. Thus, the marginal positive impact of life insurance on economic growth decreases with the levels of deposit interest rate, bank credit to private sector and stock market traded. In addition, the marginal positive impact of insurance on economic growth is lower in the countries of the Sub-Saharan African region and in British legal system countries. Finally,the development of life insurance has a greater effect on economic growth in presence of high quality institutions.
This work provides an empirical justification to reinforce the promotion of life insurance market in developing countries. Thus, it will be judicious to continue the reforms aimed at developing the financial sector in particular life insurance sector, which may be a captive source of long term financing alternative of the economy to boost economic growth. This is particularly the case in countries with high-quality institutions.
In this study, we have analyzed the effect of insurance on growth. This does not allow us to analyze life insurance development on the development of banking sector and stock market. However, a growing body of research emphasizes the importance of insurance sector in the development of stock and bond markets (Dickinson, 2000; Catalan et al, 2000 and Impavido et al., 2003.).
Future work could deepen those things by analyzing the effects of the development of insurance on the development of banking and stock market sector; which will identify the effects of the transmission channels of insurance development on economic growth. Future work needs to deepen these findings by analyzing the insurance effect on banking and stock market; that will allow to identify the channels of transmission of the insurance effect on economic growth.
26 References
Adams, M., Anderson, J., Anderson, L.-F & Lindmark, M. (2009). Commercial banking, insurance and economic growth in Sweden between 1830 and 1998.
Accounting, Business and Financial History 19, 21–38
Allen, F. & Santomero, A. (2001). What do financial intermediaries do? Journal of Banking
and Finance, 25, 271–294.
Arena M. (2008). Does Insurance Market Activity Promote Economic Growth? A Cross-Country Study for Industrialized and developing Countries. Journal of Risk and Insurance 75(4): 921–946.
Arestis P, Demetriades, P. O & Luintel, B. (2001). Financial development and economic growth: the role of stock markets. Journal of Money, Credit, and Banking 33(1): 16–41 Avram, K., Nguyen, Y. & Skully, M. (2010). Insurance and economic growth: A cross
country examination. Working Paper, Monash University.
Barro, R. J. (1997). Determinants of Economic Growth: A Cross-Country Empirical Study.
Cambridge MA, MIT Press.
Baum, C.F., Schaffer, M. E. & Stillman, S. (2007). Enhanced routines for instrumental variables/GMM estimation and testing. Unpublished working paper.
Beck T. & Webb I. (2003). Economic, demographic, and institutional determinants of life insurance consumption across countries. The World Bank Economic Review 17: 51–88. Beck, T. & Levine, R. (2004). Stock Markets, Banks, and Growth: Correlation or
Causality. Journal of Banking and Finance, 28: 423-442.
Browne, M. J. & Kim, K. (1993). An international analysis of life insurance demand. Journal
of Risk and Insurance, 60(4), 671–688.
Caselli, F., Gerardo, E. & Lefort, F. (1996). Reopening the Convergence Debate: A New Look at the Cross-County Growth Empirics. Journal of Economic Growth 1 (3): 363–89. Catalan, M., Impavido, G. & Musalem, A. R. (2000). Contractual savings or stock market
development - which leads? Unpublished Policy Research Working Paper No. 2421. The World Bank
27
Chang C-H. & Lee C-C. (2012). Non-Linearity between Life Insurance and Economic Development: A Revisited Approach. The Geneva Risk and Insurance Review, 2012, 37, (223–257).
Chang, C.-H. & Lee, C.-C. (2012). Non-linearity between life insurance and economic development: A revisited approach. The Geneva Risk and Insurance Review, 37(2), 223– 257.
Chen P-F. & Lee C-C., Lee C-F. (2012). How does the development of the life insurance market affect economic growth? Some international evidence. Journal of International
Development No.24, 865-893.
Čihák, M., Demirgüç-Kunt, A., Feyen, E. & Levine, R. (2012). Benchmarking Financial Systems Around the World. World Bank Policy Research Working Paper 6175, World Bank, Washington, D.C
Dickinson, G. (2000). Encouraging a dynamic life insurance industry: Economic benefits and policy issues. Center for insurance & investment studies, London.
Enz, R. (2000). The S-curve Relation between Per-Capita Income and Insurance Penetration.
Geneva Papers on Risk and Insurance, Vol. 25 (3), (2000) 396-406
Feenstra, R., C., Inklaar, R. & Timmer, M. P. (2013). The Next Generation of the Penn World Table.
Feyen, E., Lester, R. & Rocha, R. (2011). What Drives the Development of the Insurance Sector? An Empirical Analysis Based on a Panel of Developed and Developing Countries. World Bank Working Paper 5572.
Haiss, P. & Sümegi, K. (2008). The relationship of insurance and economic growth: review and agenda. The IcFai Journal of Risk and Insurance l (2): 32–56.
Han, L., Li, D., Moshirian, F. & Tian, L. (2010). Insurance development and economic growth. Geneva Papers on Risk and Insurance-Issues and Practice 35: 183–199.
Hoeffler, A. E. (2002). The Augmented Solow Model and the African Growth Debate. Oxford
Bulletin of Economics and Statistics 64(2): 135–58.
Hou H., Cheng, S-Y & Yu C-P. (2010). Life Insurance and Euro Zone’s Economic Growth.
28
Hurlin, C. & Mignon, V. (2006). Une Synthèse des Tests de Racine Unitaire sur Données de Panel. Economie et Prévision, Minefi- Direction de la prévision, 169, pp. 253-294.
Impavido, G., Musalem, A. R. & Tressel, T., (2003). The Impact of Contractual Saving Institutions on Securities Markets. World Bank Policy Research Working paper 2498. Keke J-C. S. & Houedokou W. P. (2013). Insurance Contribution to Economic Growth in
Countries of the West African Economic Monetary Union (WAEMU): A Dynamic Panel Data Approach. Global Advanced Research Journal of Economics, Accounting and
Finance vol. 2(5) pp. 104-114.
Kugler M. & Ofoghi R (2005). Does insurance promote economic growth? Evidence from the UK, Working paper, University of Southampton.
La Porta, R., Lopez-de-Silanes, F., Shleifer, A. & Vishny, R. W. (1998). Law and finance.
Journal of Political Economy, 106 (6), 1113–1155.
Lee C-C. (2010). Does insurance matter for growth: Empirical evidence from OECD countries. The B.E. Journal of Macroeconomics.
Lee C-C., Lee C-C. & Chiu Y-B (2013). The link between life insurance activities and economic growth: Some new evidence. Journal of International Money and Finance No.32, 405-427.
Lee, C. C., Huang, W. L. & Yin, C. H. (2013). The dynamic interactions among the stock, bond and insurance markets. North American Journal of Economics and Finance, 26, 28– 52.
Lee, C. C., Lee, C. C. & Chiu, Y. B. (2013). The link between life insurance activities and economic growth: Some new evidence. Journal of International Money and Finance, 32, 405–427.
Lee, C.-C. & Chiu, Y.-B., (2012). The impact of per-capita income on insurance penetration: applications of the panel smooth threshold model. International Review of Economics and
Finance 21, 246–260.
Levin, A., Lin, C.-F. & Chu, C.-S. J. (2002). Unit root tests in panel data: asymptotic and finite-sample properties. Journal of Econometrics, 108(1), 1-24.
Levine R, Zervos S. (1998). Stock markets, banks, and economic growth. American