HAL Id: hal-01688609
https://hal.sorbonne-universite.fr/hal-01688609
Submitted on 19 Jan 2018HAL is a multi-disciplinary open access archive for the deposit and dissemination of sci-entific research documents, whether they are pub-lished or not. The documents may come from teaching and research institutions in France or abroad, or from public or private research centers.
L’archive ouverte pluridisciplinaire HAL, est destinée au dépôt et à la diffusion de documents scientifiques de niveau recherche, publiés ou non, émanant des établissements d’enseignement et de recherche français ou étrangers, des laboratoires publics ou privés.
Expanded neurochemical profile in the early stage of
Huntington disease using proton magnetic resonance
spectroscopy
Isaac Mawusi Adanyeguh, Marie-Lorraine Monin, Daisy Rinaldi, Leorah
Freeman, Alexandra Durr, Stéphane Lehéricy, Pierre-Gilles Henry, Fanny
Mochel
To cite this version:
Isaac Mawusi Adanyeguh, Marie-Lorraine Monin, Daisy Rinaldi, Leorah Freeman, Alexandra Durr, et al.. Expanded neurochemical profile in the early stage of Huntington disease using proton magnetic resonance spectroscopy. NMR in Biomedicine, Wiley, In press, �10.1002/nbm.3880�. �hal-01688609�
Expanded neurochemical profile in the early stage of Huntington disease using
proton magnetic resonance spectroscopy
Isaac M. Adanyeguh1, Marie-Lorraine Monin1,2, Daisy Rinaldi1, Léorah Freeman3,
Alexandra Durr1,2, Stéphane Lehéricy1,4, Pierre-Gilles Henry5 *, Fanny Mochel1,2,6 *
1
Inserm U 1127, CNRS UMR 7225, Sorbonne Universités, UPMC Univ Paris 06
UMR S 1127, Institut du Cerveau et de la Moelle épinière, ICM, F-75013, Paris,
France
2
AP-HP, Pitié-Salpêtrière University Hospital, Department of Genetics, Paris, France
3
Department of Neurology, McGovern Medical School at UTHealth, Houston, TX,
Unites States
4
Center for NeuroImaging Research (CENIR), Institut du Cerveau et de la Moelle
épinière, Paris, France
5
Center for Magnetic Resonance Research (CMRR), University of Minnesota,
Minneapolis, MN, United States
6
University Pierre and Marie Curie, Neurometabolic Research Group, Paris, France
* These authors contributed equally to this work.
Correspondence to: Dr Fanny Mochel, Institut du Cerveau et de la Moelle épinière,
Aile 4A, Hôpital Pitié-Salpétrière, 75013 Paris, France; Tel: +33 (0) 1 57 27 46 82;
Fax: +33 (0) 1 57 27 47 95; email: fanny.mochel@upmc.fr
Grant support: This study was funded by NIH grants (P41EB015894 and
P30NS076408) and the Ecole des Neurosciences de Paris. The study also received funding from Ipsen (NCT01696708) and the program “Investissements d’avenir” ANR-10-IAIHU-06 and ANR-11-INBS-0006.
Keywords: Huntington disease, movement disorders, 1H MRS, semi-LASER,
neurometabolite, neurochemical profile.
List of abbreviations:
AFP: Adiabatic full passage
HD: Huntington disease
CAG: Cytosine-adenine-guanine trinucleotide
UHDRS: Unified Huntington Disease Rating Scale
GM: Gray matter
WM: White matter
CSF: Cerebrospinal fluid
OVS: Outer volume suppression
VAPOR: Variable power and optimized relaxation delays
VOI: Volume of interest
ABSTRACT
Purpose: The striatum is a well-known region affected in Huntington disease (HD).
However, other regions including the visual cortex are implicated. We previously
identified an abnormal energy response in the visual cortex of patients at an early
stage of HD using 31P magnetic resonance spectroscopy (MRS). We therefore sought
to further characterize these metabolic alterations with 1H MRS using a well-validated
semi-LASER sequence that allows measuring an expanded number of
neurometabolites.
Materials and methods: Ten early affected patients (UHDRS, total motor score =
13.6 ± 10.8) and ten healthy volunteers of similar age and BMI were recruited for the
study. We performed 1H MRS in the striatum – the region that is primary affected in
HD – and the visual cortex.
Results: The protocol allowed a reliable quantification of 10 metabolites in the visual
cortex and 8 in the striatum, compared to 3-5 metabolites in prior 1H MRS studies
performed in HD. We identified higher total creatine (p < 0.05) in the visual cortex
and lower glutamate (p < 0.001) and total creatine (p < 0.05) in the striatum of HD
patients compared to controls. Less abundant neurometabolites (glutamine, GABA,
glutathione, aspartate) showed similar concentrations in both groups.
Conclusion: The protocol allowed measurement of several additional metabolites
compared to standard vendor protocol. Our study pointed to early changes in
metabolites involved in energy metabolism in the visual cortex and striatum of HD
patients. Decreased striatal glutamate could reflect early neuronal dysfunction or
INTRODUCTION
Huntington disease (HD) is a polyglutamine disorder caused by expansion in the
glutamine-encoding cysteine-adenine-guanine (CAG) repeats1 and striatal atrophy is a
prominent characteristic of the disease.2 Other brain regions including the thalamus,
cerebral cortex, cerebellum3,4 and visual cortex5 are also involved in the pathological
process as the disease progresses. Positron emission tomography studies have shown
metabolic alterations in the striatum6 whilst 31P MRS studies have revealed abnormal
energy response in the visual cortex of HD patients at an early stage of the disease.7,8
With the availability of genetic testing for HD, there exists a therapeutic window that
can be taken advantage of before symptoms onset. However, biomarkers are critically
needed to evaluate presymptomatic individuals and make use of this therapeutic
window5 since the Unified Huntington Disease Rating Scale (UHDRS),10 the most
commonly used measure to assess disease severity, is unable to evaluate pathological
processes prior to motor symptoms onset. In the search for biomarkers, 1H MRS has
been used to study neurometabolism in HD at different field strengths.11-15 Metabolic
alterations start indeed in the very early stages of the disease,16 and represent
important targets for neuroprotective therapies.8
Previous studies with 1H MRS in HD were carried out at field strengths between 0.5 T
and 7 T (Table 1), with several studies performed on 3 T systems that are becoming
common in hospitals.12,13,15,17 In general, these studies have focused on the most
prominent metabolites in the 1H spectrum – total NAA (tNAA), total creatine (tCr),
total choline (tCho), and to a lesser extent myo-inositol (myo-Ins) and glutamate (Glu) – but not on less obvious metabolites such as gamma amino-butyric acid (GABA), glutamine (Gln), or glutathione (GSH). Some studies reported metabolite ratios only,
focused mainly on the striatum, caudate or putamen, and only a few on the occipital
cortex (Table 1) even though abnormal metabolic alterations are also present in this
region.6-8 Furthermore, these studies used STEAM and PRESS sequences with long or
short TE without prior test of robustness or reproducibility. The present study thus
sought to measure an expanded neurochemical profile in both the visual cortex and
the striatum of early affected HD patients at 3 T, using a previously optimised and
validated semi-LASER sequence with water as an internal concentration reference
and correction of concentrations for CSF content.
MATERIAL AND METHODS
The study was designed to test whether we can reliably report on an expanded range
of neurochemicals in HD using a validated sequence with minimal J-modulation,
small chemical-shift displacement error, higher SNR and excellent outer volume
suppression performance compared to common vendor-provided sequences.
Subjects
The local ethics committee approved this study and all subjects signed a written
informed consent after the nature of the procedure had been fully explained before
participating in the study. Motor dysfunction was evaluated with the total motor score
(TMS) of the Unified Huntington Disease Rating Scale (UHDRS) with a maximal
worth score of 124. We recruited ten patients at the early stage of HD without
medication as well as ten healthy volunteers with similar general characteristics – sex,
MR Protocol
MRS data were acquired on 3 T whole-body Siemens Magnetom Trio scanner
(Siemens Medical Solutions, Erlangen, Germany). We used a modified semi-LASER
1
H MRS protocol18 that has been previously tested in healthy controls for robustness
and reproducibility in a bi-centric study and demonstrated highly reproducible data.19
Using a 32-channel receive head coil, 3D T1-weighted volumetric images (TR = 2530
ms, TE = 3.65 ms, 1 mm isotropic, FOV = 256 x 240 mm2, matrix size = 256 x 240)
were acquired for spatial normalization and localization of brain volumes and for
volumetric analysis of brain regions of interest. Shimming and spectra acquisition
were performed on a 25 x 25 x 25 mm3 volume-of-interest (VOI) in the visual cortex
and a 34 x 19 x 23 mm3 VOI in the striatum (Figure 1). Automatic B0 shimming in the
voxels was performed with FAST(EST)MAP20 resulting in highly resolved spectral
lines. The calibration and acquisition steps were performed as described in prior
studies.18,19,21 The RF power for the asymmetric slice-selective 90o pulse (duration = 2
ms) of the semi-LASER sequence (TR = 5000 ms, TE = 28 ms, averages = 64, vector
size = 2048, acquisition time = 6 min) was calibrated by determining the power that
produced the maximum signal. The power for the 180o hyperbolic secant adiabatic
full passage (AFP) pulses (duration = 4 ms) was set automatically based on the 90o
pulse. For better suppression of unwanted coherences with shorter spoiler gradients,
AFP pulses were interleaved. Water suppression pulses with the variable pulse power
and optimized relaxation delays (VAPOR) were adjusted by following signal
intensities to determine the power with maximum water suppression. The VAPOR
pulses were interleaved with outer volume suppression (OVS) pulses to reduce
contamination from other brain regions outside the VOI in the visual cortex
anterior = 80 mm, posterior = 80 mm). A 7 mm margin was left between the VOI and
the OVS slices in order to avoid signal loss in the VOI due to the transition band of
the OVS pulse profile. Two preparation scans were performed at the beginning of
each spectral acquisition to achieve steady-state magnetization. Additionally,
unsuppressed water spectra were acquired in each subject for eddy current correction
(VAPOR on with RF off, OVS on) and another one (VAPOR and OVS off to avoid
loss of water signal due to magnetization transfer effects) to use as an internal water
concentration reference for metabolite quantification.19,21 The total scan time for each
VOI including shimming, calibration and spectra acquisition was approximately 10
minutes. To evaluate the cerebrospinal fluid (CSF) contribution to VOI, we
segmented the brain and estimated the %CSF content in the VOI based on T1 images
as explained below. Metabolite concentrations were then corrected for regional CSF
content assuming zero metabolite content in the CSF.
Metabolite quantification
Data pre-processing consisted of eddy current correction and shot-to-shot phase and
frequency correction in MATLAB as previously described.19,21 Summed spectra were
quantified with LCModel.22 The basis set was simulated using density matrix
calculation in MATLAB and included: alanine, ascorbate, aspartate, creatine,
γ-aminobutyric acid (GABA), glycerophosphorylcholine (GPC), phosphocholine
(PCho), phosphocreatine (PCr), glucose (Glc), glutamine (Gln), glutamate (Glu),
glutathione (GSH), myo-inositol (myo-Ins), scyllo-inositol (sIns), lactate,
N-acetylaspartate (NAA), N-acetylaspartylglutamate (NAAG), phosphorylethanolamine
(PE) and taurine. The basis set also included macromolecule spectra that were
VOI as an internal concentration reference, we limited errors that otherwise could
arise from the use of an external reference such as those related to B1 homogeneities
and coil loading. Metabolite concentrations were corrected for CSF content and
GM/WM partial volume fraction assuming 100% water content in CSF, 78% water
content in GM and 65% water content in WM as recommended in the LCModel
manual. Even though atrophy is observed in HD, tissue water content seems to remain
unchanged in HD.23 We thus assumed identical tissue water content in GM and WM
in controls and patients. In principle, increased CSF fraction should not bias the
quantification, since metabolite concentrations are corrected for CSF content.
However, T2 relaxation of water during the semi-LASER protocol could introduce
some bias. While we used a short TE of 28 ms, there is non-negligible relaxation of
water especially in tissue, since T2 of water in tissue (GM and WM) is much shorter
than T2 of water in CSF. If CSF content differs significantly among subjects, a small
bias is introduced to the quantification (the more CSF, the less the water reference
signal relaxes during TE). We thus corrected the water reference signal intensity for
T2 relaxation during TE using T2 of water in CSF of 740 ms, and T2 of water in tissue
(GM and WM) to be 100 ms24 using the formula:
Where fCSF, fGM and fWM are fractions of CSF, GM and WM in the voxel and T2,CSF,
T2,GM and T2,WM are T2 relaxation times of CSF, GM, and WM.
While the reported T2 of water in brain tissue are approximately 80 ms, we increased
these values by 25% to account for longer T2 during the Carr-Purcell-Meiboom-Gill
T2(metab,tissue) = 200 ms for all metabolites. While some metabolites have a longer
T2 (e.g. tNAA), the small bias introduced by using the same T2 would be the same in
the control and patient group and would not affect comparisons between the two
groups.
Metabolites were considered reliably quantified when Cramér-Rao lower bounds
(CRLB) ≤ 20% were observed in at least half the subject population as this threshold
allows the selection of the most reliably quantified metabolites as recommended in the
LCModel manual. However, in order to avoid quantification bias, we reported the
average of all concentration values for each reliably quantified metabolite, including
those with CRLB < 999%. For metabolites exhibiting high cross-correlation
(correlation coefficient < -0.7) – e.g. Cr and PCr; and NAA and NAAG – only the
sum was reported (e.g. tCr for Cr and PCr; tNAA for NAA and NAAG). All spectra
had metabolite linewidth < 10 Hz, as estimated by LCModel (average ~5 Hz in visual
cortex and ~7-8 Hz in striatum). Pre-processing and quantification steps took
approximately 3 minutes per spectrum to complete.
Brain tissue volume estimation
To obtain reliable volume estimates, 3D T1 images were automatically segmented
using Freesurfer v5.3 (https://surfer.nmr.mgh.harvard.edu/). The gray matter
(GM)/white matter (WM) interface as well as the GM volume segmentations were
examined and reprocessed if corrections were needed. For each subject, VOIs were
registered to their respective 3D T1 image and the volume fractions of the GM, WM
and cerebrospinal fluid (CSF) within each VOI were extracted and quantified using
Statistical analysis
We applied a student t-test to compare neurometabolite concentrations between
patients and controls. Pearson correlations were performed between neurometabolite
concentrations and TMS, CAG repeat length and brain volume fractions in the VOI
with Holm-Bonferroni multiple comparison correction. Probability values of p < 0.05
were considered significant.
RESULTS
Reduced GM volume fractions and increased CSF fractions were observed in both
striatum and visual cortex in HD patients compared to controls (Figure 2). Each subject’s volume fractions were used to correct for partial volume effects in determining metabolite concentrations. Correction for CSF content and for T2
relaxation greatly reduced the SD of metabolite concentrations and minimized sources
of bias.
None of the datasets were excluded on the basis of spectral linewidth. We could not
acquire one dataset from the striatum of a patient due to scanning time constraints.
Hence nine datasets are reported in striatum in patients. None of the metabolites
reported in Figure 3 had CRLB = 999 for any subject. In the visual cortex, HD
patients displayed a 7% increase in tCr relative to controls (p < 0.05) (Figure 3A). All
other neurometabolites (Asp, Gln, Glu, GSH, myo-Ins, sIns, Tau, tCho and tNAA)
had similar concentrations in both groups.
In the striatum, HD patients showed a large 20% decrease in Glu concentration (p <
to controls (Figure 3B). Total NAA showed a 4% trend to decrease in striatum (p =
0.08).
In order to examine less concentrated neurometabolites (aspartate, ascorbic acid,
scyllo-inositol, lactate and taurine), the CRLB threshold was increased to 50%. These
additional metabolites with the exception of aspartate in the striatum did not show any
significant differences between patients and controls, although glutamine showed a
trend to decrease in striatum similar to glutamate (-15%, p = 0.12) (Supplementary
Figure).
In the visual cortex of patients, tCr correlated positively with CSF fraction (p <
0.001), and negatively with GM (p < 0.05) and WM (p < 0.001) volume fractions
(Figure 4A) but not with TMS, CAG repeat length or age. In the striatum of patients,
Glu correlated negatively with CSF fraction (p < 0.05) and positively with WM
volume fraction (p < 0.05) (Figure 4B) but not with TMS, CAG repeat length or age.
DISCUSSION
We showed increased tCr in the visual cortex and decreased Glu and tCr in the
striatum at an early stage of HD, but no significant changes in less prominent
metabolites such as GABA, Gln or GSH. While the striatum is at the center of
structural and metabolic changes in HD, we confirmed that the visual cortex is also
involved in the early stage of the disease at both structural and metabolic levels. The
extended analysis of 10 neurometabolites in the visual cortex and 8 in the striatum
was possible due to a previously validated semi-LASER sequence providing high
number of metabolites reported for the striatum compared to visual cortex is due in
part to broader linewidth (metabolite linewidth ~7-8 Hz in striatum compared to ~5
Hz in visual cortex). In contrast, GABA was quantified with CRLB < 20% in striatum
but not in visual cortex due to its two-fold higher concentration in striatum.
Metabolites of low concentration such as Asp, GSH, sIns and Tau are often very
difficult to quantify at 3 T due to their small resonance peaks. Hence, changes in the
baseline could influence their quantification even when highly resolved metabolite
peaks with excellent spectral quality are achieved.
Most clinical protocols use PRESS and STEAM sequences, which are vendor
provided sequences. In the previous studies compiled in Table 1, long TE
protocols25,26 allowed only a limited number of metabolites to be reported since
J-coupled and shorter T2 metabolites could not be measured. Other studies used short TE
STEAM12,15,27 and PRESS14,28,29 protocols to report “absolute” (i.e. water-referenced)
concentrations or ratios of metabolites. However, STEAM produces spectra with
~two-fold lower SNR and PRESS suffers from high chemical shift displacement
error.30 In semi-LASER, the two pairs of 180o AFP pulses minimize J-modulation and
allow measurement of J-coupled as well as singlet metabolites with optimal
sensitivity.19
Cr and PCr whose summed resonance peak is referred to as total creatine (tCr), serve
as an energetic marker and maintains brain energy homeostasis.31 The importance of
tCr may stem from the limited glucose storage capability by the brain.32 Increased tCr
has been reported in the brain of HD mouse models33 and this increase preceded the
depletion of ATP.34 Patients with spinocerebellar ataxia type 1, 2 and 3, another group
of polyglutamine disorders that share common pathophysiological pathways with
relative concentrations of components of energy metabolism – ATP, PCr and
inorganic phosphate (Pi) – were previously measured using 31P MRS in the visual
cortex of HD patients before, during and after visual stimulation.7,8 Healthy controls
exhibited a normal profile, with increased Pi/PCr ratio during visual stimulation,
followed by a return to baseline levels during recovery. In contrast, HD patients
displayed no significant change in Pi/PCr ratio in two independent studies.7,8 The
higher tCr in the visual cortex reported here is in agreement with these studies.
Altogether, these studies underlie that creatine metabolism is modified in the visual
cortex of HD patients, a region that is particularly enriched in mitochondria,7,8 at an
early stage of the disease and may signify a compensatory mechanism. In the striatum
however, we observed a decrease in tCr concentration which is in line with some
previous studies.12,14,15,36 This decrease might point to a failure to initiate energetic
compensatory mechanisms as we have observed in the visual cortex. It should be
noted that the p values reported for tCr and Glu were not corrected for multiple
comparisons within groups. It is therefore possible that our observations on tCr, with
p-values close to statistical significance, might more likely be a trend to increase. Our
interpretation of tCr changes must therefore be taken with caution also considering the
small sample size.
The significant decrease in the neuronal marker Glu in the striatum is in agreement
with previous reports from the putamen.14,15 Decreased Glu could be due in part to the
lower GM content in the striatal VOI. However, assuming that Glu was two-fold
higher in GM than in WM,37 we calculated that the measured decrease in GM content
would have resulted in a less than 5% decrease in Glu concentration in the VOI, and
therefore did not explain the 20% decrease observed in our study. Since it has been
decreased Glu concentrations could reflect neuronal dysfunction as a result of
atrophy. Furthermore, Glu levels have been linked to metabolic activity.31 Twenty
percent of brain glucose metabolism is directed to Glu synthesis through the Gln-Glu
cycle.38 As HD patients display glucose hypometabolism in the striatum and cortex,39
decreased Glu levels could reflect decreased metabolic activity in HD patients.
Consistent with several other studies reported in Table 1 which reported changes in
tNAA, we observed a trend in decrease in tNAA in striatum (from 9.0 ± 0.4 to 8.6 ±
0.5 mmol/g), although it did not reach statistical significance (p = 0.08). This could be
due to the fact that our cohort was at a very early stage of the disease or that we had a
relatively small sample size. Some previous studies reported no change in tNAA but a
decrease in NAA.12,14,15,36 In fact, in our study, NAA was significantly decreased in
the striatum (from 8.6 ± 0.3 to 7.8 ± 0.5 mM, p < 0.001), but this decrease was partly
compensated by an increase in NAAG (from 0.4 ± 0.3 to 0.8 ± 0.4 mM, p < 0.02).
However, individual NAA and NAAG concentrations are generally considered
unreliable at 3 Tesla due to their high cross-correlation, and we consider that only the
sum tNAA can be quantified reliably.
GABA is another important metabolite in HD since the medium-sized spiny neurons
that contain GABA undergo selective degeneration in the striatum.40 Although
spectral editing is often performed to quantify GABA by MRS, GABA can also be
quantified from high-quality short-TE 1H spectra such as obtained with LASER or
semi-LASER, especially in brain regions that have higher GABA concentration.41
Here GABA was quantified with good precision in striatum due to its higher
concentration (~2.2 - 2.4 mol/g), but not in visual cortex (~1 mol/g). One previous study reported GABA in striatum in HD at 7 Tesla and also reported no change.42
Reports of changes in myo-Ins and tCho in striatum in early HD are mixed. Some
studies showed increased myo-Ins and/or tCho, but some did not (see Table 1). Our
study showed no evidence of changes in tCho or myo-Ins in striatum, in agreement
with the only reported measurements in striatum in HD at 7 Tesla,15 a higher magnetic
field expected to provide improved accuracy. Our study is also consistent with the
main findings of that study15, namely lower Glu, lower tCr and lower tNAA (or in our
case trend to lower tNAA) in striatum. The main evidence for increased myo-Ins in
striatum in early HD is from Sturrock et al.14 However, in that study, spectra from
early HD patients appear much broader than spectra from controls and pre-HD
patients, and the degraded spectral quality could conceivably affect myo-Ins and tCho
concentrations determined by LCModel. Some earlier studies reported increased tCho
based on increased tCho/tCr ratio; however, more recent studies using water as a
concentration reference suggest that the increased ratio actually results from
decreased tCr rather than increased tCho.
In conclusion, this study used an optimized semi-LASER protocol to help understand
the early neurometabolic alterations that occur in HD. We reported absolute
metabolite concentrations and not ratios,11,25,29,36,43 in order to be able to analyse the
impact of each individual metabolite. Unlike all the aforementioned studies
summarized in Table 1, our semi-LASER protocol allowed to obtain an expanded
neurochemical profile of up to 10 metabolites, which is promising to find robust
Acknowledgements
The authors wish to thank warmly the patients and volunteers who participated in this
study. The authors are also grateful to collaborators from the Center for
Neuroimaging Research, France, and the Center for Magnetic Resonance Research,
USA.
DISCLOSURE/CONFLICT OF INTEREST
No disclosure: Adanyeguh, Monin, Rinaldi.
Freeman: Research support by grants from the National Multiple Sclerosis Society.
Durr: Research support by grants from the French Agency for Research, Fondation
pour la recherche médicale (FRM), and Pfizer Inc.
Lehericy: Received grants from Agence Nationale de la Recherche (ANRMNP 2009,
Nucleipark), DHOS-Inserm (2010, Nucleipark), France Parkinson (2008), Ecole Neuroscience de Paris, ‘Investissements d’avenir’ [grant number ANR-10-IAIHU-06 and ANR-11-INBS-0006] during the conduct of the study. Outside of this study, he
received commercial research support from Servier and Pfizer, funding for travel from
Siemens and General Electric and honoraria from Pileje, Lundbeck and Roche.
Henry: Research support by grants from NIH (P41 EB015894, P30 NS076408),
Friedreich's Ataxia Research Alliance and CureFA foundation.
Mochel: Research support by grants from INSERM, Carnot Institutes, ASL
REFERENCES
1. Kremer B, Goldberg P, Andrew SE, et al. A worldwide study of the Huntington's
disease mutation. The sensitivity and specificity of measuring CAG repeats. N Engl J
Med 1994;330(20):1401-1406.
2. Tabrizi SJ, Scahill RI, Owen G, et al. Predictors of phenotypic progression and
disease onset in premanifest and early-stage Huntington's disease in the TRACK-HD
study: analysis of 36-month observational data. Lancet Neurol 2013;12:637-649.
3. Rosas HD, Koroshetz WJ, Chen YI, et al. Evidence for more widespread cerebral
pathology in early HD: an MRI-based morphometric analysis. Neurology
2003;60:1615-1620.
4. Waldvogel HJ, Kim EH, Tippett LJ, Vonsattel JP, Faull RL. The Neuropathology
of Huntington's Disease. Curr Top Behav Neurosci 2015;22:33-80.
5. Rub U, Seidel K, Vonsattel JP, et al. Huntington's Disease (HD):
Neurodegeneration of Brodmann's Primary Visual Area 17 (BA17). Brain Pathol
2015;25(6):701-711.
6. Feigin A, Leenders KL, Moeller JR, et al. Metabolic network abnormalities in early
Huntington's disease: an [(18)F]FDG PET study. J Nucl Med 2001;42(11):1591-1595.
7. Mochel F, N'Guyen TM, Deelchand D, et al. Abnormal response to cortical
activation in early stages of Huntington disease. Mov Disord 2012;27:907-910.
8. Adanyeguh IM, Rinaldi D, Henry PG, et al. Triheptanoin improves brain energy
9. Corvol JC. Neuroprevention: a new challenge? Rev Neurol (Paris)
2012;168:796-801.
10. Huntington Study Group. Unified Huntington's disease rating scale: Reliability
and consistency. Mov Disord 1996;11:136-142.
11. Jenkins BG, Rosas HD, Chen YC, et al. 1H NMR spectroscopy studies of Huntington’s disease: correlations with CAG repeat numbers. Neurology 1998;50:1357-1365.
12. Clarke CE, Lowry M, Quarrell OWJ. No change in striatal glutamate in Huntington’s disease measured by proton magnetic resonance spectroscopy. Parkinsonism Relat Disord 1998;4:123-127.
13. Ruocco HH, Lopes-Cendes I, Li LM, Cendes F. Evidence of thalamic dysfunction
in Huntington disease by proton magnetic resonance spectroscopy. Mov Disord
2007;22:2052-2056.
14. Sturrock A, Laule C, Decolongon J, et al. Magnetic resonance spectroscopy
biomarkers in premanifest and early Huntington disease. Neurology
2010;75:1702-1710.
15. van den Bogaard SJ, Dumas EM, Teeuwisse WM, et al. Exploratory 7-Tesla
magnetic resonance spectroscopy in Huntington's disease provides in vivo evidence
for impaired energy metabolism. J Neurol 2011;258:2230-2239.
16. Liot G, Valette J, Pépin J, Flament J, Brouillet E. Energy defects in Huntington's
disease: Why "in vivo" evidence matters. Biochem Biophys Res Commun
17. Tkác I, Öz G, Adriany G, et al. In vivo 1H NMR spectroscopy of the human brain
at high magnetic fields: metabolite quantification at 4T vs. 7T. Magn Reson Med
2009;62:868-879.
18. Öz G, Tkáč I. Short-echo, single-shot, full-intensity proton magnetic resonance spectroscopy for neurochemical profiling at 4 T: Validation in the cerebellum and
brainstem. Magn Reson Med 2011;65:901-910.
19. Deelchand DK, Adanyeguh IM, Emir UE, et al. Two-site reproducibility of
cerebellar and brainstem neurochemical profiles with short-echo, single-voxel MRS at
3T. Magn Reson Med 2014;73:1718-1725.
20. Gruetter R, Tkac I. Field mapping without reference scan using asymmetric
echo-planar techniques. Magn Reson Med 2000;43(2):319-323.
21. Adanyeguh IM, Henry PG, Nguyen TM, et al. In vivo neurometabolic profiling in
patients with spinocerebellar ataxia types 1, 2, 3, and 7. Mov Disord
2015;30:662-670.
22. Provencher SW. Estimation of metabolite concentrations from localized in vivo
proton NMR spectra. Magn Reson Med 1993;30:672-679.
23. Zacharoff L, Tkac I, Song Q, et al. Cortical metabolites as biomarkers in the R6/2
model of Huntington's disease. J Cereb Blood Flow Metab 2012;32:503-514.
24. Zhou J, Golay X, van Zijl PC, et al. Inverse T(2) contrast at 1.5 Tesla between
gray matter and white matter in the occipital lobe of normal adult human brain. Magn
25. Taylor-Robinson SD, Weeks RA, Bryant DJ, et al. Proton magnetic resonance
spectroscopy in Huntington's disease: evidence in favour of the glutamate excitotoxic
theory. Mov Disord 1996;11:167-173.
26. van Oostrom JC, Sijens PE, Roos RA and Leenders KL. 1H magnetic resonance
spectroscopy in preclinical Huntington disease. Brain Res 2007;1168:67-71.
27. van den Bogaard SJ, Dumas EM, Teeuwisse WM, et al. Longitudinal metabolite
changes in Huntington's disease during disease onset. J Huntingtons Dis
2014;3:377-386.
28. Sturrock A, Laule C, Wyper K, et al. A longitudinal study of magnetic resonance
spectroscopy Huntington's disease biomarkers. Mov Disord 2015;30:393-401.
29. Padowski JM, Weaver KE, Richards TL, et al. Neurochemical correlates of
caudate atrophy in Huntington's disease. Mov Disord 2014;29:327-335.
30. Boer VO, van Lier AL, Hoogduin JM, Wijnen JP, Luijten PR, Klomp DW. 7-T
1H MRS with adiabatic refocusing at short TE using radiofrequency focusing with a
dual-channel volume transmit coil. NMR Biomed 2011;24:1038-1046
31. Rae CD. A guide to the metabolic pathways and function of metabolites observed
in human brain 1H magnetic resonance spectra. Neurochem Res 2014;39:1-36.
32. Brewer GJ, Wallimann TW. Protective effect of the energy precursor creatine
against toxicity of glutamate and beta-amyloid in rat hippocampal neurons. J
33. Tkac I, Dubinsky JM, Keene CD, et al. Neurochemical changes in Huntington
R6/2 mouse striatum detected by in vivo 1H NMR spectroscopy. J Neurochem
2007;100:1397-1406.
34. Mochel F, Durant B, Meng X, et al. Early alterations of brain cellular energy
homeostasis in Huntington disease models. J Biol Chem 2012;287:1361-1370.
35. Gatchel JR and Zoghbi HY. Diseases of unstable repeat expansion: mechanisms
and common principles. Nat Rev Genet 2005;6:743-755.
36. Hoang TQ, Bluml S, Dubowitz DJ, et al. Quantitative proton-decoupled 31P MRS
and 1H MRS in the evaluation of Huntington's and Parkinson's diseases. Neurology
1998;50:1033-1040.
37. Hassel B, Dingledine R. Glutamate. In: Siegel GJ, Albers RW, Brady S, Price D,
editors. Basic neurochemistry: molecular, cellular and medical aspects. 7th edition.
San Diego: Elsevier Academic Press; 2005:267-290.
38. Maddock RJ, Buonocore MH. MR spectroscopic studies of the brain in
psychiatric disorders. Curr Topics Behav Neurosci 2012;11:199-251.
39. Pagano G, Niccolini F, Politis M. Current status of PET imaging in Huntington's
disease. Eur J Nucl Med Mol Imaging 2016;43:1171-1182.
40. Vonsattel JP, DiFiglia M. Huntington disease. J Neuropathol Exp Neurol
1998;57(5):369-384.
41. Oz G, Terpstra M, Tkác I, et al. Proton MRS of the unilateral substantia nigra in
the human brain at 4 tesla: detection of high GABA concentrations. Magn Reson Med
42. Unschuld PG, Edden RA, Carass A, et al. Brain metabolite alterations and
cognitive dysfunction in early Huntington's disease.Mov Disord 2012;27:895-902.
43. Jenkins BG, Koroshetz WJ, Beal MF, Rosen BR. Evidence for impairment of
energy metabolism in vivo in Huntington's disease using localized 1H NMR
spectroscopy. Neurology 1993;43:2689-2695.
44. Gómez-Ansón B, Alegret M, Muñoz E, et al. Decreased frontal choline and
neuropsychological performance in preclinical Huntington disease. Neurology
2007;68:906-910.
45. Sánchez-Pernaute R, García-Segura JM, del Barrio Alba A, et al. Clinical
correlation of striatal 1H MRS changes in Huntington's disease. Neurology
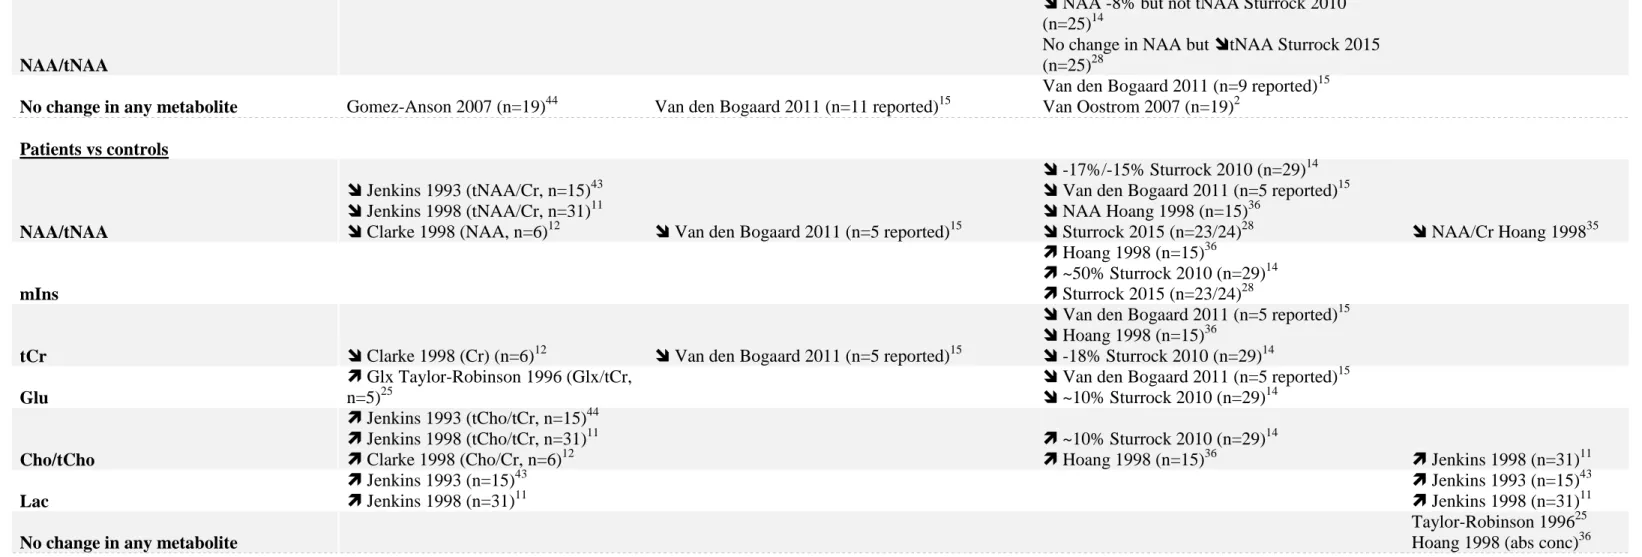
Table 1: Summary of previous 1H MRS studies in the striatum and occipital cortex in HD.
Striatum Caudate Putamen Occipital cortex
Presymptomatic vs controls
NAA/tNAA
NAA -8% but not tNAA Sturrock 2010 (n=25)14
No change in NAA but tNAA Sturrock 2015 (n=25)28
No change in any metabolite Gomez-Anson 2007 (n=19)44 Van den Bogaard 2011 (n=11 reported)15
Van den Bogaard 2011 (n=9 reported)15 Van Oostrom 2007 (n=19)2 Patients vs controls NAA/tNAA Jenkins 1993 (tNAA/Cr, n=15)43 Jenkins 1998 (tNAA/Cr, n=31)11
Clarke 1998 (NAA, n=6)12 Van den Bogaard 2011 (n=5 reported)15
-17%/-15% Sturrock 2010 (n=29)14
Van den Bogaard 2011 (n=5 reported)15
NAA Hoang 1998 (n=15)36
Sturrock 2015 (n=23/24)28 NAA/Cr Hoang 199835
mIns
Hoang 1998 (n=15)36
~50% Sturrock 2010 (n=29)14
Sturrock 2015 (n=23/24)28
tCr Clarke 1998 (Cr) (n=6)12 Van den Bogaard 2011 (n=5 reported)15
Van den Bogaard 2011 (n=5 reported)15
Hoang 1998 (n=15)36
-18% Sturrock 2010 (n=29)14
Glu
Glx Taylor-Robinson 1996 (Glx/tCr, n=5)25
Van den Bogaard 2011 (n=5 reported)15
~10% Sturrock 2010 (n=29)14
Cho/tCho
Jenkins 1993 (tCho/tCr, n=15)44
Jenkins 1998 (tCho/tCr, n=31)11
Clarke 1998 (Cho/Cr, n=6)12 ~10% Sturrock 2010 (n=29) 14 Hoang 1998 (n=15)36 Jenkins 1998 (n=31)11 Lac Jenkins 1993 (n=15)43 Jenkins 1998 (n=31)11 Jenkins 1993 (n=15)43 Jenkins 1998 (n=31)11
No change in any metabolite
Taylor-Robinson 199625 Hoang 1998 (abs conc)36
Mixed presymptomatic/patients vs controls
NAA/tNAA Sanchez-Pernaute 1999 (n=4 PMC, n=6 MC)45
mIns Trend Padowski 2014 (n=6 PMC, n=4 MC)29
tCr Sanchez-Pernaute 1999 (n=4 PMC, n=6 MC)45
Glu
Padowski 2014 (only when considering ratios) (n=6 PMC, n=4 MC)29
Mixed presymptomatic/patients longitudinal changes
NAA/tNAA van den Bogaard 2014 (n=6 PMC, n=1 MC)27
mIns van den Bogaard 2014 (n=7 PMC, n=2 MC)27
Trend mIns/NAA Sturrock 2015 (n = 23/24 MC)28
Cr van den Bogaard 2014 (n=7 PMC, n=2 MC)27
Cho van den Bogaard 2014 (n=6 PMC, n=1 MC)27
No change in any metabolite Sturrock 2015 (n=25/22 PMC, n= 23/24 MC)28
Table 2: Demographic and spectroscopic parameters of participants.
Variable Controls HD patients
No of participants 10.0 10.0 Gender (M/F) 3/7 3/7 Age (years) 38.9 ± 13.8 45.6 ± 12.7 BMI (kg/m2) 21.1 ± 1.7 21.6 ± 3.3 TMS (UHDRS) 0.9 ± 1.0 13.6 ± 10.8 # CAG length 44.1 ± 4.2 Lw striatum (Hz) 6.7 ± 1.0 8.4 ± 1.2 * Lw visual cortex (Hz) 4.6 ± 0.5 4.6 ± 0.5 SNR striatum 46.7 ± 11.3 39.0 ± 16.7 SNR visual cortex 65.6 ± 19.4 57.1 ± 14.5 %CSF striatum 4.5 ± 1.4 12.0 ± 8.4 * %CSF visual cortex 7.0 ± 4.8 17.0 ± 11.5 *
Data are presented as mean ± standard deviation and compared by t-test. BMI: body
mass index; TMS: total motor score; SNR: signal-to-noise ratio estimated by
LCModel; Lw: water linewidth estimated by LCModel; CSF: cerebrospinal fluid.
*p<0.05 and #p≤0.01 represent significant differences between HD patients and
FIGURE LEGENDS
Figure 1: Voxel positioning, spectra quality and model fitting by LCModel in the
visual cortex and striatum. Spectra were acquired in an acquisition voxel of 25 x 25 x
25 mm3 in the visual cortex and 34 x 19 x 23 mm3 in the striatum using the modified
semi-LASER sequence (TR = 5000 ms, TE = 28 ms, averages = 64). The black lines
are the raw spectra, whilst the red lines are the LCModel fits.
Figure 2: Brain tissue volume fraction in VOI in the striatum and visual cortex. Gray
matter (GM) was markedly reduced in the striatum and visual cortex whilst
cerebrospinal fluid (CSF) was significantly increased. *p<0.05 and #p≤0.01 represent
significant differences between HD patients and controls.
Figure 3: Mean metabolite concentrations obtained in the A) visual cortex and B)
striatum. Fewer metabolites are reported for the striatum since they did not meet the
quality control threshold unlike in the visual cortex. Asp: aspartate, Gln: glutamine,
Glu: glutamate, GSH: glutathione, myo-Ins: myo-inositol, sIns: scyllo-inositol, Tau:
taurine, tCho: total choline, tCr: total creatine, tNAA: total N-acetylaspartate. Error
bars represent standard deviations. *p< 0.05, †p≤ 0.001.
Figure 4: Neurometabolite correlations with brain volume fractions of patients. A)
tCr correlated positively with CSF fraction (p = 0.001), and negatively with GM (p <
0.05) and WM (p < 0.001) volume fractions in the visual cortex. B) Glu correlated
negatively with CSF fraction (p < 0.05) and positively with WM volume fraction (p <