HAL Id: hal-02542105
https://hal.inrae.fr/hal-02542105
Submitted on 18 Jun 2021
HAL is a multi-disciplinary open access
archive for the deposit and dissemination of
sci-entific research documents, whether they are
pub-lished or not. The documents may come from
teaching and research institutions in France or
abroad, or from public or private research centers.
L’archive ouverte pluridisciplinaire HAL, est
destinée au dépôt et à la diffusion de documents
scientifiques de niveau recherche, publiés ou non,
émanant des établissements d’enseignement et de
recherche français ou étrangers, des laboratoires
publics ou privés.
Distributed under a Creative Commons Attribution| 4.0 International License
Transcriptional Regulation of Sorghum Stem
Composition: Key Players Identified Through
Co-expression Gene Network and Comparative
Genomics Analyses
Lauriane Hennet, Angélique Berger, Noemi Trabanco, Emeline Ricciuti,
Jean-François Dufayard, Stéphanie Bocs, Denis Bastianelli, Laurent Bonnal,
Sandrine Roques, Laura Rossini, et al.
To cite this version:
Lauriane Hennet, Angélique Berger, Noemi Trabanco, Emeline Ricciuti, Jean-François Dufayard, et
al.. Transcriptional Regulation of Sorghum Stem Composition: Key Players Identified Through
Co-expression Gene Network and Comparative Genomics Analyses. Frontiers in Plant Science, Frontiers,
2020, 11, 19 p. �10.3389/fpls.2020.00224�. �hal-02542105�
fpls-11-00224 March 3, 2020 Time: 13:13 # 1 ORIGINAL RESEARCH published: 03 March 2020 doi: 10.3389/fpls.2020.00224 Edited by: Judy Brusslan, California State University, Long Beach, United States Reviewed by: Nobutaka Mitsuda, National Institute of Advanced Industrial Science and Technology (AIST), Japan Masatoshi Yamaguchi, Saitama University, Japan *Correspondence: David Pot [email protected] Nancy Terrier [email protected]
†These authors have contributed
equally to this work
Specialty section: This article was submitted to Plant Physiology, a section of the journal Frontiers in Plant Science Received: 06 August 2019 Accepted: 12 February 2020 Published: 03 March 2020 Citation: Hennet L, Berger A, Trabanco N, Ricciuti E, Dufayard J-F, Bocs S, Bastianelli D, Bonnal L, Roques S, Rossini L, Luquet D, Terrier N and Pot D (2020) Transcriptional Regulation of Sorghum Stem Composition: Key Players Identified Through Co-expression Gene Network and Comparative Genomics Analyses. Front. Plant Sci. 11:224. doi: 10.3389/fpls.2020.00224
Transcriptional Regulation of
Sorghum Stem Composition: Key
Players Identified Through
Co-expression Gene Network and
Comparative Genomics Analyses
Lauriane Hennet1,2, Angélique Berger1,2, Noemi Trabanco3,4, Emeline Ricciuti1,2,
Jean-François Dufayard1,2, Stéphanie Bocs1,2, Denis Bastianelli2,5, Laurent Bonnal2,5,
Sandrine Roques1,2, Laura Rossini3,6, Delphine Luquet1,2, Nancy Terrier7*†and
David Pot1,2*†
1CIRAD, UMR AGAP, Montpellier, France,2CIRAD, INRA, Montpellier SupAgro, University of Montpellier, Montpellier, France, 3Parco Tecnologico Padano, Lodi, Italy,4Centro de Biotecnología y Genómica de Plantas, UPM-INIA, Instituto Nacional de Investigación y Tecnología Agraria y Alimentaria, Madrid, Spain,5CIRAD, UMR SELMET, Montpellier, France, 6Department of Agricultural and Environmental Sciences - Production, Landscape, Agroenergy, Università degli Studi di Milano, Milan, Italy,7AGAP, CIRAD, INRAE, Montpellier SupAgro, University of Montpellier, Montpellier, France
Most sorghum biomass accumulates in stem secondary cell walls (SCW). As sorghum stems are used as raw materials for various purposes such as feed, energy and fiber reinforced polymers, identifying the genes responsible for SCW establishment is highly important. Taking advantage of studies performed in model species, most of the structural genes contributing at the molecular level to the SCW biosynthesis in sorghum have been proposed while their regulatory factors have mostly not been determined. Validation of the role of several MYB and NAC transcription factors in SCW regulation in Arabidopsis and a few other species has been provided. In this study, we contributed to the recent efforts made in grasses to uncover the mechanisms underlying SCW establishment. We reported updated phylogenies of NAC and MYB in 9 different species and exploited findings from other species to highlight candidate regulators of SCW in sorghum. We acquired expression data during sorghum internode development and used co-expression analyses to determine groups of co-expressed genes that are likely to be involved in SCW establishment. We were able to identify two groups of co-expressed genes presenting multiple evidences of involvement in SCW building. Gene enrichment analysis of MYB and NAC genes provided evidence that while NAC SECONDARY WALL THICKENING PROMOTING FACTOR NST genes and SECONDARY WALL-ASSOCIATED NAC DOMAIN PROTEIN gene functions appear to be conserved in sorghum, NAC master regulators of SCW in sorghum may not be as tissue compartmentalized as in Arabidopsis. We showed that for every homolog of the key SCW MYB in Arabidopsis, a similar role is expected for sorghum. In addition, we
fpls-11-00224 March 3, 2020 Time: 13:13 # 2
Hennet et al. Regulation of Sorghum Stem Composition
unveiled sorghum MYB and NAC that have not been identified to date as being involved in cell wall regulation. Although specific validation of the MYB and NAC genes uncovered in this study is needed, we provide a network of sorghum genes involved in SCW both at the structural and regulatory levels.
Keywords: cell wall, gene co-expression network analysis, internode, phylogeny, transcription factor, NAC, MYB, sorghum
INTRODUCTION
Sorghum is the fifth ranking cereal crop in the world in terms of grain production behind wheat, barley, maize and rice. At the global level, almost half a billion people rely on sorghum daily and consume sorghum grain and flour as a staple food (Paterson, 2008;Frère et al., 2011). In addition, sorghum grains and vegetative parts are also intensively used for feed, energy and natural fiber-reinforced polymer production (Antonopoulou et al., 2008;Carpita and McCann, 2008;Dien et al., 2009;Mullet et al., 2014;Anami et al., 2015;Barcelos et al., 2016;Brenton et al., 2016;Carvalho and Rooney, 2017;Thomas et al., 2019).
Sorghum is a C4 crop that is able to efficiently fix carbon and produce large amounts of vegetative biomass in many different agrosystems. Due to the tolerance of sorghum to low inputs, temperature variability and drought stress (Sanderson et al., 1992;
Rooney et al., 2007; Schmidhuber and Tubiello, 2007; Brown et al., 2008; Zegada-Lizarazu et al., 2012), this crop emerges as a relevant candidate to provide the raw material required for energy and bio based material production. Furthermore, sorghum presents several assets as a plant model (Swaminathan et al., 2010; Aitken et al., 2014; Mullet et al., 2014). The genome of sorghum is relatively simple compared to other grasses with a 730 Mb size unaffected by any recent genome duplication (Paterson et al., 2009;Schnable et al., 2011). Sorghum also exhibits a large genetic (Billot et al., 2013; Morris et al., 2013; Sekhon et al., 2016) and phenotypic diversity, which are extensively mobilized in temperate and tropical breeding programs. Finally, transformation and genome editing tools are available (Liu and Godwin, 2012;Wu et al., 2014;Che et al., 2018). In sorghum, most of the shoot biomass is allocated to the stem in the form of soluble sugars and cell walls (CW). In this article, we focus on the secondary cell wall (SCW) which accounts for a great share of this biomass and is the main resource for energy, natural fiber-reinforced polymer production and animal nutrition. Sorghum SCW is composed of approximately 50% of cellulose, 43% of hemicelluloses, these polysaccharides being also present in the primary cell wall (PCW), and 7% of lignins, a polymeric phenolic compound specific to SCW (Trouche et al., 2014). These CW elements accumulate around fully grown cells that form conductive vessels but also around sclerenchymatous cells, which are the fibers supporting the stem. Many traits of adaptive and agronomic interest rely on the composition of the SCW deposited around stem cells such as plant standability (Gomez et al., 2017, 2018), water transport and biotic and abiotic stress resistance. In addition to these general concerns, as the stem is the raw material for several different uses, SCW composition plays a key role in the adaptation of the varieties
to different end-uses. However, breeders struggle to develop novel varieties gathering desired and sometimes discordant target traits such as plant stiffness, polysaccharide content or stem digestibility. Understanding the mechanisms of SCW formation may unable the enhancement of selection efficiency to meet the needs of growers and users.
In sorghum, significant advances have been achieved through analyses of natural and induced mutants. Genes inducing the brown midrib (bmr) phenotype, which is accompanied by a higher degradability of the CWs have primarily been investigated.
To date, a total of 8 bmr genes have been discovered in
sorghum (Saballos et al., 2012; Sattler et al., 2014). Three of these genes have been characterized at the molecular level and correspond to enzymes of the lignin biosynthetic pathway. Some of these genes have been extensively used to develop sorghum varieties targeting the feed industry (Pedersen et al., 2008). In
addition to thebmr phenotype, additional phenotypic mutants
related to the composition of the SCW have been identified.
Petti et al. (2013, 2015) identified that REDforGREEN and dwarf1.1 mutants affected lignin and cellulose abundance in leaves and stems, in addition to their respective red coloration and shortened internodes.
Although biparental (Murray et al., 2008a,b;Shiringani and Friedt, 2011) and broad-based population analyses (Brenton et al., 2016;Li et al., 2018) allowed the identification of candidate genomic regions potentially contributing to the variability of SCW components, these approaches failed to provide an exhaustive understanding of the genetic control of SCW composition variability in sorghum. At the same time, several transcriptomic analyses attempting to elucidate the molecular pathways and mechanisms underlying SCW establishment in developing internodes highlighted the differential expression patterns of extensive gene sets (Shakoor et al., 2014; McKinley et al., 2016; Rai et al., 2016;Kebrom et al., 2017). Nevertheless low levels of congruence between the genetic (Quantitative Trait Loci/Quantitative Trait Nucleotides) and genomic (transcriptomic) approaches have been observed to date. Only a few structural candidate genes controlling the activity of key CW biosynthetic enzymes were identified and additional work is needed regarding the transcription factors (TF) that can fine-tune the mechanisms involved in SCW deposition.
Previous work in Arabidopsis provided strong knowledge on the TFs involved in SCW regulation. Most of these genes are members of the MYB (Myb proto-oncogene like) and the
NAC (NAM, ATAF and CUC2) TF families (Zhong et al.,
2008). These TFs act as master switches of SCW deposition
or as more specific regulators of SCW component synthesis and assembly (Figure 1). The functions of some of the master
fpls-11-00224 March 3, 2020 Time: 13:13 # 3
Hennet et al. Regulation of Sorghum Stem Composition
regulators have been shown to be conserved, at least in some
aspects, in rice, maize, poplar and eucalyptus (Goicoechea
et al., 2005; McCarthy et al., 2010; Zhong et al., 2011a,b,
2013). The TF knowledge base that has been developed in
Arabidopsis and in a few other model species constitutes an opportunity to accelerate and facilitate the discovery of genes involved in SCW regulation in sorghum and grasses. Regulation of SCW deposition in sorghum is only scarcely understood. Only one TF (SbMyb60) has been recently validated
to induce monolignol biosynthetic pathway (Scully et al.,
2016) (Figure 1).
The objective of this work is to identify regulatory mechanisms of SCW deposition in sorghum, First, the homologies between TF already validated for their role in SCW deposition regulation in various species (grass and non-grass) and sorghum genes have been investigated using comparative genomics. In a second step, transcriptomic datasets based on internode development dynamics were produced and used to reach a better understanding of the co-expressed gene networks and key TF s likely to be involved in SCW formation.
MATERIALS AND METHODS
Phylogenetic Analyses of the MYB and
NAC Transcription Factor Families
Publicly available MYB and NAC protein sequences1 from
Arabidopsis thaliana were used to produce specific signatures of each family using the Galaxy toolbox (Afgan et al., 2018) with MAAFT (Katoh et al., 2017) and TrimAl scripts ( Capella-Gutiérrez et al., 2009) (only sites with less than 90% of gaps were kept, conserving at least 10% of the total protein length, otherwise the default parameters were used). As a second step, highly specific thresholds for protein sequence similarity (e-value = 10−22
for the MYB family and e-value = 10−30
for NAC family, these thresholds were deduced from observed e-values of Arabidopsis) were used to recover homolog proteins from 9 plant proteomes using the Arabidopsis signatures library and the HMM (Hidden Markov Model) approach.
Five monocotyledons (maize: Zea mays, rice: Oryza sativa
susp japonica, sorghum: Sorghum bicolor, purple false brome: Brachypodium distachyon, and foxtail millet: Setaria italica) and four dicotyledon proteomes (Arabidopsis thaliana, barrel medic: Medicago truncatula, eucalyptus: Eucalyptus grandis, and poplar: Populus trichocarpa) were used in this step.
Then, alignments of full-length proteins were generated with MAFFT and the sequences were trimmed using Trimal (gt option = 0.9 and cons option = 10). The alignments were refined keeping only the longest splicing variant of each gene. One phylogenetic tree per TF family was generated using the
Maximum Likelihood method implemented in PhyML (Guindon
et al., 2010;Anisimova et al., 2011;Zhou et al., 2018). The Rap-Green rooting tool (Dufayard et al., 2005) was used to reconcile the obtained gene trees with the general species tree to identify gene duplication and optimize gene function inference. Full size
1http://planttfdb.cbi.pku.edu.cn/
phylogenetic trees are available in the Supplementary Material as well as online2.
Gene Expression Evolution During
Internode Development of a Sorghum
Biomass Hybrid in Different Water
Availability Regimes
Field Conditions and Sampling Strategies
Transcriptome evolution of developing internodes was analyzed in three field experimental trials in 2013, 2014, and 2015. In these three experiments, “Biomass140,” a commercial hybrid developed by Eurosorgho34, which corresponds to an industrial
biomass ideotype (high biomass production and late flowering), was analyzed in contrasting water availability regimes on the DIAPHEN field phenotyping platform in Mauguio (southern France; Delalande et al., 2015; 43◦
360 4300 N, 3◦ 580 200 E) during the summer seasons (sowing on May 22nd, May 23rd, May 13th, respectively for 2013, 2014, and 2015).
The water regimes corresponded to the well-watered (WW) and water deficit (WD) treatments. WD consisted of a 1-month dry-down period that began when the plants had, on average, 11 ligulated (expanded) leaves on the main stem. The stage of 11 ligulated leaves was chosen because it corresponds to the onset of rapid elongation of internodes (Gutjahr et al., 2013).
Although the main objective of this work was to reach a better understanding of the molecular mechanisms underlying cell wall establishment in sorghum, we decided to take advantage of the results produced in two contrasting water regimes. This decision was motivated by the facts that gene co-expression networks relevance relies on the number of biological conditions that are explored (taking advantage of the WD samples we doubled the biological conditions explored), and on the comparability of the samples analyzed (in our case, we focused our attention on internode samples exclusively). As the objective of this study was not to identify the genes involved in the specific response to WD but instead to highlight the gene co-expression networks constitutively involved in the establishment of the internode cell wall, neither differential expression analysis nor identification of gene networks activated in response to drought deficit were performed.
The experiments corresponded to randomized complete block designs with 4 and 3 replications in 2013 and 2014–2015, respectively. The individual plot had 7 m long rows spaced at 0.8 m (8 and 4 rows per plot respectively in 2013 and 2014–2015). Eighteen seeds were sown per linear meter.
Different sampling strategies of the internodes were used for the three experiments (Supplementary Figure S1). In 2013, two internode levels corresponding to the 12th and 16th ligulated
leaves were harvested at five different stages (defined as D1 to D5) in the two water regimes (with the exception of the top internode for the first stage as it was not yet available).
2https://phylogeny.southgreen.fr/Hennetetal/FigureS5MYBtree_rep.svg
and https://phylogeny.southgreen.fr/Hennetetal/FigureS3NACtree_rep.svg
3www.euralis.fr/
4https://www.semencesdeprovence.com/
fpls-11-00224 March 3, 2020 Time: 13:13 # 4
Hennet et al. Regulation of Sorghum Stem Composition
FIGURE 1 | MYB, NAC, and other regulators of SCW biosynthesis functionally validated in Arabidopsis, maize, rice, and sorghum (Adapted fromWang and Dixon, 2012;Liu et al., 2014;Rao and Dixon, 2018).
In 2014, six internode levels were harvested at three different stages in the two water regimes. The internodes corresponding to the 13th and 15th ligulated leaves were harvested at the
three sampling stages. The internodes corresponding to the
14th and 16th ligulated leaves were harvested only for the
first sampling stage and the internodes corresponding to the 17th and 19th ligulated leaves were exclusively harvested at the last two sampling stages. In 2015, four internode levels were
fpls-11-00224 March 3, 2020 Time: 13:13 # 5
Hennet et al. Regulation of Sorghum Stem Composition
harvested at two stages in the two water regimes. In this case, the internodes were sampled according to their relative position from the last ligulated leaf of the stem. For the first date of analysis (23/07/2015), the four top internodes starting from the last ligulated leaf were harvested. On average, the internodes corresponded to the internodes ranked 14th, 13th, 12th, and 11th.
For the second date of analysis (24/09/2015), the four internodes that were sampled corresponded to the flag leaf internode (FL,
which corresponded on average to the 23rd internode rank)
to the FL-2 (21st internode rank), FL-4 (19th internode rank)
and FL-6 internodes (17th internode rank). Each internode
sample corresponded to pools of 3 or 4 individual internodes from independent plants, respectively for 2014–2015 and 2013. Duplicated internode samples were harvested for each internode level, stage, biological replicate and either directly frozen in liquid nitrogen and stored at −80◦
C after harvest for further transcriptomic analysis or dried at 60◦
C for 72 h for biochemical composition analyses.
Total RNA Isolation and Library Construction
Total RNA isolation was performed according to the procedure described inChomczynski and Sacchi (1987). Frozen internodes (−80◦
C) were ground to a fine powder using the IKA R
A11 basic analysis mill (Ika, Staufen, Germany) and 1 ml of TRIZOL R
Reagent was used for 100 mg powder. RNA integrity number (RIN) and quantification of total RNA were measured using the Agilent 2100 Bioanalyzer Nano 6000 chip. A total of 398 RNASeq libraries (158 in 2013, 144 in 2014 and 96 in 2015), for a total of 191 internode samples, were prepared according to the Illumina protocol with the TruSeq RNA Library Prep Kit (Illumina, United States), using 1 µg of total RNA. The indexed libraries were pooled in 24-plex and subjected to single-end 1 × 150 bp sequencing on an Illumina HiSeq2500 (at the Genotoul platform5
in Toulouse, France). Each pool of 24 libraries was run in parallel on two lanes, allowing a technical replicate (a total of 14 lanes). The raw sequence files are available on the short read archive under the bioproject PRJNA560153.
Quality Control, Alignment and Read Count Definition
FastQC (Andrews, 2010) was used to check raw read sequence
quality [i.e., detection of adaptors, average quality on the whole sequence (phred score), GC content, duplicated reads and PCR contamination]. Fastq reads were cleaned
using cutAdapt (Martin, 2011) to trim read ends of poor
quality (Q score below 20) and to keep only those with an average quality above 30 and a minimum length of 35 base pairs. For the following steps, the programs described in Sarah et al. (2017) and available on the Southgreen
platform6 were used: arcad_hts_0_fastqc_in_chains.pl,
arcad_hts_1_cutadapt_in_chain.pl, and arcad_hts_2_Filter_
Fastq_On_Mean_Quality.pl.
Transcript expression levels have been estimated with the new Tuxedo pipeline (Pertea et al., 2016). First, for each RNA sample, RNA-seq reads were mapped on the sorghum genome
5https://www.genotoul.fr/
6https://github.com/SouthGreenPlatform/arcad-hts
assembly Sbicolor_313_v3.1 using Hisat2 (Kim et al., 2015). Genes and transcripts were assembled and quantified with stringtie, using the reference annotation file (in GFF3 format) to guide the assembly process. The output included expressed reference transcripts as well as any novel transcripts that were
assembled. Gffcompare7 was used to compare transcripts with
the reference annotation (gene and transcript predictions) and to identify new genes/transcripts. The sorghum genome assembly “Sbicolor_313_v3.1” and enriched annotation files have been used to estimate abundance with stringtie.
Gene Co-expression Network Analysis
Identification of the Co-expression Gene Networks
Only genes harboring more than 3 reads in at least 20 internode samples (over the 191 internode samples) were considered for the co-expression analyses. The co-expression gene network was
built with the WGCNA R package (Langfelder and Horvath,
2008, 2012) using the normalized and filtered expression data set. Normalization was performed with the EdgeR package. A total of 20.294 genes were finally retained in the co-expression network analysis. Block and year effects were estimated using the removeBatchEffect function from the R Limma package (Ritchie et al., 2015). No such effect was detected and no outlier samples needed to be trimmed. The network was built using the “signed” networkType parameter, enabling to capture the direction of the expression variation and grouping genes with the same direction variation in gene expression. This parameter is advised to identify biologically meaningful modules (van Dam et al., 2018). According to the mean connectivity and the scale-free topology index curves (Supplementary Figure S2), a power of 12, which is commonly used for this type of data, was used in this study. This result showed that our data fit the scale-free topology approximation, which is desirable to use WGCNA analysis. It also indicated that no strong driver could bias our analysis. Relationships between every pair of genes were explored with Pearson correlation coefficient in the WGCNA package. For most of the results discussed, only genes harboring strong correlations with other genes were considered. An adjacency (which is the correlation raised to a power allowing to amplify disparity between strong and weak correlation) threshold of 0.1, corresponding to an expression correlation of 0.82 between genes was used to define the different modules. Otherwise default parameters of WGCNA were used and modules were named with randomly picked colors.
Gene Network Enrichment Analysis
As a global approach, the modules obtained using WGCNA were characterized according to their enrichment in Gene
Ontology (GO) terms using the TopGO R package (Alexa
and Rahnenfuhrer, 2019). Default parameters and the sorghum
GO list from PLAZA monocots 4.0 database8 were used.
A threshold p-value of 0.05 was considered to define significant enriched ontologies. Raw enrichment results are available in
Supplementary Table S1.
7https://github.com/gpertea/gffcompare
8ftp://ftp.psb.ugent.be/pub/plaza/plaza_public_monocots_04/GO/
fpls-11-00224 March 3, 2020 Time: 13:13 # 6
Hennet et al. Regulation of Sorghum Stem Composition
We gathered Biological Process GO terms in keyword groups to address easily meaningful information (Supplementary
Table S2). For instance, under the keyword “SCW” we gathered four different ontologies; negative/positive “regulation of SCW biogenesis,” “regulation of SCW biogenesis,” and “plant-type secondary cell biogenesis.”
A custom gene list of CW related genes was obtained from the aggregation of genes listed in previous publications (Petti et al., 2015; McKinley et al., 2016; Rai et al., 2016) (Supplementary
Table S3). In addition to the GO enrichment analysis, Fisher’s exact test was also performed for every module to detect enrichment in these candidate CW related genes.
In addition, the sorghum MYB and NAC genes (SbMYB and SbNAC) identified in phylogenetic analyses were used as bait genes to characterize their co-expressed gene networks. For this purpose, the 15 most correlated genes were selected for every MYB or NAC gene. Then, a second layer of co-expressed genes was retrieved by listing the top 15 correlated genes of the first layer. These so called “top subnetwork gene lists” were analyzed using the GO term and CW related gene enrichment analyses presented earlier. Lists of genes for each bait gene and their significant enrichment are available as Supplementary Data (Supplementary Tables S4, S5).
Identification of Hub Genes
Intramodular connectivity of each gene was calculated using the WGCNA function “intramodularConnectivty.fromExpr”. The highest connectivity is, the more central the gene is. These top genes are expected to play crucial biological roles. We compared the “top 10%” and top 10 genes in the whole considered module (i.e., without correlation threshold selection) with the “top 10%” and top10 genes preliminarily filtered considering the 0.82 correlation threshold.
Internode Biochemical Characterization
The quantification of lignin, cellulose and hemicellulose contents were derived from Near InfraRed (NIR) Spectrum analysis based on the Van Soest reference method (Van Soest et al., 2010). This method provides estimates of total fiber (NDF, neutral detergent fiber, expressed in percentage of dry matter, %DM), lignocellulose (ADF, acid detergent fiber, expressed in %DM) and lignin (ADL, acid detergent lignin, expressed in %DM). The same internode levels as those used for the transcriptomic analyses were sampled and dried for 72 h at 60◦
C. The dried samples were ground at a 1 mm sieving size and NIR spectra were acquired with a NIR system 6500 spectrometer (FOSS NirSystem, Laurel, MD, United States). The calibration models for the different traits were developed according to a set of more than 700 reference biochemical data points for each trait. NDF, ADF, and ADL were then used to calculate the hemicellulose (Xylans) content (computed as NDF-ADF, %DM) and the cellulose content (computed as ADF-ADL, %DM). The Crop Ontology ID9of the variables used in this study are provided
in Supplementary Table S6.
9http://www.cropontology.org/ontology/CO_324/Sorghum
RESULTS
Phylogenetic Analyses of the NAC
Transcription Factor Family
NAC genes from five monocotyledons (sorghum, maize, rice, foxtail millet, purple false brome) and four dicotyledons (Arabidopsis, poplar, eucalyptus, barrel medic) were retrieved from the nucleotide databases. One hundred twelve Arabidopsis genes, 168 poplar, 163 eucalyptus, 70 barrel medic, 136 maize, 132 foxtail millet, 129 rice, 138 brome and 122 sorghum genes were identified (Supplementary Table S7). These numbers are relatively similar to those previously reported in these species. Previously, 105 (Ooka et al., 2003) and 117 (Nuruzzaman et al., 2010) NAC genes were identified in Arabidopsis, 288 ( Pereira-Santana et al., 2015) and 163 (Hu et al., 2010) in poplar, 189 in eucalyptus (Hussey et al., 2015), 97 in barrel medic (Ling et al., 2017), 124 (Fan et al., 2014) and 152 (Shiriga et al., 2014) in maize, 147 in foxtail millet (Puranik et al., 2013), 151 (Nuruzzaman et al., 2010) and 140 (Fang et al., 2008) in rice, 107 (You et al., 2015) and 118 (Zhu et al., 2015) in brome and 131 (Sanjari et al., 2019) and 145 (Kadier et al., 2017) in sorghum.
We used a recent study of the NAC family in sorghum (Sanjari et al., 2019) to support the characterization of the phylogenetic tree obtained in this work. We recovered 122 out of 131 SbNAC reported in Sanjari’s work and eight of the 15 clades described by
Sanjari et al. (2019)remained unchanged in our tree (Figure 2A,
Supplementary Table S7, and Supplementary Figure S3). The former clade N was fused to the former clade O becoming the new clade O. Clade K was divided into new clades S and K. Clade L was divided into two subclades 1 and 2. New clade F gathered most of the former clade F genes, some genes from different former clades and all genes from former clades I and clade H that no longer exist. Among the nine genes reported bySanjari et al. (2019)that were not identified in the present analysis, seven were former clade F genes. Outside of clade F genes, only four sorghum genes did not match the former clade and were allocated to new clades. A new clade P was created and contains only monocotyledon genes. Enrichments of clades B and F in monocotyledon genes were observed. Clade F which is the largest one detected, with 193 sequences, contains 135 (69%) monocotyledon and 58 (31%) dicotyledon genes. No functional information is available in Arabidopsis regarding this clade. Among the 54 genes included in clade B, 81% (44 genes) correspond to monocotyledon genes. According to the function reported for AtNAC1 which belongs to this clade, clade B can be potentially involved in auxin transportation (Xie et al., 2000).
Among the thirteen Arabidopsis NAC genes for which functional evidence of involvement in CW establishment has been reported, nine belong to the C clade, whereas two are included in the G clade (SECONDARY WALL-ASSOCIATED NAC DOMAIN PROTEIN 2 AtSND2 and AtSND3) and one is included in clade K (VND-INTERACTING 2 AtVNI2).
Overall, according to the specific monocotyledon and dicotyledon lineages detected for the different SCW NAC genes, no single specific sorghum ortholog of the AtNAC genes was identified. With the exception of VNI2 (At5g13180) for which a large diversification was observed in monocotyledons
fpls-11-00224 March 3, 2020 Time: 13:13 # 7
Hennet et al. Regulation of Sorghum Stem Composition
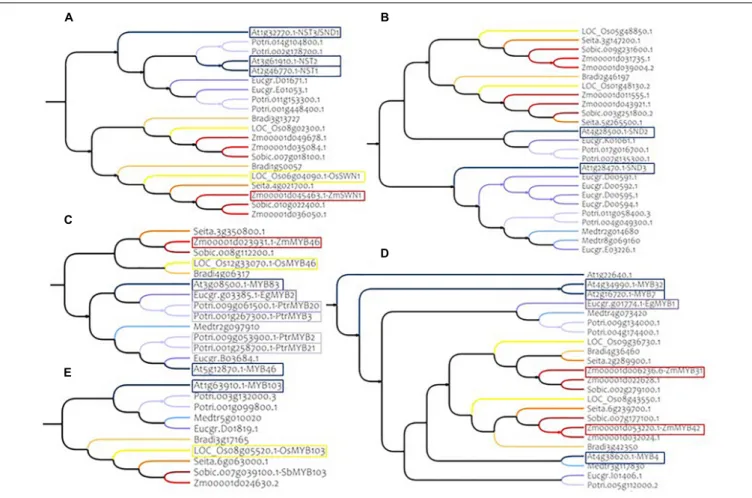
FIGURE 2 | Phylogenetic trees of NAC (A) and MYB (B) based on the protein sequences from five monocotyledons and four dicotyledons species. Colors correspond to the different clades (letters for NAC and numbers for MYB, see caption). Subclades are designed with numbers in the NAC tree and letters in the MYB tree. Comparisons with the phylogenetic trees obtained bySanjari et al. (2019)for the NAC tree and withLi et al. (2016)for the MYB tree are provided below the clade identifiers. Conserved clades are indicated by light gray boxes, new clades are in dark gray and clades with reallocation of genes are in light orange.
(6 homologs in sorghum and up to 13 in Brachypodium,
Supplementary Figure S4A), a relative homogeneity of the gene numbers was observed between Arabidopsis and sorghum. As an example, we identified two sorghum orthologs (here referred as SbNSTa and SbNSTb, Figure 3A and
Table 1) for the Arabidopsis genes AtNST1, AtNST2 and AtNST3/SND1 (NAC SECONDARY WALL THICKENING PROMOTING FACTOR1, 2 and 3). These closely related genes are responsible for SCW regulation in Arabidopsis (Mitsuda et al., 2005, 2007; Zhong et al., 2006). We also identified two sorghum orthologs for genes AtSND2 and AtSND3 (here referred as SbSNDa and SbSNDb, Figure 3B and Table 1), that have been described as SCW regulators in Arabidopsis too (Zhong et al., 2008; Hussey et al., 2011;
Sakamoto and Mitsuda, 2015).
Phylogenetic Analyses of the MYB
Transcription Factor Family
Using the same procedure as for the NAC genes, sequences from nine different species were retrieved from Phytozome database to revise the phylogenetic relationships of the MYB family and for the identification of SbMYB genes that could be involved in SCW establishment. One hundred forty-four genes were identified in Arabidopsis, 210 in poplar, 171 in eucalyptus, 102 in barrel medic, 180 in maize, 135 in foxtail millet, 126 in rice, 125 in brome and 135 in sorghum (Supplementary Table S8). To the same extent as for NAC genes, these numbers globally match to the ones previously described for these species. One hundred
ninety-seven (Katiyar et al., 2012), 198 (Yanhui et al., 2006), and 133 (Li et al., 2016) MYB genes were identified in Arabidopsis, 191 in poplar (Wilkins et al., 2009),141 in eucalyptus (Soler et al., 2015), 155 in barrel medic (Zhong and Ye, 2015), 157 in maize (Du et al., 2012), 209 in foxtail millet (Muthamilarasan et al., 2014), 233 (Smita et al., 2015), 155 (Katiyar et al., 2012),
and 163 (Yanhui et al., 2006) MYB in rice and 122 in brome
(Zheng et al., 2017).
Because there is no published MYB phylogeny inSorghum
bicolor, we used the most recent study involving Arabidopsis
MYB genes (Li et al., 2016) as a base to anchor our
multi-species classification.Li et al. (2016)described 133 Arabidopsis genes allocated to fourteen clades (1–14). Clade numbering was rearranged taking into account the position of Arabidopsis genes in our phylogenetic tree. All of the Arabidopsis genes identified inLi et al. (2016)were included in the 144 Arabidopsis MYB genes selected for this study. Most of the clades in the multispecific phylogenic tree were recovered and most of the Arabidopsis genes maintained similar phylogenetic links (Figure 2B, Supplementary Figure S5, and Supplementary
Table S8). Clades 2, 4, 5, 7, 8, and 11 were conserved even though clades 5, 8, and 11 lost a few Arabidopsis genes that were allocated to other branches in the tree. Clades 1, 3, 6, 10, and 12 were separated into two subclades each, named A and B. A new clade, clade 15, has been created and is mainly composed of genes from former clades 9 and 13 in addition to other genes originating from other former clades. Former clades 13 and 9 in this new clade 15 are specifically identified as 15A and 15B. A new multi-specific clade named
fpls-11-00224 March 3, 2020 Time: 13:13 # 8
Hennet et al. Regulation of Sorghum Stem Composition
FIGURE 3 | Phylogenetic subtrees of some major MYB and NAC genes in nine species. (A) Homologs of AtNST1, AtNST2, and AtNST3/SND1 (Clade C) (B) homologs of AtSND2 and AtSND3 (Clade G) (C) homologs of AtMYB83 and AtMYB46 (Clade 4) (D) homologs of AtMYB4 (Clade 15A) (E) homologs of AtMYB103 (Clade 4). Warm colors (yellow to red) represent monocotyledon branches (rice, maize, setaria, brachypodium, and sorghum) and cold colors (gray to dark blue) represent dicotyledon branches (medicago, eucalyptus, poplar and Arabidopsis). Colored frames highlight functionally validated genes. Correspondences between sorghum genes IDs and gene name synonyms are available in Supplementary Table S11.
16 was identified and included mainly Arabidopsis genes not described inLi et al. (2016).
Overall, 23 Arabidopsis genes did not show the same
phylogenetical link between our work and Li et al.’s (2016)
publication. Eleven new Arabidopsis genes were included in our analysis compared toLi et al. (2016)work. Nine of these genes were allocated to the new clade 16 and to two other clades. These new genes are listed as MYB genes on other databases and 4 are MYB-related (Jin et al., 2017). The 135 SbMYB genes identified are distributed in all of the clades.
Clades 4 and 15 encompassed a large number of genes as a result of the merging of several Arabidopsis subgroups
from the tree provided by Dubos et al. (2010). Clade 4
includes subgroups S13 and S16, while clade 15 includes S4, S6, S7, and S15. Clades 1B and 15 contain a small number of monocotyledon genes (33 and 26%, respectively), whereas an average of 42% of monocotyledon sequences was observed over all the clades. This could be explained by diversification events within the two perennial woody species (populus and eucalyptus). Clade 1B from our analysis is
composed of subgroups S2 and S3 from Dubos et al. (2010).
Genes from subgroup S3 have been identified to be involved in CW biosynthesis. Clade 15 includes Arabidopsis subgroups S4, S5, S6, and S7, all of them involved in phenylpropanoid synthesis regulation (Dubos et al., 2010). On the other hand, we observed an enrichment of monocotyledon sequences in clade 1A (57%). This clade includes genes, from subgroup S1 in Arabidopsis, that have been reported to be involved in abiotic stress responses (Seo et al., 2009; Seo and Park, 2010;
Li B. et al., 2019).
Clade 4 includes nine of the 17 MYB genes that have been reported to have a role in SCW establishment. Two of them, AtMYB46 and AtMYB83, are redundant genes in Arabidopsis and in our phylogenetic analysis we found only one ortholog for each of the monocotyledon species (Figure 3C and Table 1). Another example is AtMYB103, which has only one ortholog in monocotyledon species (Figure 3E and
Table 1).
In addition to the clade 4, clades 1B, 12, and 15 also contain MYB genes involved in SCW composition (2, 3, and 3 respectively). Among these genes, AtMYB4, a negative regulator of SCW belonging to clade 15, presents at least two
fpls-11-00224 M ar ch 3, 2020 T ime: 13:13 # 9 Hennet et al. Regulation of Sorghum Stem Composition
TABLE 1 | Major MYB and NAC regulators of SCW in Arabidopsis, their homolog genes in sorghum and their homolog genes validated in other species.
TF Arabidopsis SCW gene Homologs
Gene ID Name
synonym
Publication Clade Gene ID Name synonym Validation Publication
NAC AT2G46770; AT1G32770; AT3G61910 NST1; NST3/SND1; NST2 Mitsuda et al., 2005, 2007;Zhong et al., 2006, 2007b C Zm00001d045463 ZmSWN1 complement snd1/nst1 At mutant + Oe activates SCW TF Zhong et al., 2011a LOC_Os06g04090 OsSWN1 Sobic.007G018100 SbSWN2/SbNSTa Sobic.010G022400 SbSWN1/SbNSTb AT4G28500; AT1G28470 SND2; SND3
Hussey et al., 2011 G Sobic.003G251800 SbSNDb
Sobic.009G231600 SbSNDa
AT1G71930 VND7 Kubo et al., 2005 C LOC_Os08g01330 OsSWN3 complement
snd1/nst1 At mutant + Oe activates SCW TF Zhong et al., 2011a JN634079 ZmSWN3 Sobic.007G003000 SbSWN3/SbVND7a Sobic.006G279400 SbSWN2/SbVND7b AT1G12260; AT1G62700; AT5G62380 VND4; VND5; VND6
Ohashi-Ito et al., 2010 C Sobic.010G002900 SbSWN5/SbVND4-6a
Sobic.006G160900 SbSWN6/SbVND4-6c Sobic.004G302400 SbSWN7/SbVND4-6b JN634082 ZmSWN6 Complement snd1/nst1 At mutant + Oe activates SCW TF Zhong et al., 2011a JN634083 ZmSWN7 LOC_Os06g01480 OsSWN7 AT2G18060; AT4G36160; AT5G66300 VND1; VND2; VND3
Zhou et al., 2014 C Sobic.001G316800
Sobic.001G522700
SbVND1-3a SbVND1-3b
AT4G29230 NAC075 Endo et al., 2015 G Sobic.003G035100 SbNAC75a
Sobic.006G004100 SbNAC75b Sobic.006G003800 SbNAC75c Sobic.009G071600 SbNAC75d Sobic.009G071500 SbNAC75e
AT5G13180 VNI2 Yamaguchi et al., 2010 K Sobic.002G259600 SbVNI2g
Sobic.007G190333 SbVNI2f Sobic.003G409800 SbVNI2e Sobic.003G423200 SbVNI2d Sobic.006G141900 SbVNI2c Sobic.008G094700 SbVNI2b Sobic.005G056300 SbVNI2a MYB AT3G08500; AT5G12870 MYB83; MYB46
Zhong et al., 2007a;
McCarthy et al., 2009;
Zhong and Ye, 2012
4 Sobic.008G112200 SbMYB83 Zm00001d023931 ZmMYB46 Oe in At activates SCW biosynthesis program Zhong et al., 2011a LOC_Os12g33070 OsMYB46
Potri.001G267300 PtrMYB3 Oe leads to ectopic
deposition of SCW
McCarthy et al., 2010
Potri.009G061500 PrtMYB20
Potri.001G258700 PtrMYB21 Zhong et al.,
2013 (Continued) Fr ontiers in Plant Science | www .fr ontiersin.org 9 Mar ch 2020 | V olume 11 | Article 224
fpls-11-00224 M ar ch 3, 2020 T ime: 13:13 # 10 Hennet et al. Regulation of Sorghum Stem Composition TABLE 1 | Continued
TF Arabidopsis SCW gene Homologs
Gene ID Name
synonym
Publication Clade Gene ID Name synonym Validation Publication
Potri.009G053900 PtrMYB2
Eucgr.G03385 EgMYB2 Oe in tobacco
increases SCW thickness Goicoechea et al., 2005 AT1G09540; AT4G01680 MYB61; MYB55 Newman et al., 2004; Romano et al., 2012 4 Sobic.009G036500 SbMYB61a Sobic.003G136600 SbMYB61b
LOC_Os01g18240 OsMYB55/61 RNAi plants show
abnormal phenotype
Hirano et al., 2013b
AT1G63910 MYB103 Zhong et al., 2008 4 Sobic.007G039100 SbMYB103
LOC_Os08g05520 OsMYB103 RNAi plants show
abnormal phenotype Hirano et al., 2013b AT5G16600; AT1G66230 MYB43; MYB20
Zhong et al., 2008 4 Sobic.007G132600 SbMYB20/43a
Sobic.002G196100 SbMYB20/43b Sobic.002G196000 SbMYB20/43c Sobic.004G248700 SbMYB20/43d Sobic.010G106601 SbMYB20/43e AT1G16490; AT1G79180 MYB58; MYB63 Zhong et al., 2008; Zhou et al., 2009
1B Sobic.004G273800 SbMYB60 Scully et al.,
2016 Sobic.006G199800 SbMYB60b AT1G17950; AT1G73410 MYB52; MYB54 Zhong et al., 2008;
Zhong and Ye, 2012
12B Sobic.001G110900 SbMYB52/54
AT4G33450 MYB69 Zhong et al., 2008 12B Sobic.008G063400 SbMYB69a
Sobic.005G104800 SbMYB69b AT4G12350;
AT4G22680
MYB42, MYB85
Zhong et al., 2008 4 Sobic.002G275500 SbMYB42a
Sobic.007G178300 SbMYB42b
LOC_Os09g36250 OsMYB42/85 RNAi plants show
abnormal phenotype Hirano et al., 2013b Zm00001d032032 ZmMYB167 Oe in Zm lead to increased lignin Bhatia et al., 2019 AT4G38620; AT2G16720; AT4G34990 MYB4; MYB7; MYB32 Preston et al., 2004; Mitsuda et al., 2007; Ko et al., 2009
15A Sobic.007G177100 SbMYB4b
Sobic.002G279100 SbMYB4a
Eucgr.G01774 EgMYB1 Oe in At reduces
SCW thickening
Legay et al., 2010
Zm00001d053220 ZmMYB42 Oe decreases lignin
content + downregulates COMT
Fornalé et al., 2006
Zm00001d006236 ZmMYB31
Validation method and publication are reported, as well.
Fr ontiers in Plant Science | www .fr ontiersin.org 10 Mar ch 2020 | V olume 11 | Article 224
fpls-11-00224 March 3, 2020 Time: 13:13 # 11
Hennet et al. Regulation of Sorghum Stem Composition
FIGURE 4 | Expression patterns of the co-expression modules identified through the WGCNA analyses and dynamics of accumulation of the main cell wall components. (A) Correlation heatmap based on the normalized expression pattern of all the genes of each module. Clustering of the modules in 7 clusters was based on the distance dendrogram provided on the right. The mean gene expression patterns of some of the modules for the 2013 experiment (internode 12 in irrigated conditions) are presented on the left side of the correlation heatmap to illustrate the general patterns of expression along the five developmental stages that have been analyzed. Modules for which enrichments in SCW and general CW GO terms and CW-related enzymes have been detected are framed in green color. Although the presented expression patterns only correspond to the 2013 trial, the correlations and the distances among the modules are based on the expression patterns observed over the three trials. (B) Patterns of accumulation of the three main cell wall components in internode 12 of the well-watered treatment of the 2013 trial. Stages with different letters present significantly different mean values. The error bars correspond to the standard errors based on four biological replicates. The anthesis date is indicated by a vertical gray dotted line.
orthologs in each of the monocotyledon species (Figure 3D and Table 1).
Whole Genome Sorghum Transcriptome
Co-expression Network
Identification of Co-expressed Gene Modules Potentially Involved in Cell Wall Construction
The first step to construct expression network to dissect molecular mechanisms involved in a specific physiological event (here construction of SCW) is to obtain multiple expression data from several conditions and developmental stages when those events take place. In this purpose, identification of the gene co-expression networks has been conducted on the analysis of three field experimental trials. Slightly more than 4.7 billion of raw reads were obtained over these experiments with 1.95,
1.63, and 1.39 billion reads respectively for 2013, 2014 and 2015. On average, 5% of the sequences were discarded after the Fastq cleaning step and 85% were successfully mapped on the V3.1 reference genome (for a total of 3.96 billion reads). After filtering based on the expression level, a total of 20,294 genes were considered for the co-expression analysis. Forty-five modules containing from 32 to 2937 genes were originally detected but only 30, totaling 12422 genes, were kept according to the filter used for the correlation expression threshold. Among these clusters, four clusters contained less than 10 genes, 12 had between 10 and 100 genes, 10 had between 100 and 1000 genes, and the remaining four clusters harbored more than 1000 genes (Supplementary Figure S2B).
Clustering of the normalized expression pattern of every module shows groups of modules with similar expression patterns (Figure 4A). Seven clusters of modules (C1–C7)
fpls-11-00224 March 3, 2020 Time: 13:13 # 12
Hennet et al. Regulation of Sorghum Stem Composition
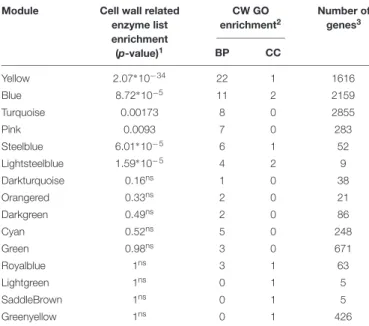
TABLE 2 | Enrichment analyses of the modules based on a cell wall-related enzyme list and SCW and general CW GO terms (CW GO terms).
Module Cell wall related
enzyme list enrichment (p-value)1 CW GO enrichment2 Number of genes3 BP CC Yellow 2.07∗10−34 22 1 1616 Blue 8.72∗10−5 11 2 2159 Turquoise 0.00173 8 0 2855 Pink 0.0093 7 0 283 Steelblue 6.01∗10−5 6 1 52 Lightsteelblue 1.59∗10−5 4 2 9 Darkturquoise 0.16ns 1 0 38 Orangered 0.33ns 2 0 21 Darkgreen 0.49ns 2 0 86 Cyan 0.52ns 5 0 248 Green 0.98ns 3 0 671 Royalblue 1ns 3 1 63 Lightgreen 1ns 0 1 5 SaddleBrown 1ns 0 1 5 Greenyellow 1ns 0 1 426
Only modules with at least one significant enrichment are presented.1,nsStands for non-significant enrichment.2Number of CW GO terms [Biological Process (BP)
and Cell Compartment (CC)] significantly (p-value< 5%) enriched in each module.
3Total number of genes in the considered module.
were identified. To better illustrate the dynamics of gene expression during internode development within these modules, the expression patterns observed for the internode 12 in the WW treatment of the 2013 trial were used. Cluster C5 presents high expression levels in the very first stage D1. Clusters 1–3 encompass genes that present increases in expression between stages D1–D2 (C1 and C3) and D1–D3 (C2). Clusters 5 and 7 include genes with increasing expression throughout the stages. Cluster C4 presents a decrease in gene expression from D1 to D3 followed by a continuous increase until D5.
A custom list of enzymes annotated as involved in CW establishment was compiled based on previous publications (Supplementary Table S3) and the 30 modules were tested for enrichment in this CW related enzyme list as well as in CW related gene ontology (GO) terms for biological processes (BP) and cellular components (CC) (Table 2 and
Supplementary Table S1).
Six modules, turquoise, yellow, pink, blue, steelblue and lightsteelblue, were significantly enriched in the CW-related enzyme custom list (Table 2 and Supplementary Table S1). The same six modules were also enriched in multiple SCW and general CW related GO terms (CW GO terms) (from 4 to 22 BP GO terms and from 0 to 2 CC GO terms). Six additional modules were enriched in between 1 and 5 BP GO terms related to CW but were not significantly enriched in the custom CW genes (royalblue, green, cyan, darkgreen, orangered, and darkturquoise). Three modules have one enriched CC GO terms related to CW but were not enriched in the custom list of CW genes (saddlebrown, lightgreen, greenyellow) (Supplementary
Table S1). Furthermore, two out of these three last modules
contain very low numbers of genes. Only the six modules that were enriched both in CW GO terms and genes from the custom list were further investigated (Table 2).
The yellow module presents the highest number of enriched GO terms corresponding to general CW (22) and more specific SCW ontology terms with an overrepresentation of pectin, cellulose, xylan, phenylpropanoid and lignin related genes (Table 3). The pink and blue modules are also enriched in SCW GO terms but more specifically in lignin and phenylpropanoid related genes. The turquoise, steelblue and lightsteelblue modules are enriched in pectin, cellulose, xylans and general CW GO terms (Table 3).
In terms of gene expression, the mean expression of genes belonging to yellow and pink modules both within the C2 cluster reached a peak at the D3 stage of the 2013 trial (for internode 12 in the well-irrigated treatment). The maximal expression of other modules enriched in CW GO terms occurs earlier in development. The mean expression of genes belonging to turquoise and blue modules present a maximum expression level at the D1 stage whereas the steelblue and lightsteelblue modules peak at the D2 stage.
Accumulation patterns of SCW components in the internode 12 of the WW of the 2013 field trial are presented in Figure 4B. Xylans and cellulose reach a maximum at the D3 stage, slightly earlier than lignin, a component specific to SCW.
Identification of Hub Genes in the Cell Wall Enriched Modules
Within each CW-related module, highly connected genes were identified using the intramodular connectivity parameter. The top 10 genes for each module are reported in Table 4. With the exception of the lightsteelblue module that contains a low number of genes, the 10 top genes are the same, regardless of whether the correlation threshold is considered or not revealing that the genes harboring the largest numbers of connections are also the ones that harbor the highest correlations with the other genes of the module. Some of these top genes are classified as TF according to their GO term (GO:0003700). These TFs are, Sobic.002G260800 which belongs to the ERF protein family, in the steelblue module, Sobic.004G237300, a TCP TF, in the blue module, and Sobic.003G148600 and Sobic.010G080400, which also both belong to the ERF protein family, in the lightsteelblue module.
There are one additional NAC gene and one additional MYB gene in the top 10 genes of the pink module but they are not annotated with the TF GO term. Sobic.003G035100 (SbNAC75a) is a close homolog of NAC075, a putative regulator of VASCULAR RELATED NAC-DOMAIN PROTEIN 7 (VND7,
Supplementary Figure S4B) which is a master regulator of vessel SCW deposition in Arabidopsis (Endo et al., 2015;Fujiwara and Mitsuda, 2016). Sobic.001G110900 is a homolog of AtMYB52/54, another regulator of SCW (Zhong et al., 2008).
The TCP TF in the blue module is annotated as being involved in flavonoid metabolic processes. Other genes have ontologies related to CW (eight in total) and all five modules have at least one of their top 10 genes annotated as CW related, except the steelblue module.
fpls-11-00224 M ar ch 3, 2020 T ime: 13:13 # 13 Hennet et al. Regulation of Sorghum Stem Composition
TABLE 3 | Enrichment of MYB and NAC bait gene subnetworks and WGCNA modules in GO terms related to SCW and general CW (CW GO terms).
Bait genes Modules
Keywor
d
GO
ID
1
SbNAC80 SbMYB106 SbMYB104 SbNSTb SbMYB83 SbNAC29 SbMYB7 SbMYB92a SbMYB81 SbMYB60b SbNAC58 SbNAC8 SbMYB34 SbMYB89 SbVND7a Yellow Pink Blue Sblue
2 Lsblue 3 T ur quoise SCW GO:0009834 GO:1901347 GO:1901348 GO:2000652 Lignin GO:0046274 GO:1901430 GO:0009808 GO:0009809 CW GO:0052386 GO:0016998 GO:0042546 GO:0042547 GO:0009831 GO:0009664 GO:0042545 GO:0009828 GO:0009830 GO:0071668 GO:0006075 Xylan GO:0045492 GO:1990937 GO:0015790 GO:0042732 GO:0010417 GO:0045493 GO:0010411 Cellulose GO:0030244 GO:0052324 GO:0010215 GO:0052541 Pectin GO:0010400 GO:0045489 GO:0010306 GO:0010246 GO:0010253 GO:1902066 GO:0045490 GO:0052325 GO:0048354 GO:0033481 GO:0019567 GO:0010405 (Continued) Fr ontiers in Plant Science | www .fr ontiersin.org 13 Mar ch 2020 | V olume 11 | Article 224
fpls-11-00224 M ar ch 3, 2020 T ime: 13:13 # 14 Hennet et al. Regulation of Sorghum Stem Composition TABLE 3 | Continued
Bait genes Modules
Keywor
d
GO
ID
1
SbNAC80 SbMYB106 SbMYB104 SbNSTb SbMYB83 SbNAC29 SbMYB7 SbMYB92a SbMYB81 SbMYB60b SbNAC58 SbNAC8 SbMYB34 SbMYB89 SbVND7a Yellow Pink Blue Sblue
2 Lsblue 3 T ur quoise Phenylpropanoid pathway GO:0033587 GO:0019632 GO:0009699 GO:0009805 GO:0009094 GO:0006559 GO:0080088 Flavonoid GO:0009812 GO:0031539 GO:1900384 GO:0010023 GO:0009715 Vessels development GO:0090058 GO:0010089 GO:0010222 Wax GO:0010345 GO:0010143 General information
Number of genes considered 66 63 71 51 70 85 59 83 82 39 30 25 67 28 41 1616 283 2159 52 9 2855
Number of significant GO terms 31 27 31 32 31 16 13 19 15 35 28 16 14 14 15 92 75 105 28 8 205
Module Yellow Yellow Yellow Yellow Yellow Blue Blue Yellow Blue Pink Steelblue Yellow Blue Yellow Yellow
The “Keyword” column corresponds to the aggregation of different GO terms, as described in Biological Process GO ID. Dark gray stands for significant enrichment in the given GO term with p-value< 5%. The total number of genes, total number of significantly enriched GO terms in the subnetwork or WGCNA module considered and module belongings (for bait TF) are given in the general information lines. Colors relate to the number of enriched CW GO terms in each bait gene top subnetwork: red for 12 to 18 GO terms (highly enriched), orange for 6 to 12 GO terms (medium enriched) and yellow for 3–6 GO terms (lightly enriched). Genes with underlined names have never been identified as being involved in SCW regulation in the literature. Additional gene top subnetwork enrichment is provided in Supplementary Table S5 and Supplementary Table S12.1GO terms associated with the GO ID are provided in Supplementary Table S2.2Steelblue module.3Lightsteeblue module.
Fr ontiers in Plant Science | www .fr ontiersin.org 14 Mar ch 2020 | V olume 11 | Article 224
fpls-11-00224 March 3, 2020 Time: 13:13 # 15
Hennet et al. Regulation of Sorghum Stem Composition
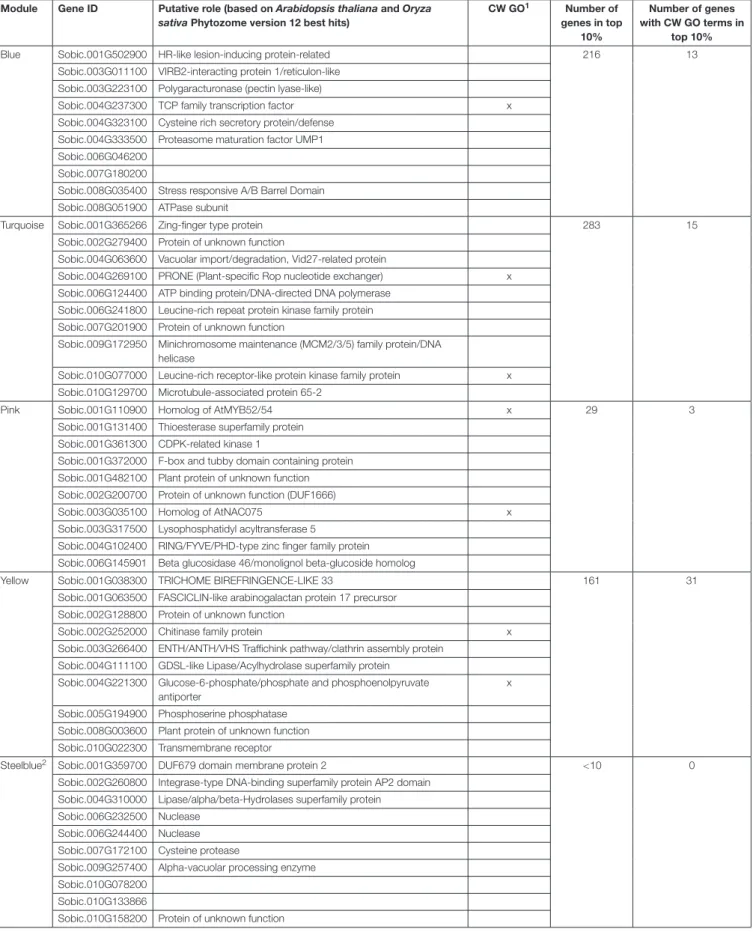
TABLE 4 | Top hub genes in the six cell wall-related modules.
Module Gene ID Putative role (based on Arabidopsis thaliana and Oryza sativa Phytozome version 12 best hits)
CW GO1 Number of genes in top 10% Number of genes with CW GO terms in top 10%
Blue Sobic.001G502900 HR-like lesion-inducing protein-related 216 13
Sobic.003G011100 VIRB2-interacting protein 1/reticulon-like Sobic.003G223100 Polygaracturonase (pectin lyase-like)
Sobic.004G237300 TCP family transcription factor x
Sobic.004G323100 Cysteine rich secretory protein/defense Sobic.004G333500 Proteasome maturation factor UMP1 Sobic.006G046200
Sobic.007G180200
Sobic.008G035400 Stress responsive A/B Barrel Domain Sobic.008G051900 ATPase subunit
Turquoise Sobic.001G365266 Zing-finger type protein 283 15
Sobic.002G279400 Protein of unknown function
Sobic.004G063600 Vacuolar import/degradation, Vid27-related protein
Sobic.004G269100 PRONE (Plant-specific Rop nucleotide exchanger) x Sobic.006G124400 ATP binding protein/DNA-directed DNA polymerase
Sobic.006G241800 Leucine-rich repeat protein kinase family protein Sobic.007G201900 Protein of unknown function
Sobic.009G172950 Minichromosome maintenance (MCM2/3/5) family protein/DNA helicase
Sobic.010G077000 Leucine-rich receptor-like protein kinase family protein x Sobic.010G129700 Microtubule-associated protein 65-2
Pink Sobic.001G110900 Homolog of AtMYB52/54 x 29 3
Sobic.001G131400 Thioesterase superfamily protein Sobic.001G361300 CDPK-related kinase 1
Sobic.001G372000 F-box and tubby domain containing protein Sobic.001G482100 Plant protein of unknown function Sobic.002G200700 Protein of unknown function (DUF1666)
Sobic.003G035100 Homolog of AtNAC075 x
Sobic.003G317500 Lysophosphatidyl acyltransferase 5
Sobic.004G102400 RING/FYVE/PHD-type zinc finger family protein Sobic.006G145901 Beta glucosidase 46/monolignol beta-glucoside homolog
Yellow Sobic.001G038300 TRICHOME BIREFRINGENCE-LIKE 33 161 31
Sobic.001G063500 FASCICLIN-like arabinogalactan protein 17 precursor Sobic.002G128800 Protein of unknown function
Sobic.002G252000 Chitinase family protein x
Sobic.003G266400 ENTH/ANTH/VHS Traffichink pathway/clathrin assembly protein Sobic.004G111100 GDSL-like Lipase/Acylhydrolase superfamily protein
Sobic.004G221300 Glucose-6-phosphate/phosphate and phosphoenolpyruvate antiporter
x
Sobic.005G194900 Phosphoserine phosphatase Sobic.008G003600 Plant protein of unknown function Sobic.010G022300 Transmembrane receptor
Steelblue2 Sobic.001G359700 DUF679 domain membrane protein 2 <10 0
Sobic.002G260800 Integrase-type DNA-binding superfamily protein AP2 domain Sobic.004G310000 Lipase/alpha/beta-Hydrolases superfamily protein Sobic.006G232500 Nuclease
Sobic.006G244400 Nuclease Sobic.007G172100 Cysteine protease
Sobic.009G257400 Alpha-vacuolar processing enzyme Sobic.010G078200
Sobic.010G133866
Sobic.010G158200 Protein of unknown function
(Continued)
fpls-11-00224 March 3, 2020 Time: 13:13 # 16
Hennet et al. Regulation of Sorghum Stem Composition
TABLE 4 | Continued
Module Gene ID Putative role (based on Arabidopsis thaliana and Oryza sativa Phytozome version 12 best hits)
CW GO1 Number of genes in top 10% Number of genes with CW GO terms in top 10% Lightsteelblue3 Sobic.001G080100 <10 2
Sobic.001G304201 LTPL141 - Protease inhibitor/seed storage/LTP family protein precursor
Sobic.003G148600 Integrase-type DNA-binding superfamily protein AP2 domain Sobic.003G432700 Curculin-like (mannose-binding) lectin family protein
Sobic.007G146200 Plant invertase/pectin methylesterase inhibitor superfamily x Sobic.007G214600 Calcium-binding EF-hand family protein
Sobic.009G152600 Pyrophosphorylase 3
Sobic.009G173700 Expansin x
Sobic.010G080400 Integrase-type DNA-binding superfamily protein AP2 domain Sobic.007G214400 Calcium-binding EF-hand family protein
Hub genes have been identified using the intramodular connectivity. For each module, the top 10 hub genes, their putative roles and their annotation with SCW and general CW GO terms (CW GO terms) are given. In addition, the number of 10% top hub genes in each module and the number of these genes with at least one CW GO term are provided. A detailed list of the top 10% of each module can be found in Supplementary Table S10.1“x” means the gene has at least one CW GO term
annotation.2As there are only 52 genes in the steelblue module, top 10% information is equivalent to top 10 genes.3As they are only 9 genes above the correlation
threshold in the lightsteelblue module, we report the top 10 genes without considering the correlation threshold. The two genes above the correlation threshold are indicated in upright font.
In addition to the top 10 genes, the “top 10% genes” of each of the six CW-related modules were also retrieved for further analyses (Table 4 and Supplementary Table S10). SbVND7a belongs to the top 10% gene list of the yellow module which is the one presenting the most CW-related ontologies annotated genes (31). The blue, turquoise and pink modules “top 10% hub gene lists” are composed of between 5 and 10% of genes with GO terms related to CW. The blue module has neither TF annotated genes nor MYB or NAC genes in the top 10% hub genes, and the turquoise module has three MYB genes, none of which are close homologs of MYB genes validated in other species for their role in SCW regulation. There are also two TFs belonging to the GATA and WRKY TF families in the top 10% hub genes of the pink module.
Co-expression Networks of NAC and
MYB Transcription Factors
Among the 257 SbMYB and SbNAC genes included in the phylogenetic analysis, 83 MYB and 86 NAC genes were discarded because of their low expression levels or because they did not show any strong correlation with other genes (Supplementary Table S11). Among these genes, some sorghum homologs of putative key genes based on previous publications were not considered according to their low expression levels (SbSWN6/SbVND4-6c, SbSWN2/SbVND7b, SbVND1-3a,b, SbNAC75c,d,e, SbVNI2a,d,c and SbMYB20/43c, SbMYB69a,b) or a correlation with the other genes lower than the selected threshold (SbMYB20/43a, SbMYB42b, SbMYB4b, SbNAC75b, SbVNI2f and SbMYB60).
Most of the 52 MYB and 36 NAC genes included in the co-expression network analysis belong to the brown (11 MYB and 14 NAC), blue (10 MYB and 3 NAC) and yellow (13 MYB and 9 NAC) modules (Figure 5). The remaining MYB and NAC genes are found in the turquoise, steelblue, and pink modules, but also
in the red, green, and cyan modules. There is no MYB or NAC gene in the lightsteelblue that only contains nine genes.
We used the 88 MYB and NAC genes as bait genes to identify highly co-expressed genes. We chose to extract the list of the top 15 correlated genes with the guide-gene and the top 15 correlated genes of each of those top 15 genes. Theoretically, the list of top subnetwork correlated genes is composed of 241 genes. The lists of top gene subnetworks obtained contained between 22 and 102 genes with an average number of 65.8 genes (Supplementary Table S4). We characterized the GO terms enrichment of these lists and focused especially on CW GO terms (Supplementary Tables S4, S5).
Apart from one gene in the green module, all 30 MYB and 14 NAC genes whose top subnetwork is enriched in GO terms related to CW belong to the module presenting CW and SCW enrichment (either in GO terms or CW related genes). There are 22 TF top subnetworks enriched in CW GO terms in the yellow module, 10 in the blue module, seven in the pink module, three in the turquoise module and one in the steelblue module (Supplementary Table S11). We further investigated TFs whose top subnetworks are enriched in three to 18 GO terms related to CW (39 genes) and classified them into three categories of enrichment: “high” between 12 and 18, “medium” between 6 and 12 and “light” between 3 and 6. All 19 highly enriched TF top subnetworks belong to the yellow module, two medium enriched subnetworks belong to the yellow module, five belong to the blue module, five belong to the pink module and three lightly enriched subnetworks belong to the yellow module, three belong to the blue module, one belongs to the pink module, one belongs to the steeblue module and one belongs to the turquoise module.
Top subnetwork enrichments of every SbMYB and SbNAC ortholog or close paralog of validated MYB and NAC in other species were analyzed. In most cases, homologs’ top subnetworks were enriched in GO terms related to CW or SCW (Tables 1, 4 and Supplementary Table S11).
fpls-11-00224 March 3, 2020 Time: 13:13 # 17
Hennet et al. Regulation of Sorghum Stem Composition
FIGURE 5 | Distribution and number of sorghum NAC and MYB genes in the different modules. Modules enriched in SCW and general CW-related GO terms are highlighted in clear gray. Modules not directly related to cell wall establishment (i.e., brown, cyan, green, and red) are highlighted in darker gray. The main results of the GO term enrichment analysis are provided in the left boxes in addition to their average expression profile in the 2013 field trial experiment.
The top subnetworks of SbNSTb and SbNSTa and SbSNDb and SbSNDa show high enrichments in GO terms specific to lignin biosynthesis and more general SCW ontologies (Supplementary Table S12). The homologs of the Arabidopsis VND1 to VND6 (Supplementary Figure S4B), which are involved in specific vessel SCW deposition, either did not pass the selected thresholds for the expression and correlation levels or presented top subnetworks (SbVND4-6a in the turquoise module and SbVND4-6b in the blue module) only lightly or not enriched in CW GO terms. The top subnetwork of the only one of the two sorghum orthologs of Arabidopsis VND7 that met our selection criteria, SbVND7a, is lightly enriched in ontologies related to CW waxes (suberin, cutin), polyphenolic compounds and pectin.
The top subnetwork of SbVNI2g, one of the seven orthologs of AtVNI2 (Supplementary Figure S4A), a regulator of SCW in Arabidopsis interacting with VND7, is the most highly enriched in CW GO terms along with SbSNDa top subnetwork.
The other major regulator of SCW deposition in Arabidopsis, maize and rice is MYB46 which is functionally redundant with its paralog AtMYB83. In sorghum, one direct ortholog of the redundant AtMYB46 and AtMYB83, SbMYB83 (Figure 3C) was identified belonging to the yellow module. The top subnetwork
of this gene is highly enriched in 12 GO terms related to general CW and SCW GO terms (xylan, and cellulose) and SCW-specific GO terms (Table 3).
SbMYB60 and its paralog SbMYB60b are orthologs of AtMYB58 and AtMYB63. SbMYB60 has been functionally validated for its role in the sorghum lignin pathway (Scully et al., 2016, 2017) but it did not pass our correlation threshold. SbMYB60b is allocated to the pink module, and its top subnetwork is medium enriched in one GO term related to lignin, three GO terms related to phenylpropanoid and two GO terms related to flavonoid biosynthesis.
Downstream SbMYB homolog genes of SCW regulators (Figure 1) are also highly enriched in CW GO terms. The top subnetworks of SbMYB4a, an ortholog of the SCW repressor gene group encompassing AtMYB4, AtMYB7, AtMYB32, and SbMYB61b are both enriched respectively in 18 CW GO terms. And the top subnetwork of SbMYB103 included 17 CW GO terms (Supplementary Table S5).
We also detected enrichment in the top subnetworks of SbMYB and SbNAC genes whose orthologs were not annotated as involved in SCW regulation in any other species. Based on our classification of GO-enrichment level,
fpls-11-00224 March 3, 2020 Time: 13:13 # 18
Hennet et al. Regulation of Sorghum Stem Composition
we identified four SbMYB and one SbNAC highly enriched in CW GO terms (SbMYB17, SbMYB40, SbMYB104, SbMYB106, and SbNAC80); nine SbMYB and one SbNAC moderately enriched (SbMYB7, SbMYB43, SbMYB53, SbMYB76, SbMYB81, SbMYB92, SbMYB92a, b, and c, and SbNAC29); and three SbMYB and three SbNAC genes lightly enriched (SbMYB34, SbMYB55, SbMYB89, SbNAC16, SbNAC28 and SbNAC58) (Table 3 and Supplementary Table S5).
All highly enriched TF top subnetworks allocated to the yellow module are enriched in GO term “plant-type SCW biogenesis,” as well as one lignin process GO term (“metabolic,” “catabolic,” “biosynthesis”), “xylan biosynthetic process” and “cellulose biosynthetic process.”
The nine medium-enriched TF top subnetworks are allocated to the blue, pink and yellow modules, and only two of them are enriched in SCW GO terms. The four in the pink module are enriched in flavonoid and phenylpropanoid GO terms.
None of the lightly enriched TF top subnetworks, which are allocated to the blue, steelblue and yellow modules, is enriched in SCW GO terms. SbNAC8, SbMYB89 and SbVND7a, all in the yellow module, are enriched in wax GO terms.
In the yellow and pink cell wall related modules in Figure 6, the significant contributions of key regulators already highlighted inArabidopsis thaliana together with specific sorghum MYB and NAC were identified. In the yellow module (Figure 6A) the coordinated expressions of 13 MYB and NAC genes for which involvement in cell wall building had already been reported in Arabidopsis together with 5 additional MYB and NAC TF (with cell wall enriched subnetworks) were observed. Similarly in the pink module, the putative key roles of the homologs of AtNAC75, AtMYB58/63, AtMYB52/54, and AtMYB42 (see
Figure 1 in which their roles on cell wall establishment regulation are presented) have been detected together with the coordinated actions of three paralogs of SbMYB92 (for which no functional role linked to the cell wall has been yet reported in Arabidopsis). To reinforce the key roles of these TF, it is interesting to note that for both modules, several genes encoding structural enzymes involved in cell wall establishment and deposition are amongst the highest co-expressed genes with these TFs. It is also interesting to emphasize that 138 and 44 genes in the yellow and pink modules subnetworks have never been related to the SCW synthesis process in the literature to date (Figures 6A,B). The key TF s identified through these targeted enrichment analyses for all the NAC and MYB sorghum genes are available in the
Supplementary Table S11. The homologs of Arabidopsis whose functions in sorghum seem to be concordant in sorghum and Arabidopsis are indicated together with the new sorghum TFs of potential interest.
DISCUSSION
An in-depth understanding of the regulation of stem SCW establishment in cereal crops will contribute to enhancing their adaptation to the expectations of the producers and users and monitoring their adaptation to future environmental constraints.
Ontogenic evolution of the biochemical composition of the sorghum stems has been described previously. Lignocellulosic component accumulations were described from six days before anthesis to the plant physiological maturity (53 days post anthesis), underlying an accumulation of these components before anthesis (McKinley et al., 2016). Characterization of earlier internode developmental stages (i.e., long before anthesis) showed that cellulose and hemicellulose accumulations occur in the first stages of internode development (between 0 and 200◦
C of thermal time cumulated since their elongation’s initiation) whereas lignin accumulation extends up to 400◦
C after elongation’s initiation (Perrier et al., 2017). Internode development was also characterized at the anatomical level allowing the identification of the cell division, cell expansion, and CW establishment steps (Kebrom et al., 2017;
Perrier et al., 2017).
Transcriptomic analyses aiming to identify the genes involved in internode development were performed recently. First, a global sorghum transcriptome atlas was developed taking advantage, among other tissues, of different stem components (internode, pith, and rind) showing that these organs and tissues shared a general transcriptomic profile but also that they diverged significantly from the other samples analyzed (Shakoor et al., 2014). A more specific focus on CW-related genes in sorghum revealed tissue specific expression patterns and responses to abiotic stress constraints (Rai et al.,
2016). However, these analyses were based only on different
seedling organs, and a more detailed study of the kinetics of internode development was needed. The Mullet’s group then made significant contributions to the understanding of internode development and CW deposition. First, analysis of the evolution of the 10th internode’s transcriptome over eight different stages, helped to elucidate the expression patterns of structural genes involved in the different CW component deposition (McKinley et al., 2016). Then, the specific elongation steps of the internode development were described through the analysis of the four apical internode levels (Kebrom et al., 2017). Although previous publications focused their attention on structural genes, this last study also provided a first appraisal of the contribution of TF s to internode elongation and CW deposition.
According to the previous knowledge available on biomass composition establishment in sorghum, the objectives of the present study were to contribute specifically to a better understanding of the SCW establishment and its regulation in sorghum, with a detailed focus on the contribution of the MYB and NAC TF families. To achieve these goals, we first performed gene co-expression network analyses based on an extensive internode sampling scheme over three field trials. Indeed, the construction of co-expression networks has recently emerged as a powerful method to explore high throughput expression datasets and to dissect partially unknown physiological mechanisms (Higashi and Saito, 2013), including SCW establishment (Ruprecht et al., 2011;Hirano et al., 2013a;
Hu et al., 2017;Sibout et al., 2017). We therefore updated the phylogenies of MYB and NAC TF families from nine different species to accurately describe the structures of these gene families