NUCLEAR ENGINEERING
DATA ANALYSIS
-OPERATING CREW CHARACTERISTICS AND INTERACTIONS DURING
STEAM GENERATOR TUBE RUPTURE SIMULATION by
Y. Huang, N. Siu, D. Lanning,and J. Carroll June, 1990
MITNE-290
)
MASSACHUSETTS INSTITUTE
OFTECHNOLOGY
Nuclear Engineering Department Massachusetts Institute of Technology
Cambridge, Massachusetts 02139
N1UCLEAR
?
READING
auLiti
DATA ANALYSIS
-OPERATING CREW CHARACTERISTICS AND INTERACTIONS DURING
STEAM GENERATOR TUBE RUPTURE SIMULATION by
Y. Huang, N. Siu, D. Lanning,and J. Carroll June, 1990
MITNE-290
Prepared for:
Office of Nuclear Regulatory Research United States Nuclear Regulatory Commission
Washington, D. C. 20555
Project Officer: Joel Kramer
1. Abstract
This report provides an analysis of the data collected during a one-month visit to a 2-unit, non-U.S. PWR. The data consist of results from interviews (largely with plant operators and former shift engineers) and from reviews of videotapes covering crew
responses to steam generator tube rupture training exercises. The interviews were aimed at indicating perceptions of individual and group skills. The analysis shows that the interview results are fairly consistent, that the time required to perform key actions does not
generally correlate very well with the team quality ratings obtained from the interviews, and that the team quality ratings obtained from interviews correlate reasonably with ratings of the team performances (during the exercises) developed using the 7-dimension
scale described in PNL-7250.
2. Introduction and Summary
The lead author of this report, Y. Huang, paid a visit to a non-U.S. 2-unit PWR during the month of January, 1990. The primary purpose of the visit was to gather information on crew behavior (e.g., the patterns of communication under a variety of circumstances, methods for group decision making/conflict resolution, adherence to procedures, and cooperation between crew members) relevant to a steam generator tube rupture (SGTR) accident. This report expands upon a brief summary of the visit, reported in Ref. 1.
Data were collected via interview and videotape observation. With the generous cooperation of the utility and the regulatory agency, interviews were conducted of the operators in all ten shifts (some 37 operators in all), five former shift supervisors (three of whom are training supervisors), and an inspector from the regulatory agency. Each interview lasted roughly one hour. The information gathered from the interviews relevant
to this project consists largely of ratings of: a) the technical abilities of the individual crew members, and b) the crew's overall teamwork, as seen by the crew members and by experts (the training supervisors and the former shift engineers).
The videotapes were of steam generator tube rupture (SGTR) training exercises performed by each shift (each videotape also is roughly 1 hour long). This project uses the tapes to characterize the responses of the different crews to the simulated accident (e.g., what procedure step is being followed, and when). It should be noted that the tapes were developed in support of the EPRI program to gather event timing data for the Human Cognitive Reliability (HCR) model; operators were instructed to respond to the accident as
realistically as possible.
Additional details on the plant, operator interviews, and videotaped exercises are provided in Section 3 of this report. Section 4 presents the analysis of the data collected during the trip. The conclusions drawn from the analysis are as follows:
* The data gathered from the interviews exhibit a fair degree of consistency. For example, crew members' ratings of their own technical ability and their crew's teamwork can often be correlated with the ratings provided by experts (the training supervisors and the former shift engineers).
* The time required to perform different key actions (e.g., identify the faulted steam generator) does not generally correlate very well with the crew's technical ability or teamwork rating (as determined by the interview responses).
* The crew performances during the SGTR exercises, as rated by the authors using the 7-dimension scale described in PNL-7250 [2], correlate reasonably well with the experts' teamwork ratings for the crews. However, as with the case of the teamwork ratings, they do not correlate very well with the times required to perform different
actions.
Two comments regarding the data are worth noting. First, although the lead author has participated in previous interviews of power plant crews for the purposes of human reliability analysis (as part of a probabilistic risk assessment study), he has not been
formally trained in human factors research. The questionnaire employed and the interview techniques, therefore, differ somewhat from those generally used by social scientists
interested in individual and group behavior. Second, the 10 videotaped exercises, although extremely valuable, clearly provide a limited sample for drawing general conclusions.
Thus, the data gathered are useful for suggesting potential trends and relationships, but are probably not strong enough to confirm (or deny) detailed hypotheses concerning crew behavior.
It should also be noted that some of the raw data gathered during the trip has been judged to be sensitive by the authors and by the utility. Steps have been taken to allow the use of this information in this report. The ten operating crews, whose self ratings are listed in this report, are randomly ordered. Crew performance times (e.g., the time
required to identify the faulted steam generator) are presented in a rescaled, relative form. In this manner, confidentiality is preserved, yet lessons can still be drawn from the data.
3. Background Information
This section provides additional details on the plant visited, the interview process and on the training exercise videotapes.
3.1. Plant and Control Room Description
The station consists of two identical Westinghouse 3-loop PWR units, each of which is rated at 950 MWe. Each unit is operated by 3 control room operators and several
Equipment Operators(EOs) who are assigned to take care of local activities in the Auxiliary Building, the Turbine Building, the sea water pump house, etc. The three control room operators are the Senior Reactor Operator (SRO) (also called the shift
supervisor), the Reactor Operator (RO), and the Auxiliary Reactor Operator (ARO). The two units share one Shift Engineer (SE) who is in charge of station operation.
Fig. la shows the layout of a unit control room. The SRO is in charge of unit operation; his position usually is between the RO's panels (Nos. 1-3) and the computer printers. The RO is in charge of Panels 1-3, while the ARO is in charge of Panels 4-12.
The primary side controls and indications are located in Panels 4-6. Panel 1 provides redundant primary side controls and indications, and may be described as a "concentrated" version of Panels 4-6. Feedwater (both auxiliary and main feedwater) indicators and control switches are located both in Panels 2 and 7. Only Panel 2 has the main feedwater (MFW) control switches. Other indications and controls of secondary side are located in Panels 3 and 8-12.
Note that the control room layout and division of responsibilities among crew
members differs from that for many U.S. plants. In the latter, one operator typically deals with the primary side of the plant and another deals with the secondary side.
3.2. Interviews
The station's operating crew staff can be divided into 5 groups. Each group consists of one Shift Engineer (SE), two operating crews (consisting of 3 control room operators), and several Equipment Operators (EOs). Interviews were done with all operating crews and SEs. Including two operators in training, the total number of control room operators interviewed was 37.
Each interview of the oprerating crew members lasted from 45 minutes to an hour. Questions were asked involving the individual's responsibilities during normal operation
and a Steam Generator Tube Rupture (SGTR) accident, and the key indications for those two different phases. The interviewees were also asked to rate the technical ability of their fellow crew members, the ratings (in terms of technical ability) that they believe they would receive from their fellow crew members, and the quality of teamwork for their crew.
Five former SROs (3 of them are currently the simulation supervisors) were also interviewed, with each interview lasting from 1 to 2 hours. The interviewees were asked to rate the technical ability of each control room operator and teamwork quality of each control room crew, and to comment on team leadership and on the effectiveness of training for an SGTR sequence.
A single regulatory agency inspector familiar with the station was also interviewed regarding the general tendencies of operator behavior during normal operation.
3.3 Videotape Reviews
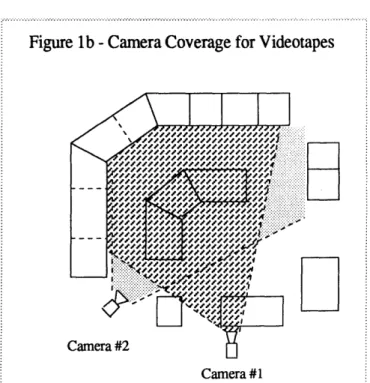
For each of the 10 operating crews (an SRO, RO, and ARO), a taped simulation exercise on a SGTR sequence was reviewed. Each sequence began with a stuck-open
PORV; following restoration, a tube rupture scenario was initiated. Each exercise was terminated when the operators initiated primary system cooldown and depressurization. The key actions during each exercise were generally performed within about 30 minutes. No additional hardware failures were simulated as part of the exercise.
The videotapes were filmed using two cameras (see Fig. 1b). The primary camera was located behind the SRO and covered the majority of the control room; the secondary camera covered the actions of the ARO and RO from the side.
4. Data Analysis
As mentioned in Section 2, three general lessons have been obtained from the data. First, the data gathered from the interviews exhibit a fair degree of consistency. Second, the time required to perform different actions does not generally correlate very well with the crew's technical ability or teamwork rating. Third, crew performances during the SGTR exercises, as rated by the authors using the 7-dimension scale described in
PNL-7250 [2], correlate reasonably well with the experts' teamwork ratings for the crews, but do not correlate very well with the times required to perform different actions. This section discusses the data used to derive each of these lessons in turn.
4.1 Interview Data Consistency
Two of the major objectives of the interviews were to rate the technical abilities of the operators, and to determine the relative confidence that the operators have in their fellow crew members. These ratings were obtained by direct questioning of the operators,
their Shift Engineers, and a set of five experts (Training Supervisors and former Shift Engineers), regarding the "Technical Ability" (TA) of the individual operators and the crew as a whole, and the crew's "Teamwork Quality" (TQ). To test the reliability of the data, the relationships between a number of the variables are explored.
For the sake of brevity, the following discussion uses the following notation for the different data gathered:
Variablerater
where the variables are
C-TA
-SRO-TA
-RO-TA
-ARO-TA
-C-TQ
-and the raters are
exp se sro ro
aro
For the case
crew technical ability SRO technical ability RO technical ability ARO technical ability crew teamwork quality
- "experts" (the training supervisors and retired SEs)
- the current shift engineer for a group/crew (SEs)
- the senior reactor operator
- the reactor operator
- the auxiliary reactor operator
where the operators are asked to provide the ratings of their personal technical ability they believe that their fellow crew members would assign them, we use the notation
Variableselfraterrater
For example, SRO-TAsroaro represents the technical ability rating that an SRO believes he would receive from his ARO.
To investigate the degree of consistency within the data, we look at five sets of data comparisons:
1) C-TQexp vs. C-TQse, i.e., a comparison of teamwork quality ratings by two sets of assessors familiar with the crews.
2) Two comparisions of teamwork quality ratings (by experts) versus technical ability ratings (also by experts):
a) C-TQexp vs. SRO-TAexp
b) C-TQexp vs. a weighted sum of SRO-TAexp, RO-TAexp, and ARO-TAexp These test if the experts distinguish between "teamwork quality" and "technical ability".
3) Two comparisons of teamwork quality ratings (by crew members) with those provided by the experts:
a) (C-TQsro + C-TQsro + C-TQsro)/3 vs. C-TQexp
b) C-TQmax vs. C-TQexp, where "max" denotes that the rater has the highest technical ability in the crew. Operationally, this is the operator in a given crew whose technical ability is furthest above the average for all operators in his class (i.e., SROs are compared with the average SRO, ROs with the average RO, etc.).
These tests determine if the operators and the experts view teamwork quality in a similar manner.
4) A comparison of individual technical ability (as rated by experts) with individual technical ability (as rated by the operators). This is based on two sets of three variables:
{(SRO-TAexp - SRO-TAexp), (RO-TAexp - RO-TAexp), (ARO-TAexp - ARO-TAexp)}
and
{[(RO-TArosro - SRO-TAro) + (ARO-TAarosro - SRO-TAaro)],
[(SRO-TAsroro - RO-TAsro) + (ARO-TAaroro - RO-TAaro)], [(SRO-TAsroaro - ARO-TAsro) + (RO-TAroaro - ARO-TAro)]} To explain these comparisons, consider the first variable in each set. The first variable in the first set represents a scaled SRO technical ability (as rated by experts), where the overscored term (SRO-TAexp) represents the average technical ability for all SROs (as rated by the experts). The first variable in the second set represents the confidence in an SRO 's technical ability as expressed by his fellow crew members. The first term (in parentheses) is the difference of the rating the RO believes he would receive from the SRO and the rating of the SRO given by the RO. The second term is a similar difference, but done for the ARO. This comparison checks the degree of consistency between the judgments expressed by the crew and by the experts.
5) A comparison of scores derived from the experts' qualitative assessment of the leadership skills of the SRO and the overall teamwork score.
Table 1 compares the teamwork quality ratings of the crews, as provided by the "experts" and by the current SEs (the former ratings represent averages of the ratings provided by all five experts). It can be seen that for three of the five groups, the relative orderings of each crew are in agreement. For Group 5, the SE assigns the same rating, whereas the experts believe that Crew 7 is somewhat better (the margin of 6.1 points is not very large, compared with the difference between the highest and lowest rated teams). The
assessment of the SE for Group 2 does not match the expert's judgment. (Unfortunately, steps were not taken to ensure that each SE used the same scale to rate the crews;
therefore, the data for the different groups are not combined, as done in the following cases.)
Table 2 shows the technical ability rating for each operator, the average of these scores for type of operator, and the crew's overall teamwork quality, as rated by the experts. Each rating is an average over all of the experts' scores. Analysis of the data shows that there is strong correlation between the experts' ratings of technical ability and their ratings of teamwork quality. For example, Line 1 of Table 3 shows that the techical ability of the SRO (SRO-TAexp) correlates well with the crew teamwork quality
(C-TQexp). Figure 2 shows a scatter plot of SRO-TAexp vs. C-TQexp. It can be seen that these two variables appear to be nearly identical (the data points fall roughly on a 450
line). It is interesting to observe that, as shown in the second line in Table 3, the maximum correlation (r = 0.96) between C-TQexp and a weighted sum of SRO-TAexp, RO-TAexp, and ARO-TAexp is obtained when
weighted sum = 0.50*SRO-TAexp + 0.35*RO-TAexp + 0.15*ARO-TAexp Although the weights are based on a small sample, they may indicate the relative importance of each crew member, in the eyes of the experts.
These results indicate that the experts, taken as a group, consistently relate "teamwork quality" and "technical ability".
In the next comparison, we compare the perceptions of the crew with those of the experts. Table 4 presents the ratings of crew technical ability and teamwork quality
(C-TA and C-TQ) as rated by the crew members. Line 4 of Table 3 shows that the correlation between the teamwork quality (the average of the crew members' scores) and the expert-rated teamwork quality is fairly low. On the other hand, Line 6 shows that the teamwork ratings given by the "best" operator in the crew compare much better with those provided by the experts. In this case, the best operator is the one whose technical ability,
as rated by the experts, is furthest above the average for all comparable operators. Thus, for example, the ARO is the best operator in Crew #1, since Table 2 shows that
ARO-TAexp - ARO-TAexp > RO-TAexp - RO-TAexp
> SRO-TAexp - SRO-TAexp
The final data comparison also considers the perceptions of the crew with those of the experts. Each crew member was asked to score his "confidence" on each of his fellow crew members (i.e., to rate their technical ability), and to provide the score he thinks the other crew members would give him. The data obtained are shown in Table 5. For example, the SRO of Crew #1 thinks that the RO will give him a score of 85, whereas he himself scores the RO at 80.
It can be seen that these scores can be used to indicate the confidence that other members of the crew have in a given operator. Consider again the SRO of Crew #1. Measuring the relative confidence that the RO has in the SRO by the difference
RO-TArosro - SRO-TAro = 95 - 85 = +10
and the relative confidence that the ARO has in the SRO by the difference ARO-TAarosro - SRO-TAaro = 70 - 92 = -22
the relative confidence in the SRO as expressed by the members of his crew can be measured by the sum of these scores: 10 - 22 = -12. To compare this confidence rating with the rating given by the experts, we note that
SRO-TAexp - SRO-TAexp
indicates the relative ability of the SRO (as compared with the other SROs) as judged by the experts. The average SRO score is subtracted to make the score more comparable to the RO and ARO scores.
Table 6 shows the crew confidence and the technical ability scores for each operator, and the correlation between these variables for each operating crew. For six out of the ten crews, the crew judgments correlate reasonably well with those of the experts. In the most extreme of the other four cases (Crew 3), the ordering provided by the crew opposes that provided by the experts. In this crew, the ARO is very highly rated by the experts, but does not reflect this in his own scores (see rows 10-12, column #3, Table 5), possibly reflecting his official status within the crew. Further, the SRO believes that the crew members have good confidence in him, yet he is not highly rated by the experts.
In a number of other cases, some of the operators assign uniform scores for their fellow crew members and for themselves, possibly because they may not wish to reveal their beliefs on the subject. In the case of Crew 5, the responses are all uniform, and no correlation with expert opinion can be shown.
strong. Furthermore, it should not be forgotten that the correlation coefficients are computed on the basis of only three data points. Nevertheless, these results appear to indicate that the crew opinions are somewhat consistent with those of the experts.
As a final consistency check, we developed a rating scale for SROs based on qualitative comments provided by the experts. Each expert was asked to provide qualitative comments on each SRO. The qualitative were categorized into four classes: relation with crew members - the leader/member relationship (LM), personality (P), technical (T), and leadership (L). Each comment is quantified by assigning a score
(ranging from -2 to 2) according to its strength and positiveness/negativeness. For
examples, the comment "willing to learn" will score +1 in technical and "often complains" will score -1 in personality.
Table 7 shows the rating for each SRO. The correlation between the cumulative scores (the sum of the four category scores) and the experts-rated teamwork quality (C-TQexp) is 0.54. The correlation between the total scores and experts-rated technical abilities of the SROs (SRO-TAexp) is 0.73. These data and results indicate that the expert quantitative judgments regarding the SRO are fairly consistent with their qualitative comments, but that the non-technical comments do not seem to translate well into crew teamwork ratings. This may mean that the scoring system used is not representative of that used by the experts, that they do not consider all of the above factors when assessing teamwork quality, or that there are a number of other important factors not queried that have an impact on teamwork quality.
In summary, the data comparisons seem to indicate that the results from the various interviews exhibit a fair degree of consistency. The Shift Engineer ratings correspond with those of the "experts" (the Training Supervisors and former Shift Engineers), the expert ratings are internally consistent, and the crew ratings correlate, to some degree, with the expert ratings. However, the correlations are often not very strong, and are generally based on a very limited set of data points. Further, there are some inconsistencies (e.g., the above weak correlation between non-technical scores and teamwork quality); these require further investigation for resolution.
4.2 Correlation Between Teamwork Quality and Time
At first glance, it might be expected that the operating crews teams more highly rated by the experts (the training supervisors and former SEs) in terms of teamwork quality will be the quickest to diagnose the cause of an accident and to perform required
videotapes are correlated against the crew teamwork quality (C-TQexp). (As shown in the preceding section, C-TQexp correlates reasonably well with a number of other observed variables.) The times are as follows:
- time to diagnose the accident as an SGTR scenario (Ti)
- time to identify the faulted steam generator (T2)
- time to isolate the faulted steam generator (T3)
- time to initiate the SGTR procedure (T4)
- time to cool down and depressurize the primary side (T5)
Data for T and T2 were developed based on an analysis of the dialog among operators
during the simulation. Data for T3, T4 and T5 were directly observed from the videotapes.
A scatter plot showing a rescaled T1,
T = T, - T1 min
1 T-7 max - 1,min
is presented in Fig. 3. This variable is the only one to correlate reasonably well with the crew teamwork (r = -0.68). Table 8 shows that the other times do not correlate well; indeed, T2 shows a slight positive correlation with teamwork quality (r = 0.21)!
Clearly, the experts rating of teamwork quality includes other factors other than the speed at which the crew performs the necessary tasks. This is addressed in the next
section.
It should also be pointed out that, lacking a dynamic model for operators, it is difficult to determine what an optimal crew performance (from the standpoint of risk minimization) should be. Therefore, the data gathered in this trip cannot yet be used to determine if the experts' judgments regarding teamwork quality reflect those factors consistent with risk minimization.
The lack of correlation between most of the Ti and the expert ratings is interesting because time plays a crucial role in many current human reliability assessments. As a caveat to this observation, it should again be emphasized that the sample is small; further, teamwork quality may work in concert with other "performance shaping factors" to affect event timing (as visualized in the SLIM model [3]). Nevertheless, the data indicate that
teamwork quality may not be the key performance shaping factor in determining event timing.
4.3 Correlation of PNL Scores With Teamwork Quality
As pointed out in the preceding section, the timing of key events does not correlate well with the experts' ratings of teamwork quality. It is of interest to see if alternate measures of team performance during the exercises do correlate.
PNL-7250 [2] describes a set of seven "behaviorally anchored team performance rating scales." These scales measure performance along seven dimensions: two-way communication of objectives/plant status, resource management, inquiry, advocacy, conflict resolution and decision making, stress management, and team spirit. Team performance along each dimension is rated anywhere from 1 to 7, where 4 represents the
average performance level (examples used to scale the ratings are given in Ref. 2 for each dimension).
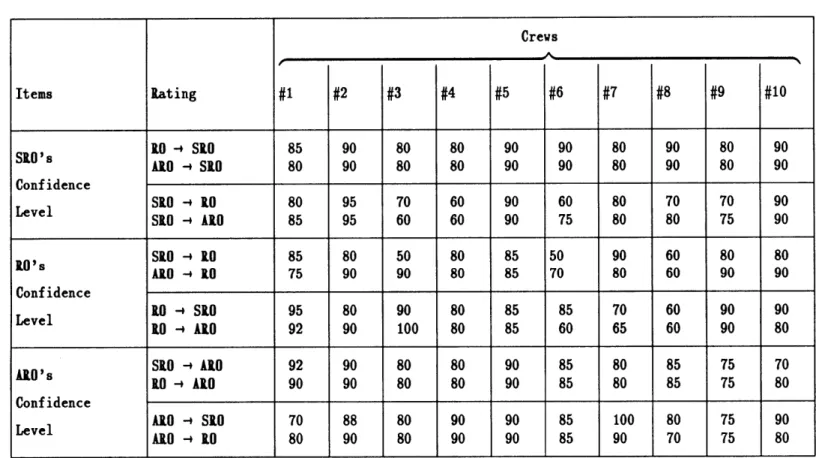
Table 9 provides the ratings of each crew, assessed by the authors, for their performance during the SGTR simulation. Note that if any item is not observed we assigned the average value (i.e. 4) to that item. These items are denoted by an asterisk in Table 9.
The correlation between the total scores (sum of all items for a crew) and
experts-rated teamwork quality (C-TQexp) is found to be 0.77. Thus, the PNL scale, which is based upon observed team performance, appears to be consistent with the judgment of experts (which rates the crew for their performance over a wide range of possible scenarios). Note that, as in the case of the expert-rated teamwork quality, the scores in Table 9 do not correlate well with most of the event times (Ti through T5).
References
1) N. Siu, "A Systems Model for Dynamic Human Error During Accident Sequences," First Progress Report, Grant NRC-04-89-356, Department of Nuclear Engineering,
M.I.T., February 1990.
2) J.C. Montgomery, et al, "Team Skill Evaluation Criteria for Nuclear Power Plant Control Room Crews," draft report, PNL-7250, Pacific Northwest Laboratory, March 1990.
3) D.E. Embrey, et al, "SLIM-MAUD: An Approach to Assessing Human Error Probabilities Using Structured Expert Judgment," NUREG/CR-3518, 1984.
Table 1. Crew Teamwork Quality (C-TQ) Rated By Experts and Shift Engineers (Group,Crew) Rater 1,1 1,4 2,6 2,5 3,8 3,2 4,9 4,3 5,7 5,10 Experts 67.3 71.7 70.0 80.5 87.1 65.9 87.8 71.7 96.7 90.6 Shift 80 85 85 85 80 70 80 70 85 85 Engineer I
Table 2. Expert Ratings of Individual Operator Technical Abilities and Crew Teamwork Quality
Note: Experts consist of 3 training supervisors and 2 former shift engineers. The score shown is the average for
Table 3. Correlation of Crew/Individual Ratings with Crew Teamwork Quality
Rated by Items Correlation
SRO's technical ablity (SRO-TAexp) 0.81
Experts
Weighted sum of crew members' technical abilities 0.96
(0.5 * SRO-TAexp + 0.35 * RO-TAexp + 0.15 * ARO-TAexp)
Equal-weighted sum of crew members' grades for crew's technical 0.31
ability (C-TAsro + C-TAro + C-TAaro)3
Crew Members Equal-weighted sum of crew members' grades for crew's teamwork 0.38
qualities (C-TQsro + C-TQro + C-TQaro)/3
Highest-rated member's grades for crew's technical ability 0.73
Table 4. Crew lembers' Rating of Crew Technical Ability (C-TA) and Teamwork Quality (C-TQ)
Crews Average (p) and
Standard Deviation (o) Items later #1 #2 #3 #4 #5 #6 #7 #8 #9 #10 SRO 90 80 65 85 90 58 70 80 80 85 =78.4 o= 10. 7 Crew Technical 10 80 80 70 75 80 61 75 80 75 85 = 76.1 = 6.7 Ability (C-TA) AID 60 65 50 80 80 70 75 80 60 80 = 10.8 SRO 80 92 60 80 90 58 70 85 85 85 =78.5 = 11.9 Crew Teamwork 10 80 80 60 70 85 80 80 80 60 85 = 76.0 0= 9.4 Quality (C-TQ) ARO 65 65 50 85 90 70 85 90 80 70 = 75.0 o= 13.1
Table 5. Crew Members' Relative Confidence Levels
Crews
Items Rating #1 #2 #3 #4 #5 #6 #7 #8 #9 #10
'O -+ SRO 85 90 80 80 90 90 80 90 80 90
SI0's AID -+ SRO 80 90 80 80 90 90 80 90 80 90
Confidence SRO -+ 1O 80 95 70 60 90 60 80 70 70 90 Level SRD -+ ARD 85 95 60 60 90 75 80 80 75 90 ]t's SRO -4 O 85 80 50 80 85 50 90 60 80 80 ARO -4 O 75 90 90 80 85 70 80 60 90 90 Confidence 10 - SKO 95 80 90 80 85 85 70 60 90 90 Level - A10 92 90 100 80 85 60 65 60 90 80 SKO - AD 92 90 80 80 90 85 80 85 75 70 AiD's 0-4 AiO 90 90 80 80 90 85 80 85 75 80 Confidence AIO - SRO 70 88 80 90 90 85 100 80 75 90 Level AD -+ O 80 90 80 90 90 85 90 70 75 80 I-J U,
Table 6. Correlation Between Expert lating of Individual Technical Ability and Crew Member Relabive Confidence
Crews
Items #1 #2 #3 #4 #5 #6 #7 #8 #9 #10
Expert Rating
of Technical S10 -14.1 -13.5 -6.9 -4.3 -1.1 3.6 4.1 7.7 8.6 15.7
Ability (linus 10 -10.7 -0.7 -1.5 4.6 5.3 -13.4 19.3 2.2 2.6 -7.4
Average for All ARD 6.9 -0.7 14.9 -12.4 -8.4 -3.8 -4.4 0.6 8.9 -1.1
Operators) Confidence Level
of Team Members SRO -12 -2 40 10 0 35 0 -5 10 30
in Individual 10 -15 5 -10 -10 0 -30 10 -35 -10 0
Operator (Sum) ARO 22 5 -10 -20 0 -25 -15 -10 -5 -10
Table 7. SIO Scores Based on Expert Comments Crews Item #1 #2 #3 #4 #5 #6 #7 #8 #9 #10 Leader--ember lelationship 4 -2 2 1 1 3 3 -1 2 2 (LI) Personality -1 0 0 -2 -1 1 1 -1 -1 -1 (P)__ _ __ _ _ __ _ _ _ _ _ __ _ _ _ _ _ Technical Ability -3 -2 0 1 -2 0 0 0 1 3 (T) Leadership -1 -3 -3 0 1 1 0 0 0 2 (L)II Total -1 -7 -1 0 -1 5 4 -2 2 6
Table 8. Correlation of Event Times with Crew Teamwork Quality (C-TQexp)
Judged from Items Correlation
Dialog among Time to diagnose SGTR (TI) -0.68
Operators during
Simulation Time to determine which S/G is faulted (T2) 0.21
Observation Time to isolate the faulted S/G (T3) -0.13
of
Simulation Time to initiate SGTR procedure (T4) -0.16
Exercise
Table 9. Crew Performance Scores Based on Scales from PNL-7250 [2] Crews Item #1 #2 #3 #4 #5 #6 #7 #8 #9 #10 Two-Way Communication of 5 3 2.5 5 5 3 5 5 5 4 Objectives/Plant States Resource Management 5 4 4 3 4 4 5 4.5 3 4 * * * * * * Inquiry 3 4 2 4 4 4 4 4 4 4 Advocacy 3 5 4 4 3 4 4 5 4 3
Conflict lesolution and 3 4 4 4 3 4 4 4 4 4
Decision laking
Stress Management 5 2 4 3 4 4 3 5 5.5 4
Team Spirit 3 2 3 4 4 3 5 5 5.5 5
Total 27 24 23.5 27 27 26 30 32.5 31 28
*
HVAC Panel#13 Fre Panel #14 Line Computer Printer Typewriters
Figure la -Control Room Layout
... ...
Figure lb - Camera Coverage for Videotapes
road or drop do"If drop door jr.00.10.0POP or of afe.100fif or or Aeof drop do /.fl:::
of or or let-11 IFJP do Jr., ad or or dr old, or or do or do do or or or or or or do . do or or of of do do or or oPof 'Fordfor 'P. . d. .0 .Jr drdr:PX...... JrJrjfP J., OF 000010114fe drore., 'PoPor or 11 OF dreedf., 414I.Ofor
of "Of or do of do do or or do or J *. Of of d r of .df.,e of or 0 .-. ;,
or
JoIrdrdo JP do of of or or IF..e# .1.1 door
.1 of off der dolor 11.1
der der der der J'Jeo ded, dredredow 4f.14001
:: .- Odporof dropdrifir droll
.coddlopor4peopoPoldf ordropledp opird O'd door vor if OF do drofJo If Camera #2 Camera #I ... ... ...
60 SRO-TAexp 100
Figure 2 - Scatter Plot of Crew Teamwork Quality (C-TQexp) Versus SRO Technical Ability (SRO-TAexp)
100
60
0.0 1.0
Figure 3 - Scatter Plot of Crew Teamwork Quality (C-TQexp) Versus Rescaled Time to Diagnose SGTR (T*) 100
QY
60


![Table 9. Crew Performance Scores Based on Scales from PNL-7250 [2] Crews Item #1 #2 #3 #4 #5 #6 #7 #8 #9 #10 Two-Way Communication of 5 3 2.5 5 5 3 5 5 5 4 Objectives/Plant States Resource Management 5 4 4 3 4 4 5 4.](https://thumb-eu.123doks.com/thumbv2/123doknet/14536957.534886/20.1188.115.931.165.748/performance-scores-scales-communication-objectives-states-resource-management.webp)