HAL Id: hal-03047327
https://hal.archives-ouvertes.fr/hal-03047327
Submitted on 8 Dec 2020HAL is a multi-disciplinary open access
archive for the deposit and dissemination of sci-entific research documents, whether they are pub-lished or not. The documents may come from teaching and research institutions in France or abroad, or from public or private research centers.
L’archive ouverte pluridisciplinaire HAL, est destinée au dépôt et à la diffusion de documents scientifiques de niveau recherche, publiés ou non, émanant des établissements d’enseignement et de recherche français ou étrangers, des laboratoires publics ou privés.
Flow rate and low hematocrit measurements for in-vitro
blood processing with Doppler ultrasound
Baptiste Pialot, Jeremie Gachelin, Tanter Mickael, Jean Provost, Olivier
Couture
To cite this version:
Baptiste Pialot, Jeremie Gachelin, Tanter Mickael, Jean Provost, Olivier Couture. Flow rate and low hematocrit measurements for in-vitro blood processing with Doppler ultrasound. IEEE Transactions on Ultrasonics, Ferroelectrics and Frequency Control, Institute of Electrical and Electronics Engineers, 2020, 67 (7), pp.1293-1302. �10.1109/TUFFC.2020.2969080�. �hal-03047327�
Abstract—In-vitro techniques for processing of flowing blood and its components have
recently emerged from microfluidics. The blood flow rate and hematocrit are two keys parameters to monitor for guaranteeing the reliability of these techniques. But, there is a lack of monitoring methods adapted to low flow rates and small tubing. In this study, we exploit minimization approaches of continuous Doppler measurements to survey blood flow rate. Combined with a packing factor model, we also estimate hematocrit from the Doppler spectrum. The presented method is implemented with a CW Doppler probe mounted on a 3D-printed support. Accuracy of flow rate was measured in a range from 0.5mL/min to 1.5mL/min. For each of 4 different blood bags, hematocrit in a range under 8% was estimated from Doppler spectrum using a packing factor model derived from the other three bags. Flow rate estimation shows a mean measurement error under 3% for a measurement time of 2s. The mean error is still under 5% for a measurement time of 0.5s. Hematocrit estimation for the 4 blood bags shows errors of 1.4, 1.1, 0.67 and 0.70 %Hct for a measurement time of 5s. The versatility and simplicity of the method make it highly valuable for in-vitro blood processing, in particular for low hematocrit blood fractionation techniques derived from microfluidics, as it can be performed through sterile tubing.
I - INTRODUCTION
Recently, microfluidics has emerged as a novel technology potentially capable of improving conventional methods in blood fractionation, handling and filtration [1]–[3]. A significant part of these technologies operate with diluted blood, below physiological hematocrit values. For being fully operational, employed devices have to be maintained at a constant flow rate with a high accuracy. Also, measuring the hematocrit in such devices without extracting additional blood samples is of a great interest for monitoring their effectiveness and stability. Currently, most flow meters designed for in-vitro blood circuits techniques such as dialysis or heart-lung machines are based on ultrasonic [4], [5] and electromagnetic [6], [7] methods. Optical methods have also been developed [8], [9]. However, the slow flow rates and narrow tubing used in microfluidic-derived blood processing devices are outside the scope of most available commercial flow-meters. Among others, we can cite high-throughput acoustophoresis blood fractionation chips, with flow rates that from
Flow rate and low hematocrit measurements for
in-vitro blood processing with Doppler
ultrasound
Baptiste Pialot12, Jérémie Gachelin2, Mickael Tanter1, Jean Provost3*, Olivier Couture1*
*contributed equally
1 ESPCI, CNRS, INSERM, PhysMedParis, Paris, France 2 Aenitis Technologies, Paris, France
a few hundred 𝜇L/min to a few mL/min, are now developed aiming at a clinical use [10]–[12]. Moreover, in acoustophoresis and in blood fractionation in general, the hematocrit is a direct indicator of the blood fractionation efficiency.
In comparison to optic and electromagnetic methods, ultrasonic methods have the combined advantages of being biocompatible, non-invasive and cheap while dealing with a relatively simple physical framework. More importantly, ultrasound waves preserve their coherence while propagating through tissue and can thus measure flow in optically opaque fluids such as blood. For in-vitro blood flow, they consist mainly in two distinct approaches: the transit-time method and the Doppler method. Whereas the transit-time method is more frequently used in-vitro, Doppler ultrasound is widely used in vivo [13], [14], which has led to a wide gamut of Doppler systems potentially usable in-vitro [15]–[17]. However, most of these systems have not been optimized for an in-vitro environment or have been limited to relatively large flow rates [5], [18].
From a physical point of view, the ultrasonic Doppler power spectral density (PSD) of blood flow is a continuous distribution of frequencies arising from the Doppler effect due to a continuous distribution of velocities [19], [20]. For the flow rate of a stationary, fully developed and laminar blood flow in a cylindrical tube, the corresponding mean velocity is half of the peak velocity. With the constant cross-section area of the tube, estimating the blood flow rate is thus equivalent to finding the maximum frequency of the Doppler PSD. However, this measurement is not straightforward due to intrinsic spectral broadening [21]. As this phenomenon is the combination of several effects coming from different sources (finite dimension of the transducer, focusing, transit-time of the scatterers), its understanding for proper peak velocity estimation remains complex [22]. Thereby, multiple estimators that are robust to spectral broadening for the Doppler maximum frequency have been proposed [23]– [25]. Recently, Vilkomerson et al. proposed a new theoretical model for the Doppler PSD that provides a better understanding of the position of the maximum Doppler frequency in the Doppler spectrum [26]. This model has been shown to accurately predict the maximum Doppler frequency of a fully insonified laminar blood flow.
Moreover, ultrasound backscattered intensity is correlated to blood hematocrit [27]. Hence, besides the frate measurement, Doppler ultrasound is a potential simple and low-cost alternative to existing methods such as impedance spectroscopy [28] or optical methods [29], [30] for directly measuring hematocrit without opening the blood circulation. To our knowledge, there are relatively few studies focused on ultrasound-based hematocrit measurement. Secomski et al. [31] showed that ultrasonic attenuation in an artery is a function of hematocrit. Franceschini and Guillermin [32] used an inverse formulation of a backscattering coefficient (BSC) model for determining the concentration of a tissue phantom. In the Rayleigh scattering regime, the BSC of blood follows a non-linear relationship with hematocrit consisting in a quasi-linear slope that peaks before slowly decreasing [33], [34]. Notably, it was shown that the BSC of non-aggregated porcine and bovine blood peak around 13% hematocrit at a frequency of 7.5 MHz [35]. For modeling this non-linearity, a parameter called the packing factor has been extensively used [35]–[37]. In these studies, the packing factor was used to fit theoretical curves to experimentally measured BSC. Also, the packing
factor has been used for modeling the Doppler signal coming from blood [38], [39]. A simplified expression of the Doppler PSD using a packing factor has been thus developed by Bascom and Cobbold [40]. The main limitation of such a model is to not take into account the shear-rate dependent aggregation tendency of human red blood cells. More precisely, it is known that red blood cells aggregation decreases with increasing shear rate [41], [42]. Thus, more elaborate models have been developed since for characterizing the scattering of ultrasound by human blood [43].
In this study, we present a novel Doppler ultrasound method for non-invasively measuring in-vitro blood flow rate and hematocrit. The method has been designed for the low flow rate and hematocrit ranges encountered in blood processing devices derived from microfluidics. For reaching a high accuracy for flow rate measurement, we use the theoretical model from Vilkomerson et al. [26] in order to reduce the Doppler measure to a straightforward minimization problem. The hematocrit measurement is also performed from Doppler signals using a simplified packing factor model derived from the study of Bascom and Cobbold [40] that we show to be reproducible for different blood samples. The method is applied on a simple and low-cost dual-probe continuous Doppler apparatus with blood flowing in a sub-millimeter silicon tube. We first detail the theory involved in our measurement method in section II. After describing the experimental system and acquisition (section III), we demonstrate in section IV its accuracy for the measurement of flow rates rate from 0.5 mL/min to 1.5mL/min on one blood bag. This flow rate range is based on the one used for the acoustophoretic blood fractionation device presented by Bohec et al. [11]. Furthermore, we show on four different blood bags the system capacity to measure hematocrit. For each blood bag, hematocrit measurement is performed in a range under 8%, using a parameterization of the packing factor model estimated from the three other bags. This hematocrit range also corresponds to the one used by Bohec et al. [11].
II - Theory
We consider a laminar and steady blood flow in a medical tube with a constant radius
R. The blood flow rate is imposed at the entrance of the tube. The laminar blood flow exhibits
an ideal parabolic velocity profile characterized by the following equation: 𝑣(𝑟) = 𝑣𝑚𝑎𝑥(1 − 𝑟
2
𝑅2) (1)
Where 𝑣(𝑟) is the velocity corresponding to the radial position 𝑟 in the tube and 𝑣𝑚𝑎𝑥 is the
peak velocity of the parabola.
The blood flow is assumed to be fully and uniformly insonified with a Doppler dual-probe consisting of an emitting and a receiving transducer. It is assumed that the flow is fully-developed within the ultrasound beam. The peak velocity 𝑣𝑚𝑎𝑥 is related by the Doppler
equation to the peak Doppler frequency 𝑓𝑚𝑎𝑥 of the Doppler PSD. If the internal angle
𝑣𝑚𝑎𝑥 = 1 2𝑐
𝑓𝑚𝑎𝑥
𝑓𝑒𝑐𝑜𝑠𝜃 (2)
Where 𝑐 is the speed of sound in blood, 𝑓𝑒 is the frequency of the emitting transducer and 𝜃
is the Doppler angle between the probe and the tube. The flow rate Q is related to 𝑣𝑚𝑎𝑥 by 𝑄 =
1 2𝜋𝑅 2𝑣 𝑚𝑎𝑥. Substituting in equation (2): 𝑄 = 𝜋𝑅 2𝑐 4 𝑓𝑚𝑎𝑥 𝑓𝑒𝑐𝑜𝑠𝜃 (3)
We will now use the theoretical model for the Doppler PSD developed by Vilkomerson et al. [26]. This model consists of dividing the velocity profile into M concentric shells having M velocities. The shells are then separated into two groups based on their velocity values. The “slow” group contains the shells with a velocity such that corresponding red blood cells cannot cross the whole ultrasound beam during the acquisition of the Doppler signal. The “fast” group contains all the others shells. From this dichotomy the model has the following general expression: 𝐷𝑃𝑆𝐷 = ∑ 𝑆𝑆𝑚+ ∑ 𝑆𝐹𝑚 (4) 𝑀−1 𝑚=𝑚𝑡 𝑚𝑡−1 𝑚=0
Where 𝐷𝑃𝑆𝐷 is the theoretical Doppler PSD, 𝑆𝑆𝑚 is the spectral contribution of the slow
shells, 𝑆𝐹𝑚 is the spectral contribution of the fast shells and 𝑚𝑡 is the index of the first fast shell. The detailed expressions for 𝑆𝑆𝑚 and 𝑆𝐹𝑚 are:
𝑆𝑆𝑚= 𝜌𝑚(𝐴 − 𝑣𝑚𝑇0)𝑃(𝑓𝑚, 𝑁, 𝑁) + 2𝑣𝑚𝜌𝑚𝑇0 𝑁 ∑ 𝑃(𝑓𝑚, 𝑗, 𝑁) 𝑁−1 𝑗=1 (5) 𝑆𝐹𝑚 = 𝜌𝑚𝐴 ( 𝑇0 𝑡𝑡𝑚 − 1) 𝑃(𝑓𝑚, 𝑤𝑚, 𝑁) + 2𝜌𝑚𝐴 𝑤𝑚 ∑ 𝑃(𝑓𝑚, 𝑗, 𝑁) 𝑤𝑚−1 𝑗=1 (6)
Here 𝜌𝑚 is the red blood cells density in the m-th shell, 𝑣𝑚 is their velocity and 𝑓𝑚 is the associated Doppler frequency calculated with the Doppler equation. A is the width of the emitter aperture, 𝑇0 is the acquisition time of the Doppler signal and N is the number of
samples on which the Doppler PSD is estimated. The spectral contribution of the 𝑆𝐹𝑚 shells
corresponds to red blood cells staying in the ultrasound beam during the time 𝑡𝑡𝑚 = 𝐴 𝑣𝑚 .
These red blood cells are thus producing a temporal pulse of 𝑤𝑚 = 𝑡𝑡𝑚. 𝑓𝑠 samples with 𝑓𝑠
being the sampling frequency. Finally, P is a function that expresses the spectral contribution for one frequency bin and for which the detailed expression can be found in the original paper. We suppose now that all measurements parameters are known and fixed except for the flow rate. In this case, the model shows for an ideal laminar blood flow that a single parabolic velocity profile will correspond to a single theoretical Doppler PSD and conversely, that a given
peak velocity will correspond to a single Doppler PSD. (Note that this statement is also true for the corresponding maximum Doppler frequency calculated with (2)). Moreover, per equation (3), a single flow rate will correspond to a single theoretical Doppler PSD and conversely. It is thus possible to estimate blood flow rate from a measured Doppler PSD by finding the flow rate value Q that minimizes the Euclidean distance (L² norm) with the theoretical model following:
𝑎𝑟𝑔𝑚𝑖𝑛 ∥ 𝐷𝑃𝑆𝐷𝑚− 𝐷𝑃𝑆𝐷𝑡ℎ(𝑄) ∥ (7)
Where 𝐷𝑃𝑆𝐷𝑚 is the measured Doppler PSD and 𝐷𝑃𝑆𝐷𝑡ℎ(𝑄) is the Vilkomerson et al.
theoretical model [26] for which the maximum Doppler frequency corresponds to the flow rate Q.
In the next part, we are going to further model the amplitude of the Doppler PSD. The blood flow is still assumed to be steady, fully and uniformly insonified, laminar and fully developed. With the spectral broadening being neglected and the packing factor considered to be spatially invariant, the model given by Bascom and Cobbold [40] for the Doppler PSD is:
𝐷𝑃𝑆𝐷(𝑓(𝑟)) = 2𝜋Ω𝑙𝜎𝑟𝑏𝑐 𝐻
𝑉𝑟𝑏𝑐𝑊(𝐻)𝑟 𝑑𝑟
𝑑𝑣(𝑟) (8)
Here, 𝑓(𝑟) is the Doppler frequency corresponding to the radial velocity 𝑣(𝑟) through the Doppler equation. Ω is the solid angle between the probe and the blood sample, 𝑙 is the width of the ultrasound beam, 𝜎𝑟𝑏𝑐 is the red blood cells backscattering cross-section and 𝑉𝑟𝑏𝑐 is the
red blood cells mean volume. 𝐻 is the hematocrit and 𝑊(𝐻) is the packing factor for which the expression is:
𝑊(𝐻) = (1 − 𝐻)
𝑚+1
[1 + 𝐻(𝑚 − 1)]𝑚−1 (9)
With m being a parameter whose values are 1,2 or 3 if red blood cells are modeled respectively by a slab, a circle or a sphere. Notably, Yuan and Shung [35] demonstrated that a packing factor calculated with m = 3 corresponds to the BSC of disaggregated red blood cells in a laminar flow. When turbulences are present in the flow, the value of m decreases, corresponding to an increase of the BSC [33], [35]. This relation appears in equation (8) through the quantity 𝜎𝑟𝑏𝑐
𝐻
𝑉𝑟𝑏𝑐𝑊(𝐻), which is the expression of the BSC given by Mo and
Cobbold [38]. Also, Bascom and Cobbold [36] proposed that m could take non-integer value, possibly superior to 3 [36]. For a quantitative approach it is more convenient to take the frequency integral of the Doppler PSD rather than its amplitude. Because the blood flow is steady, the integral of the quantity 𝑟𝑑𝑣(𝑟)𝑑𝑟 is constant. We can then write from (8) the following approximated expression for the frequency integral 𝐼𝐷𝑃𝑆𝐷:
𝐼𝐷𝑃𝑆𝐷 = 𝑎𝐻𝑊(𝐻) + 𝑏 (10)
The constant 𝑎 refers to parameters in (8) whereas the constant 𝑏 allows to take into account the noise floor of the measurement set-up.
It is clear from equation (10) that the measurement of the frequency integral of the Doppler
PSD could give access to the hematocrit of the blood flow. Furthermore, equation (10)
indicates that the Doppler PSD frequency integral 𝐼𝐷𝑃𝑆𝐷 is following the same non-monotonic
behavior than the blood backscattering as a function of the hematocrit 𝐻. Thus, as long as the hematocrit range is restrained to any monotonic region of the curve, measuring the hematocrit from the Doppler PSD frequency integral can be done by finding the hematocrit 𝐻 that verifies:
argmin ||𝐼𝐷𝑃𝑆𝐷− 𝑎𝐻
(1 − 𝐻)𝑚+1
[1 + 𝐻(𝑚 − 1)]𝑚−1− 𝑏 || (11)
Where parameters a, 𝑏 and m are estimated through measurements. III - Materials and methods
a) Ethics statement
All blood donors were healthy volunteers who gave written consent for this research study in accordance with the Declaration of Helsinki. Legal and ethical authorization for research use of collected blood was obtained through a national convention between the company Ænitis Technologies and the French Blood Institute (EFS) (convention number 15/EFS/028).
b) Experimental set-up
As described in Fig. 1, an 8-MHz continuous-wave (CW) Doppler pencil dual-element probe (diameter 1cm, quality factor: 1.106) was used for ultrasound emission and reception. The
blood flow was imposed by a precisely calibrated syringe pump (KD Scientific Inc., Holliston, USA) into a 20-cm-long silicon medical tube (Freudenberg, Kaiserslautern, Germany, internal diameter: 760 micrometers). The silicon tube and the CW Doppler probe were mounted into a 3D-printed support in a way that the Doppler angle between the probe and the tube was 40°. The probe insonified all the cross-section of the tube. The support, the probe and the tube were then placed in a small water tank for ultrasound coupling. The probe was supplied in voltage by a function generator (Rigol, Beijing, China). RF signals were amplified with a 40dB analog amplifier and then acquired using a USB acquisition card (HS6, Tiepie engineering, Sneek, Netherlands) interfaced with Matlab (Mathworks, Natick, MA, USA). The post-processing of RF signals was also done using Matlab.
c) Flow rate measurement and signal processing
For the flow measurement validation, ten acquisitions of 10s have been performed for a flow rate ranging from 0.5 mL/min to 1.5 mL/min with a step of 0.1 mL/min using blood samples coming from a single donor blood bag and diluted in its own plasma to a hematocrit of 8%. The syringe was reloaded with blood and carefully agitated manually each 50s.
The function generator was set to deliver a V peak-to-peak voltage resulting in a 10-kPa peak-to-peak acoustic pressure. The sampling frequency was fixed at 20 MHz and acquisitions have been performed on a 2-V peak-to-peak, 8-bit voltage range, leading to a
measurement voltage resolution of 228𝑉 = 0.0078 Volts. It was checked that the received RF
signals presented no saturation effect for this voltage range.
The following post-processing was performed for several signal acquisition durations ranging between 0.5s and 10s. The acquisition time was set by truncating the 10-s-long signals to the desired value.
First, signals were filtered with a Butterworth filter between 8MHz-5000Hz and 8MHz+5000Hz. Signals were then demodulated using quadrature demodulation and down sampled with a rate of 2000. A clutter filter was then applied to each signal to discard unwanted signals for frequencies below 80Hz.
Each signal was next segmented and the Doppler PSD was estimated for each segment. The number of segments was chosen such that each segment had a temporal duration corresponding to a frequency resolution of 1 Hz, except in the case of 0.5-s-long signals that had a 2-Hz resolution. For each signal the Doppler PSD was computed as the mean of the Doppler PSD of all segments. A control acquisition of PSD was performed with distilled water using the previous procedure. It allowed to verify that no unwanted frequency components were present beyond the 80 Hz threshold.
The fitting between each Doppler PSD and its corresponding theoretical model was performed using the Nelder-Mead optimization algorithm with equation (7) as a cost function. Initial estimates were chosen at random between 0.4 mL/min and 1.6 mL/min and the number of iterations was limited to 15. The cost function was computed with the theoretical model being expressed as a function of the flow rate using equation (3) with 𝑓𝑚𝑎𝑥 corresponding to
the highest value of the 𝑓𝑚 set in the Vilkomerson et al. model. At the end of the 15 iterations,
the algorithm was launched again with the estimated flow rate as a new starting point and so on until the flow rate estimation became stable. Measurement errors relative to the flow rate value given by the syringe pump were finally calculated for each PSD.
For an optimal accuracy, the pipe radius R and the beam aperture width A have also been added as cost function parameters in a first calibration step in addition to the flow rate. This calibration was performed with Doppler spectra acquired for the hematocrit estimation and described in the next paragraph. For each Doppler spectrum, the radius and the beam aperture width were thus jointly estimated by the optimization algorithm. The mean values of the radius and the beam aperture width for all the acquisitions were then retained as reference values.
d) Hematocrit measurement and signal processing
For the hematocrit measurement validation, measurements were performed on 4 donor blood bags provided by the EFS at a 1 mL/min flow rate. Each bag was diluted in its own plasma to obtain 10 values of hematocrit (1% to 18%) for each bag. Hematocrit was measured for each of the 40 blood samples using an ABX Pentra 80 (HORIBA, Kyoto, Japan). Acquisition time was reduced to 5s and 30 acquisitions were performed for each blood sample. The syringe was reloaded with blood and carefully agitated manually each 50s. The set-up was entirely dismounted and reassembled between each blood bag. Peak-to-peak acoustic pressure and
acquisition parameters were the same than for flow measurement. Signal filtering and demodulation were also strictly equivalent and were performed for acquisition durations ranging between 1s and 5s.
Each signal was segmented into five segments, and the frequency integral was computed for each of them. Their median was used as the frequency integral of the Doppler PSD in the optimization process to avoid over-estimations of the integrals arising from the strong backscattered echo of rare, yet unwanted air bubbles. In addition, the flow rate for each Doppler PSD was estimated using the procedure detailed in b) and measurements errors relative to the syringe pump were calculated.
In order to assess the general response to our system to hematocrit changes, the parameters of the packing factor model were estimated for the 4 blood bags. For that, equation (10) was fitted to the Doppler PSD frequency integrals of the four blood bags using an iterative reweighted least square algorithm with a and m as fitting parameters. For estimating the value of b, ten 5-s acquisitions of the Doppler frequency integral were made in distilled water. The mean value of all acquisitions was then retained as the value for b. Values for a and m for the four blood bags were then extracted from the fit. Measurement errors on the values of a and m were computed as the standard deviation of their estimation. The convergence of the estimation of a and m was evaluated by performing the fit 10 times with starting points ranging randomly between 2 and 4 for m and between 1.0.10-4and 2.2.10-3 for a.
For performing the hematocrit measurement, the following procedure has been performed for each blood bag. The procedure was limited to hematocrits <8%. First, a fit between the Doppler PSD frequency integrals of the other 3 blood bags and equation (10) was performed with m and a as fitting parameters such as in the previous paragraph. The hematocrit was then estimated for the Doppler PSD frequency integrals of the measuring blood bag through equation (11) with the values for m and a extracted from the fit and using the same setting of the Nelder-Mead algorithm than for the flow rate. The value for b was kept from distilled water measurements. Starting points for the algorithm randomly ranged from a hematocrit of 0.5% to 8.5%. Measurement errors relative to hematocrits value given by the ABX Pentra 80 were finally calculated for each Doppler PSD frequency integrals. IV - Results
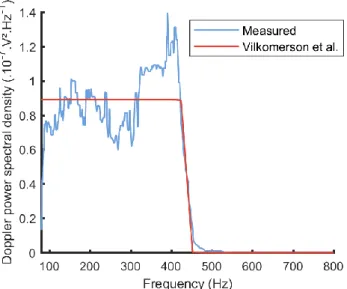
An example of a measured Doppler PSD fitted with its Vilkomerson et al. theoretical model [26] is shown in Fig. 2. The optimal values of the estimated beam aperture width and pipe radius averaged over all Doppler PSD were respectively 4±0.3 mm and 396±3 um (manufacturer-supplied value for the inner radius of the pipe was 380 um). The measured flow rate for Fig. 2 was estimated to be 0.81±0.01 mL/min, while the flow rate imposed by the syringe-pump was 0.8±0.04 mL/min. Fig. 3 reports the evolution of the flow rate measurement error averaged for all acquisitions and all flow rates as a function of the acquisition time. The error is quickly converging to a value under 3% for an acquisition time of 2 s and slowly decays to an error of approximately 2.6% for an acquisition time of 10s.
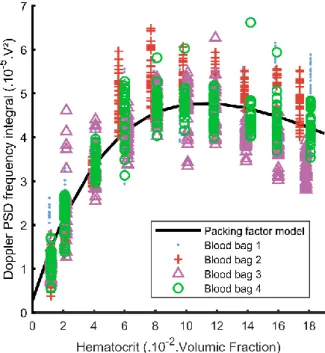
Fig. 4 illustrates measured Doppler PSD frequency integrals for diluted blood samples with the fit of equation (10). The value for b estimated from acquisitions in distilled water is 4.1.10-6 V². Standard deviation for b is ±4.10-7. Values for a and m are respectively
1.10±0.01.10-3 V² and 3.3±0.2. The fitted curve reaches its maximum value for a hematocrit of
approximately 12%. The root mean square error of the fit is 6.0.10-6 V². Standard deviations
between each 10 iterations of the fitting algorithm with different starting points are respectively 2.10-7and 3.10-4 for a and m.
Table. I resume the parameters used for flow rate measurement as well as the values of a, b and m used for the fit in Fig. 4.
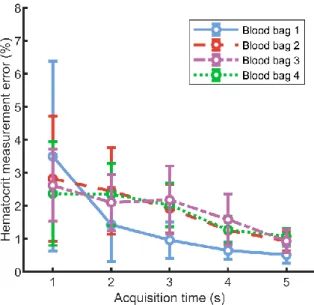
The mean error of the hematocrit measurement from Doppler PSD frequency integrals as a function of acquisition time is displayed in Fig. 5 for each blood bags. The mean error decreases with acquisition time and is under 1.2% hematocrit for an acquisition time of 5s for the 4 blood bags.
Fig. 6 shows the mean measured flow rate compared to the flow rate imposed by the syringe pump for an acquisition time of 2s. A linear correlation in the range 0.5 to 1.5 mL/min was obtained with a R² coefficient of 0.998 and a root mean square error of 0.013 mL/min. The flow rate measurement error is displayed in Fig. 7 for the same acquisition time of 2s. The mean value for the measurement error is 2.8%. The measure presents no bias and is less dispersed for flow rates under 0.8 mL/min.
Fig. 8 gives the flow rate measurement error averaged for all 5-s-long acquisitions performed for the hematocrit estimation. The error is above 5% for hematocrits between 1% and 2% and stabilizes around 2% for hematocrits above 4%.
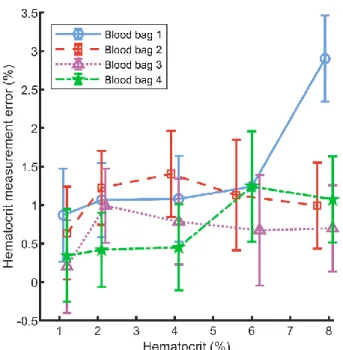
Fig. 9 reports the hematocrit measurement from the Doppler PSD frequency integrals for an acquisition time of 5s. There is a linear correlation between the mean measured hematocrit and the hematocrit estimated by the ABX Pentra 80 for each blood bag. Bag 2, 3 and 4 exhibit R² coefficients close to 1 and root mean square error under 1% hematocrit. Bag 1 presents an outlier point for hematocrits at 8% giving a R² coefficient of 0.62 with a root mean square error of 1.1% hematocrit. The hematocrit mean measurement error for each blood bag at an acquisition time of 5s is given in Fig. 10. The errors averaged on all hematocrit values for blood bag 1, 2, 3 and 4 are respectively 1.4, 1.1, 0.67 and 0.70 % hematocrit. Except for bag 1 at 8% hematocrit, the error have a homogeneous distribution in the tested hematocrit range.
V - Discussion
The recent growth in new blood processing techniques derived from microfluidics increase the need of specific, low-cost, stable and rapid monitoring methods. In particular, new methods for sensing low blood flow rate and hematocrit in narrow medical tubing with a high accuracy are required. We wished to demonstrate in this paper a new Doppler ultrasound method for measuring in vitro blood flow rate and hematocrit. The principle of flow rate measurement is to extract the flow rate as an optimal parameter from the fit between the measured Doppler PSD and the theoretical model developed by Vilkomerson et
al. [26]. The method was tested in sub-milliliter medical tubing and for the flow rate range of
the acoustophoresis blood fractionation chip designed by Bohec et al. [11] .We also evaluated how the method can measure hematocrit with the same Doppler signals than for flow rate, using a simplified packing factor model.
The measured Doppler PSD presented the usual CW Doppler spectrum shape with an expected speckle noise due to the sum of a large number of random-phased signals. Despite the small tubing employed, the signal-to-noise ratio was sufficient for performing close fits with the theoretical model from Vilkomerson et al [26], leading to a highly accurate estimation of the blood flow rate for the whole tested range. In addition, Doppler spectra converged to the theoretical model with a nearly stable error within a few seconds. This confirm the validity of our approach and demonstrate how the Doppler method can be reduced to a basic minimization problem in such an environment. Besides the flow rate, the slight discordance (4%) between the estimated pipe radius and the constructor value might be explained by a pipe dilation due to the pressure gradient generated by the syringe pump. Another explanation could be an incorrect value attributed to one of the measurement parameter and then reported by the optimization algorithm on the pipe value.
To estimate the pipe radius and the beam width through the optimization algorithm might be questionable since both can be respectively known from the constructor or estimated experimentally. However, it is difficult to have a full control on all parameters involved in a quantitative ultrasound experiment. For this reason, the optimization algorithm allows to verify if the fixed parameters used in the model correspond to their expected value when the estimated flow rate is close to the syringe pump flow rate. Here, the minimization process highlighted that our system was able to properly estimate the imposed flow rate provided that the value of the radius was slightly overestimated. The cause of the bias has not been identified but in any case it does not bother the accuracy of the method. For the beam width, it is shown in the study by Vilkomerson et al. [26] that its value does not influence the maximum Doppler frequency in the model.
The high signal-to-noise ratio of Doppler spectra can be mainly attributed to the continuous digitalization of the Doppler signal over a large acquisition time. This combined with the steady and uniform nature of extracorporeal blood flows are the key to perform the fitting with the model. As a consequence, the method for flow rate estimation is restrained to well-controlled environments, where the model can be applied. Nonetheless, a limitation to the demonstrated method is the sampling frequency of 20MHz, which is close to the Nyquist frequency for the 8 MHz signal. In the same way, the 8bit rate would be increased with more resolved electronics. If these drawbacks are partially compensated by the use of a large acquisition time, the signal-to-noise ratio could be increased with more optimal acquisition parameters. As well, the Vilkomerson et al. [26] model is valid for a uniformly insonated flow. This might not be the case because of the curvature of the pipe walls which produces a lens effect [44]. For future studies, a correction based on the aberration induced by the propagation medium inhomogeneity could be implemented to improve accuracy.
From our measurement sample, results tend to show that the packing factor model is sufficient for measuring hematocrit in a range <8%, where its relation with the BSC is close to
be linear. For the 4 blood bags, the measure presented an error under 1.5% hematocrit for an acquisition time of 5s. The peak value around 12% in the packing factor model fitted to the Doppler frequency integrals of the 4 blood bags is in good agreements with observed values around 13% for non-aggregated porcine and bovine blood by Yuan and Shung [35]. The negligible standard deviations in the estimation of a and m using random starting points in the fitting algorithm furthermore demonstrated that the fit was robust. The error of ±0.2 for the value of m between the 4 blood bags shows that, in some cases, the estimation of m from our system will approach the value of 3 corresponding to spheres. This is in agreement with the previous study by Yuan and Shung [35]. In the case of values superior to 3, we might refer to the study performed by Bascom and Cobbold [36]. In this study, the authors suggested that m could take non-integer values, possibly superior to 3. More precisely, they showed that a value of 3.26 for m could correspond to red blood cells modeled by spherocylinders.
It can be clearly seen in Fig. 4 that a hematocrit measurement in a range approximately superior to 12% would have a poor precision because of the large variance of the Doppler frequency integrals. This large variance plus the strong non-linearity in the relationship between hematocrits around 10%-12% and Doppler PSD frequency integrals confirm the limitation of the hematocrit measure below values of 8%. In addition, because of the BSC dependence on flow conditions, it should be noted that the hematocrit estimation using the parameters extracted from the packing factor model is valid only for one flow rate a priori.
The large variance of the measured Doppler PSD frequency integrals might be caused by red-blood cell aggregation. It is known that the aggregation become minor as the shear rate approach 100 s-1 [45]. Using the expression given in [41], the mean shear rate across the
tube during hematocrit measurement at 1 mL/min was calculated to a value of 263 s-1. On the
other hand, De Monchy et al. [46] recently highlighted that the BSC of a mixture of disaggregated and aggregated red blood cells should be higher than for a mixture of disaggregated red blood cells. Following this development, an additional experiment has been conducted on washed red blood cells suspended in saline, where aggregation should be hampered. Ten Doppler frequency integrals have been acquired for hematocrit values of 5%, 10% and 15% (±0.2%) for red blood cells in both plasma and saline. The frequency integrals where then normalized by the following expression [39]:
[𝜅𝑟𝑏𝑐− 𝜅0 𝜅0 + 𝜌0− 𝜌𝑟𝑏𝑐 𝜌𝑟𝑏𝑐 ] 2 (12)
Where 𝜅0 and 𝜌0 are the compressibility and the density of the suspending medium i.e plasma
or saline. In the same way 𝜅𝑟𝑏𝑐 and 𝜌𝑟𝑏𝑐 are red blood cells density and compressibility. Values
for the compressibility and density were 44.3.1012 cm².dyne-1 and 1.005 g.cm-3 for saline,
40.9.1012 cm².dyne-1 and 1.021 g.cm-3 for plasma and 34.1.1012 cm².dyne-1 and 1.092 g.cm-3
for red blood cells. These values were selected from the study by Shung et al. [27]. This expression is found in the red blood cell backscattering cross-section 𝜎𝑟𝑏𝑐 and quantifies the
this impedance rupture is different if red blood cells are suspended in saline or in plasma, the normalization allow to compare the Doppler PSD frequency integrals acquired for both. The result of the comparison is shown in supplementary materials (supplementary figure 1). It can be seen that Doppler PSD frequency integrals acquired for red blood cells in plasma are in average 1.4x higher than in saline. This result suggests that, in spite of the high mean shear rate across tube, it is probable that red blood cell aggregation cannot be neglected in our measurement system. Thus, further investigations will have to be conducted for a better understanding of the influence of red blood cell aggregation on the proposed method.
In the same way, an important aspect to question in order to extend the hematocrit measure to a higher range is the validity of the hypothesis of a spatially invariant packing factor. This hypothesis was initially stated by Bascom and Cobbold [40] for deriving equation (8). But, such an assumption considers non-interacting red-blood cells, which is known to be invalid for physiological hematocrits [47] . For a hematocrit measurement in a physiological range through ultrasonic backscattering, more elaborated models should be used [43], [46]. These models would notably allow to take into account red blood cells aggregation, which is not included in the packing factor model. Also, Yuan and Shung [48] demonstrated that the ultrasonic backscattered signal is dependent on the plasma composition and more particularly on the fibrinogen concentration. Hence, it would be interesting to assess how this dependence could be included in the model. Finally, another limitation of the hematocrit measurement is the inherent non-monotonic behavior of the relationship with backscattered ultrasonic signals. Indeed, it is not possible with this method to discriminate two different hematocrits with the same Doppler PSD frequency integral value. Efforts will have to be done for adding a supplementary indicator to the Doppler integral, while preserving its simplicity.
In the particular case of microfluidic blood processing using diluted blood, the reduction of the method to hematocrits below the peak value of Doppler PSD frequency integrals finds an application. For instance, many systems presented in [1]–[3] operate under 10% hematocrit. In this situation, our method presents the advantage to have a good accuracy for very low hematocrits , for which cited methods have not been demonstrated [28]–[30]. Equally, the capability of the method to sense very low hematocrits could be used as a monitoring tool for blood fractionation processes. As an illustration, we can highlight the acoustophoretic device presented by Bohec et al. [11] which was used for platelet purification. Indeed, the system presented here could be employed for the detection of residual red blood cells in the platelet concentrate at the output of this acoustophoretic device.
For its part, the flow rate measurement method presents few needed improvements for being fully operational in a practical context. Some investigations should be performed to find an optimal coupling medium between the probe and the tube as well as for miniaturizing the system. However, the principle of the method is valid as it is presented. Theoretically, the only limit to the measure is that the signal-to-noise ratio has to be high enough to use the theoretical model. Thus, the method is not limited to flow rates above the tested upper value of 1.5mL/min. For lower flow rates, performances of the method can be expected to drop in the vicinity of 0.1mL/min because corresponding Doppler maximum frequencies in this range will be too close from the 80Hz clutter frequency (which corresponds to a flow rate of
approximately 0.14mL/min). However, it is still possible to reduce the tube diameter for increasing blood speed and thus extending the measurement range to flow rate beyond this limit. The signal loss arising from a smaller tube diameter can then be compensated with a higher input voltage to the probe.
Finally, because of its aggregation tendency and the dense spatial arrangement of red blood cells, human blood is a complex medium to handle for ultrasound. The presented method can be thus expected to be usable for estimating cells concentration in a broad range of biological suspensions with less limitations than in blood. Combined with flow rate measurement, this concentration measurement makes our method an interesting tool for microfluidic bioprocessing in general, where slow flow rates are often encountered.
VI - Conclusion
We proposed in this paper a Doppler ultrasound method for measuring flow rate and hematocrit of an in vitro blood flow. More precisely, our method is conceived for the recent blood processing devices using slow flow rates in narrow medical tubing such as acoustophoresis blood fractionation. The novelty in our approach for flow rate measurement is to use recent theoretical developments for proposing an optimal, versatile and highly accurate adaption of the Doppler method. Furthermore, we showed that the system can be used as a hematocrit sensor for diluted blood based on the well know packing factor model used in the theory of quantitative ultrasound. This hematocrit sensing finds interesting applications in blood sorting technologies but also demonstrate the feasibility of a simple and non-invasive ultrasonic system for measuring hematocrit in in-vitro blood circuits. More generally, our study demonstrates how fundamental aspects of Doppler ultrasound can be easily adapted to the in vitro environment and how this adaptation can contribute to the rise of new blood processing technologies.
ACKNOWLEDGMENT
The work performed in this publication was completed with the support of the Inserm Technology Research Accelerator (Inserm ART) in Biomedical Ultrasound, Paris, France.
The authors would like to thanks Martin Flesch, Baptiste Heiles, Jonathan Porée and Kailiang Xu from Institute Physics for Medicine Paris for their valuable advices.
This project has received funding from the European Union’s Horizon 2020 research and innovation program, under approval number n°783667.
References
[1] H. W. Hou, A. A. S. Bhagat, W. C. Lee, S. Huang, J. Han, and C. T. Lim, “Microfluidic Devices for Blood Fractionation,” Micromachines, vol. 2, no. 3, pp. 319–343, Sep. 2011. [2] Z. T. F. Yu, K. M. A. Yong, and J. Fu, “Microfluidic Blood Cell Sorting: Now and Beyond,”
[3] M. Antfolk and T. Laurell, “Continuous flow microfluidic separation and processing of rare cells and bioparticles found in blood – A review,” Anal. Chim. Acta, vol. 965, pp. 9–35, May 2017.
[4] J. Webster, The Measurement, Instrumentation and Sensors Handbook. Boca Raton, USA: CRC Press LLC, 2000, ch. 76.
[5] R. G. Dantas and E. T. Costa, “Ultrasonic pulsed Doppler blood flowmeter for use in extracorporeal circulation,” Artif. Organs, vol. 24, no. 3, pp. 198–201, Mar. 2000.
[6] D. G. Wyatt, “Blood flow and blood velocity measurement in vivo by electromagnetic induction,” Trans. Inst. Meas. Control, vol. 4, no. 2, pp. 61–78, Apr. 1982.
[7] S. S. Nair, V. Vinodkumar, V. Sreedevi, and D. S. Nagesh, “Rotating permanent magnet excitation for blood flow measurement,” Med. Biol. Eng. Comput., vol. 53, no. 11, pp. 1187– 1199, Nov. 2015.
[8] G. E. Nilsson, T. Tenland, and P. A. Oberg, “Evaluation of a Laser Doppler Flowmeter for Measurement of Tissue Blood Flow,” IEEE Trans. Biomed. Eng., vol. BME-27, no. 10, pp. 597–604, Oct. 1980.
[9] M. Norgia, A. Pesatori, and L. Rovati, “Optical flowmeter for blood extracorporeal circulators,” in 2009 IEEE Intrumentation and Measurement Technology Conference, Singapore. Singapore, 2009, pp. 1759–1762.
[10] Y. Chen et al., “High-throughput acoustic separation of platelets from whole blood,”
Lab. Chip, vol. 16, no. 18, pp. 3466–3472, Aug. 2016.
[11] P. Bohec et al., “Acoustophoretic purification of platelets: Feasibility and impact on platelet activation and function,” Platelets, pp. 1–7, Dec. 2017.
[12] B. Dutra et al., “A Novel Macroscale Acoustic Device for Blood Filtration,” J. Med.
Devices, vol. 12, no. 1, pp. 0110081–0110087, Mar. 2018.
[13] S. Satomura, “Ultrasonic Doppler Method for the Inspection of Cardiac Functions,” J.
Acoust. Soc. Am., vol. 29, no. 11, pp. 1181–1185, Nov. 1957.
[14] D. H. Evans and W. N. McDicken, Doppler Ultrasound: Physics, Instrumentation and
Signal Processing, 2nd Edition. Hoboken, USA: Wiley, 2000, ch. 3.
[15] C. J. Hartley and J. S. Cole, “An ultrasonic pulsed Doppler system for measuring blood flow in small vessels,” J. Appl. Physiol., vol. 37, no. 4, pp. 626–629, Oct. 1974.
[16] D. A. Christopher, P. N. Burns, J. Armstrong, and F. S. Foster, “A high-frequency continuous-wave Doppler ultrasound system for the detection of blood flow in the microcirculation,” Ultrasound Med. Biol., vol. 22, no. 9, pp. 1191–1203, 1996.
[17] C. Huang, P. Lee, P. Chen, and T. Liu, “Design and implementation of a smartphone-based portable ultrasound pulsed-wave doppler device for blood flow measurement,” IEEE
[18] H. A. Christmann, D. R. Smith, B. L. Weaver, W. R. Betten, and R. A. Nazarian, “Real-time DSP system for ultrasonic blood flow measurement,” in IEEE International Symposium on
Circuits and Systems, New Orleans, LA, USA, 1990, pp. 2045–2048.
[19] W. R. Brody and J. D. Meindl, “Theoretical analysis of the CW Doppler ultrasonic flowmeter,” IEEE Trans. Biomed. Eng., vol. 21, no. 3, pp. 183–192, May 1974.
[20] B. A. J. Angelsen, “A Theoretical Study of the Scattering of Ultrasound from Blood,”
IEEE Trans. Biomed. Eng., vol. BME-27, no. 2, pp. 61–67, Feb. 1980.
[21] S. A. Jones, “Fundamental sources of error and spectral broadening in Doppler ultrasound signals,” Crit. Rev. Biomed. Eng., vol. 21, no. 5, pp. 399–483, 1993.
[22] G. Guidi, C. Licciardello, and S. Falteri, “Intrinsic spectral broadening (ISB) in ultrasound Doppler as a combination of transit time and local geometrical broadening,” Ultrasound Med.
Biol., vol. 26, no. 5, pp. 853–862, Jun. 2000.
[23] P. Tortoli, G. Guidi, and V. L. Newhouse, “Improved blood velocity estimation using the maximum Doppler frequency,” Ultrasound Med. Biol., vol. 21, no. 4, pp. 527–532, Jan. 1995. [24] A. H. Steinman, J. Tavakkoli, J. G. Myers, R. S. C. Cobbold, and K. W. Johnston, “A new approach for determining maximum frequency in clinical Doppler ultrasound spectral estimates,” in Proceedings of the 22nd Annual International Conference of the IEEE
Engineering in Medicine and Biology Society (Cat. No.00CH37143), 2000, vol. 4, pp. 2640–2643
vol.4.
[25] A. Kathpalia et al., “Adaptive Spectral Envelope Estimation for Doppler Ultrasound,”
IEEE Trans. Ultrason. Ferroelectr. Freq. Control, vol. 63, no. 11, pp. 1825–1838, 2016.
[26] D. Vilkomerson, S. Ricci, and P. Tortoli, “Finding the peak velocity in a flow from its Doppler spectrum,” IEEE Trans. Ultrason. Ferroelectr. Freq. Control, vol. 60, no. 10, pp. 2079– 2088, Oct. 2013.
[27] K. K. Shung, R. A. Sigelmann, and J. M. Reid, “Scattering of Ultrasound by Blood,” IEEE
Trans. Biomed. Eng., vol. BME-23, no. 6, pp. 460–467, Nov. 1976.
[28] D. Trebbels, R. Zengerle, and D. Hradetzky, “Hematocrit Measurement - A high precision on-line measurement system based on impedance spectroscopy for use in hemodialysis machines,” 2010, vol. 25, pp. 247–250.
[29] S. Ekuni and Y. Sankai, “Non-invasive measurement method of blood hematocrit for management of extracorporeal circulation,” 2014 IEEESICE Int. Symp. Syst. Integr. SII 2014, pp. 76–81, Jan. 2015.
[30] A. Zeidan, L. Golan, and D. Yelin, “In vitro hematocrit measurement using spectrally encoded flow cytometry,” Biomed. Opt. Express, vol. 7, no. 10, pp. 4327–4334, Sep. 2016. [31] W. Secomski, A. Nowicki, F. Guidi, P. Tortoli, and P. A. Lewin, “Non-invasive measurement of blood hematocrit in artery,” Bull. Pol. Acad. Sci. Tech. Sci., vol. 53, Sep. 2005.
[32] E. Franceschini and R. Guillermin, “Experimental assessment of four ultrasound scattering models for characterizing concentrated tissue-mimicking phantoms,” J. Acoust. Soc.
Am., vol. 132, no. 6, pp. 3735–3747, Dec. 2012.
Fig. 1. Schema of the measurement set-up and picture of the probe and the tube mounted in the 3D-printed support.
Fig. 2. A measured Doppler power spectral density fitted to its corresponding Vilkomerson et al. theoretical model. The associated optimized values for the pipe radius and the beam width are respectively 392um and 4mm.
Fig. 3. Mean flow rate measurement error as a function of acquisition time.
Fig. 4. Measured Doppler frequency integrals at diluted hematocrits for the 4 blood bags fitted with the packing factor model of (10).
Fig. 5. Relative error of hematocrit measurement from Doppler frequency integrals as a function of acquisition time and averaged on all hematocrit values.
Fig. 6. Measured flow rate compared to the syringe pump flow rate and regression line for an acquisition time of 2s. The slope is 0.987 (1.6% error) and the offset is 0.493 (1.3% error).
Fig. 7. Flow rate relative measurement error for an acquisition time of 2s.
Fig. 8. Flow rate relative measurement error for the 4 blood bags at diluted hematocrits and with a flow rate at 1mL/min
Fig. 9. Mean estimated hematocrit from Doppler frequency integrals for an acquisition time of 5s.