HAL Id: hal-00296031
https://hal.archives-ouvertes.fr/hal-00296031
Submitted on 21 Sep 2006
HAL is a multi-disciplinary open access
archive for the deposit and dissemination of
sci-entific research documents, whether they are
pub-lished or not. The documents may come from
teaching and research institutions in France or
abroad, or from public or private research centers.
L’archive ouverte pluridisciplinaire HAL, est
destinée au dépôt et à la diffusion de documents
scientifiques de niveau recherche, publiés ou non,
émanant des établissements d’enseignement et de
recherche français ou étrangers, des laboratoires
publics ou privés.
Columnar modelling of nucleation burst evolution in the
convective boundary layer ? first results from a
feasibility study Part III: Preliminary results on
physicochemical model performance using two ”clean air
mass” reference scenarios
O. Hellmuth
To cite this version:
O. Hellmuth. Columnar modelling of nucleation burst evolution in the convective boundary layer ?
first results from a feasibility study Part III: Preliminary results on physicochemical model
perfor-mance using two ”clean air mass” reference scenarios. Atmospheric Chemistry and Physics, European
Geosciences Union, 2006, 6 (12), pp.4231-4251. �hal-00296031�
Atmos. Chem. Phys., 6, 4231–4251, 2006 www.atmos-chem-phys.net/6/4231/2006/ © Author(s) 2006. This work is licensed under a Creative Commons License.
Atmospheric
Chemistry
and Physics
Columnar modelling of nucleation burst evolution in the convective
boundary layer – first results from a feasibility study
Part III: Preliminary results on physicochemical model performance
using two “clean air mass” reference scenarios
O. Hellmuth
Leibniz Institute for Tropospheric Research, Modelling Department, Permoserstrasse 15, 04318 Leipzig, Germany Received: 1 August 2005 – Published in Atmos. Chem. Phys. Discuss.: 10 November 2005
Revised: 14 February 2006 – Accepted: 11 May 2006 – Published: 21 September 2006
Abstract. In Paper I of four papers, a revised columnar high-order model to investigate gas-aerosol-turbulence inter-actions in the convective boundary layer (CBL) was pro-posed. In Paper II, the model capability to predict first-, second- and third-order moments of meteorological variables in the CBL was demonstrated using available observational data. In the present Paper III, the high-order modelling con-cept is extended to sulphur and ammonia chemistry as well as to aerosol dynamics. Based on the previous CBL simu-lation, a feasibility study is performed using two “clean air mass” scenarios with an emission source at the ground but low aerosol background concentration. Such scenarios syn-optically correspond to the advection of fresh post-frontal air in an anthropogenically influenced region. The aim is to eval-uate the time-height evolution of ultrafine condensation nu-clei (UCNs) and to elucidate the interactions between me-teorological and physicochemical variables in a CBL col-umn. The scenarios differ in the treatment of new parti-cle formation (NPF), whereas homogeneous nuparti-cleation ac-cording to the classical nucleation theory (CNT) is consid-ered. The first scenario considers nucleation of a binary sys-tem consisting of water vapour and sulphuric acid (H2SO4)
vapour, the second one nucleation of a ternary system addi-tionally involving ammonia (NH3). Here, the two synthetic
scenarios are discussed in detail, whereas special attention is payed to the role of turbulence in the formation of the typical UCN burst behaviour, that can often be observed in the sur-face layer. The intercomparison of the two scenarios reveals large differences in the evolution of the UCN number con-centration in the surface layer as well as in the time-height Correspondence to: O. Hellmuth
(olaf@tropos.de)
cross-sections of first-order moments and double correlation terms. Although in both cases the occurrence of NPF bursts could be simulated, the burst characteristics and genesis of the bursts are completely different. It is demonstrated, that observations from the surface layer alone are not conclu-sive to elucidate the origin of newly formed particles. This is also true with respect to the interpretation of box mod-elling studies. The binary and ternary NPF bursts observed in the surface layer differ with respect to burst amplitude and phase. New particles simulated in the binary scenario are formed in the forenoon in the upper part of the grow-ing CBL, followed by turbulence-induced top-down trans-port. Hence, with respect to the burst observation site in the surface layer, new particles are formed ex situ. In opposite to this, the ternary case reveals a much more complex pat-tern. Here, NPF is initiated in the early morning hours in the surface layer, when temperature (T ) is low and relative hu-midity (RH ), sulphur dioxide (SO2) and NH3concentrations
are high, hence new particles are formed in situ. Shortly after that, ex situ NPF in the free troposphere sets in, followed by entrainment and top-down diffusion of newly formed parti-cles into the surface layer. Altogether, these processes mainly contribute to the formation of a strong burst in the morning hours in the ternary scenario. While the time-height cross-section of the binary nucleation rate resembles a “blob”-like evolution pattern, the ternary one resembles a “sucking tube”-like pattern. The time-height cross-sections of the flux pattern and double correlations could be plausibly interpreted in terms of CBL turbulence and entrainment/detrainment processes both in the binary and in the ternary case. Although the present approach is a pure conceptual one, it shows the feasibility to simulate gas-aerosol-turbulence interactions in
4232 O. Hellmuth: Burst modelling the CBL. Prior to a dedicated verification/validation study,
further attempts are necessary to consider a more advanced description of the formation and activation of thermodynam-ically stable clusters according to modern concepts proposed by Kulmala et al. (2000), Kulmala (2003) and Kulmala et al. (2004a).
1 Introduction
Atmospheric NPF is known to frequently occur all around the world (Kulmala et al., 2004b). It is generally accepted to be a key process in regional and global climate control by aerosols, that deserves a better description in atmospheric models (Kulmala, 2003). A comprehensive review of obser-vations and phenomenological studies of NPF, atmospheric conditions under which NPF has been observed and empiri-cal nucleation rates etc. over the past decade from a global retrospective and from different sensor platforms was per-formed by Kulmala et al. (2004b). With respect to full under-standing of atmospheric nucleation Kulmala (2003, p. 1001) raised two fundamental questions, which are deserved to be answered:
1. Do neutral, stable clusters exist in the atmosphere? Ion clusters do exist, but the nucleation rate predicted by the ion-mediated mechanism is limited by ion production rate, which often gives lower particles nucleation rates than observed.
2. Which mechanism governs the initial growth?
To answer these questions, Kulmala (2003) demands an in-terdisciplinary approach involving laboratory experiments, continuous field observations, new theories and dynamic models. With respect to the latter aspect, here an attempt is made to elucidate the possible role of CBL turbulence in NPF by means of a columnar model.
Based on the simulation of the evolution of a typical CBL, described in Paper II, in the present Paper III the physico-chemical conditions of NPF in the anthropogenically influ-enced CBL is investigated. Within the framework of a fea-sibility study two exemplary scenarios are investigated to demonstrate, that the model gives reasonable results. In the present paper, special attention is payed to the interpretation of the time-height cross-sections of first- and second-order moments of physicochemical properties under turbulent con-ditions. The aim of the present study is to elucidate the role of turbulent diffusion and mixing in the initiation of NPF bursts, that can often be deduced from in situ aerosol measurements performed in the convective surface layer (see the generalised evolution pattern in Fig. 1 of Paper I).
Here, the NPF evolution for a homogeneous binary and ternary “clean air mass” nucleation scenario is investigated.
2 Treatment of “spurious oscillations”
In Subsubsection 5.2.1 and Section 6 of Paper I the origin of non-physical solutions, so-called spurious oscillations, of the third-order turbulence model and measures to damp them were discussed. While the addition of an artificial diffusion term to the right-hand sides of the third-order moment equa-tions was found to efficiently damp such non-physical solu-tions in the meteorological part of the model, it does not in the physicochemical part. From a series of numerical experi-ments it was found, that in the model equations including the full physicochemical interactions, described in Appendix C2 of Paper I, spurious oscillations were already amplified and became dominant after a couple of hours of integration time until an abnormal end of the simulation. Under no circum-stances it was possible to find stable solutions of the model system, when physicochemical source/sink terms (interac-tion of reactive tracers) were considered. The solu(interac-tion was found to be very sensitive against the vertical gradient of the mean physicochemical variables, ∂χα/∂z, α=1, . . . , N, ap-pearing in the third-order moment equations of Appendix C3 of Paper I, i.e., in the governing equations for the turbulent transport of scalar fluxes (Appendix C3.2, Eq. (C29)) and the turbulent transport of scalar correlations (Appendix C3.3, Eq. (C32) and Appendix C3.4, Eq. (C35)). To investigate its influence on the evolution of first-, second- and third-order moments a number of runs were performed, in which the original mean gradient term was adjusted by an artificial re-duction factor, i.e., (1−C12)×(∂χα/∂z), α=1, . . . , N, with C12varying between 0 (original formulation) and 1
(vanish-ing mean gradient). It was found, that C12strongly affects the
time period during which the solution remains stable. How-ever, the only way to keep the simulation stable over the whole integration time was to set C12=1. The reason for that
behaviour is not yet clear. For the time being, the considera-tion of the reducconsidera-tion factor in front of the mean gradient term for the physicochemical variables is only an ad hoc approach to damp self-amplifying oscillations. However, in their high-order model Verver et al. (1997, Eq. (8), see references therein) conducted a number of similar simplifications in the governing equation of third-order moments. Among oth-ers, the authors neglected all terms of the form M3∂M1/∂z,
where M1and M3are the averaged first and third moments,
respectively: “It is motivated by the notion that within the bulk of the unstable boundary layer the mean gradient of
scalar quantities (∂M1/∂z), as well as terms that contain this
gradient, are small” (Verver et al., 1997, pp. 200–201).
3 Parameter dependency of different nucleation mech-anisms
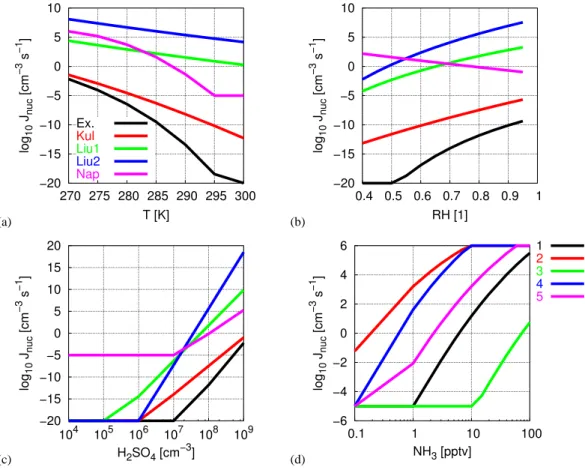
Figure 1 shows the parameter dependency of different state-of-the-art nucleation models and parameterisations based on the CNT. Kinetic models are not considered. As seen
O. Hellmuth: Burst modellingO. Hellmuth: Burst modelling 423315 (a) −20 −15 −10 −5 0 5 10 270 275 280 285 290 295 300 log 10 Jnuc [cm −3 s −1 ] T [K] Ex. Kul Liu1 Liu2 Nap (b) −20 −15 −10 −5 0 5 10 0.4 0.5 0.6 0.7 0.8 0.9 1 log 10 Jnuc [cm −3 s −1 ] RH [1] (c) −20 −15 −10 −5 0 5 10 15 20 104 105 106 107 108 109 log 10 Jnuc [cm −3 s −1 ] H2SO4 [cm−3] (d) −6 −4 −2 0 2 4 6 0.1 1 10 100 log 10 Jnuc [cm −3 s −1 ] NH3 [pptv] 1 2 3 4 5
Fig. 1 Parameter dependence of different nucleation rate models: “Ex.” - Exact model with consideration of cluster hydration effects (Stauffer, 1976; Jaecker-Voirol et al., 1987; Jaecker-Voirol and Mirabel, 1988, 1989; Kulmala and Laaksonen, 1990; Laaksonen and Kulmala, 1991; Kulmala et al., 1998; Seinfeld and Pandis, 1998); “Kul” - Parameterisation of binary nucleation rate inclusive hydration effects according to Kulmala et al. (1998); “Liu1” - Parameterisation of binary nucleation rate according to Liu et al. (2001, Eq. 3); “Liu2” - Parameterisation of ternary nucleation rate at an implicite ammonia concentration of 0.5 pptv according to Liu et al. (2001, Eq. 21); “Nap” - Parameterisation of ternary nucleation rate according to Napari et al. (2002b); (a) Temperature dependence at RH = 0.8, [H2SO4] = 108cm−3, [NH3] = 0.5 pptv; (b) Humidity dependence at T = 288.15 K, [H2SO4] = 108cm−3, [NH3] = 0.5 pptv; (c) Sulphuric-acid vapour dependence at T = 288.15 K, RH = 0.8, [NH3] = 0.5 pptv; (d) Gas-phase ammonia dependence of the ternary nucleation rate according to Napari et al. (2002b, “Nap”) for different parameter combinations of temperature, relative humidity, and sulphuric-acid vapour concentration (1 : T = 288.15 K, RH = 0.8,
[H2SO4] = 107cm−3; 2 : T = 273.15 K, RH = 0.8, [H2SO4] = 107cm−3; 3 : T = 288.15 K, RH =
0.8, [H2SO4] = 106cm−3; 4 : T = 288.15 K, RH = 0.8, [H2SO4] = 108cm−3; 5 : T = 288.15 K,
RH = 0.4, [H2SO4] = 107cm−3).
www.atmos-chem-phys.org/acp/0000/0001/ Atmos. Chem. Phys., 0000, 0001–26, 2006 Fig. 1. Parameter dependence of different nucleation rate models: “Ex.” – Exact model with consideration of cluster hydration effects (Stauf-fer, 1976; Jaecker-Voirol et al., 1987; Jaecker-Voirol and Mirabel, 1988, 1989; Kulmala and Laaksonen, 1990; Laaksonen and Kulmala, 1991; Kulmala et al., 1998; Seinfeld and Pandis, 1998, Chapter 10); “Kul” – Parameterisation of binary nucleation rate inclusive hydration effects according to Kulmala et al. (1998); “Liu1” – Parameterisation of binary nucleation rate according to Liu et al. (2001, Eq. (3)); “Liu2” –
Parameterisation of ternary nucleation rate at an implicit NH3mixing ratio of 0.5 pptv according to Liu et al. (2001, Eq. (21)); “Nap” –
Pa-rameterisation of ternary nucleation rate according to Napari et al. (2002b); (a) Temperature dependence at RH =0.8, [H2SO4]=108cm−3,
[NH3]=0.5 pptv; (b) Humidity dependence at T =288.15 K, [H2SO4]=108cm−3, [NH3]=0.5 pptv; (c) H2SO4 vapour dependence at
T =288.15 K, RH =0.8, [NH3]=0.5 pptv; (d) Gas phase NH3dependence of the ternary nucleation rate according to Napari et al. (2002b,
“Nap”) for different parameter combinations of temperature, relative humidity and H2SO4vapour concentration ( 1: T=288.15 K, RH =0.8,
[H2SO4]=107cm−3; 2: T=273.15 K, RH =0.8, [H2SO4]=107cm−3; 3: T=288.15 K, RH =0.8, [H2SO4]=106cm−3; 4: T=288.15 K,
RH =0.8, [H2SO4]=108cm−3; 5: T=288.15 K, RH =0.4, [H2SO4]=107cm−3).
from Fig. 1a, the nucleation rate strongly increases as tem-perature decreases. At fixed temtem-perature, the various nu-cleation rate models differ by several orders of magni-tude. The parameterisations of Liu et al. (2001, Eq. (21), “Liu2”) and Napari et al. (2002b, “Nap”) are for ternary nucleation at NH3=0.5 pptv. As pointed out by Liu et al.
(2001), the temperature dependency of the nucleation pro-cess is poorly known, and theoretical estimates of nucle-ation rates are notoriously uncertain, primarily due to un-certainties in the required thermodynamic data. Therefore, the large variation between different nucleation rates is not surprising but reflects the level of process understanding and parameter knowledge. The humidity dependency is shown in Fig. 1b. For most of the considered models the nucle-ation rate increases when relative humidity increases,
ex-cept for the ternary nucleation rate of Napari et al. (2002b, “Nap”). For the ternary case Napari et al. (2002a, Figs. 8 and 9) demonstrated, that hydration consumes free H2SO4
molecules to the extent, that nucleation decreases regard-less of increasing humidity. This effect was found to be more pronounced at low NH3 concentrations. At low
tem-peratures and high trace gas concentrations the nucleation rate is less dependent on relative humidity (Napari et al., 2002a). In opposite to this, the NH3-enhanced nucleation
rate derived by Liu et al. (2001, Eq. (21),“Liu2”) increases with increasing relative humidity. At RH =0.8 it is approx-imately five orders of magnitude larger than that of Na-pari et al. (2002b, “Nap”). The overall variability between the different nucleation rate models is quite large at fixed humidity. The dependency on H2SO4 vapour is shown in
4234 O. Hellmuth: Burst modelling Fig. 1c. The nucleation rate increases as the H2SO4vapour
concentration increases. As in the foregoing cases, the var-ious nucleation rates differ by several orders of magnitude at fixed H2SO4 concentration. Figure 1d shows the
depen-dency of the ternary nucleation rate of Napari et al. (2002b, “Nap”) on the NH3 concentration for several combinations
of temperature, relative humidity and H2SO4 vapour
con-centration. In general, the ternary nucleation rate increases with increasing NH3concentration. Comparing graph 1 and
2 in Fig. 1d one can see, that the nucleation rate is very sen-sitive against the temperature. At fixed NH3 concentration,
the nucleation rate increases by approximately five orders of magnitude, when temperature decreases by 15 K. A compar-ison of graph 1 and 3 in Fig. 1d shows, that a decrease of the H2SO4concentration by one order of magnitude reduces
the nucleation rate by approximately five orders of magni-tude. The hydration effect on the nucleation rate can be seen from the comparison of graph 1 and 5 in Fig. 1d. Keeping all other parameters fixed, a reduction of the relative humidity from 0.8 to 0.4 leads to an increase of the nucleation rate by approximately two orders of magnitude.
Summing up it becomes clear, that the nucleation rate model is a highly uncertain and non-linear parameter function in the present modelling approach. However, while the abso-lute values of the nucleation rate strongly differ from model to model, the parameter dependencies reflecting the model sensitivity do not. While the nucleation rate determines the absolute amount of newly formed particles, the parameter dependency1mainly affects the UCN variation in space and time. As the different nucleation rates behave similar with re-spect to parameter variation, the spatio-temporal variation of the UCNs is expected to be, at least, more reliable than the absolute amount of predicted new particles.
4 Model setup
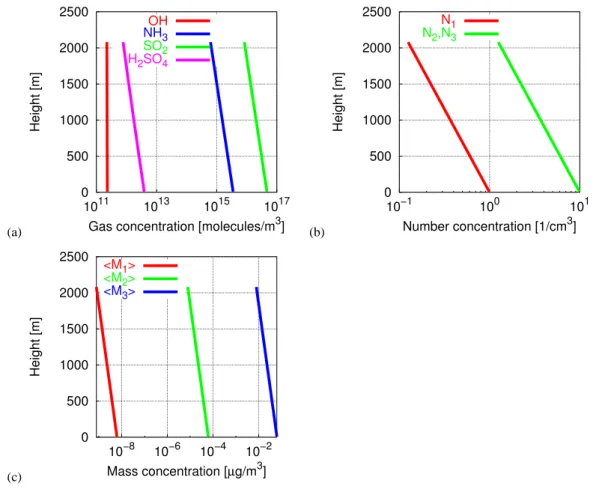
To investigate NPF events in the anthropogenically influ-enced CBL, the meteorological simulation described in Pa-per II is used as a driving environment for the physicochemi-cal evolution leading to NPF in the CBL. Figure 2 shows the initial vertical profiles of hydroxyl radical (OH), total NH3,
SO2 and H2SO4(Fig. 2a) as well as the number and mass
concentrations of nucleation mode, Aitken mode and accu-mulation mode particles (Figs. 2b, c). The vertical decrease obeys an e-function according to a characteristic scale height. As described in Section 6 of Paper I, here two scenarios are considered with an emission source at the ground but very low background concentrations of particles, henceforth called “clean air mass” scenarios. Such situations might be synoptically relevant in anthropogenically influenced CBLs in connection with frontal air mass change and post-frontal advection of fresh polar and subpolar air.
1Here, the shape of the nucleation rate function is meant, i. e, its
steepness, smoothness etc.
To simplify the chemical reaction system, the evolution of OH is empirically prescribed. To consider anthropogenic influences, the reservoir of SO2 and NH3 is permanently
supplied with emissions from surface area sources. With respect to emissions, the federal state Saxony in Ger-many is considered as a reference region. Covering an area of 18.413 km2, the annual emission strength amounts 200 kt/year for SO2 and 30 kt/year for total NH3 (gas
phase plus particle phase). The corresponding average emission rates are 3.24×10¹¹molecules cm−2s−1 for SO2
and 1.83×10¹¹molecules cm−2s−1 for total NH3,
respec-tively. The SO2emission rate is approximately 50% of that
used in the urban case scenario U3 of Pirjola and Kulmala (1998, Table 2). For simplicity, the emissions were put into the surface layer at a mean emission rate.
The very low background particle concentration considered here has been chosen to simulate a very low condensation sink as a prerequisite for the availability of a high amount of the H2SO4 vapour to get an evaluable nucleation
sig-nal. The choice of a comparatively high pseudo-second or-der rate coefficient for the reaction of SO2with OH (see
Pa-per I, Subsubsection 5.2.2) and a comparatively low H2SO4
sticking probability (see Paper I, Subsubsection 5.2.5) also moves the H2SO4vapour concentration toward higher
val-ues, which can easily result in an overprediction of the avail-able H2SO4vapour concentration in comparison with
obser-vations. This may lead to acidity levels (and nucleation), that might be higher than that typically observed during atmo-spheric NPF events ([H2SO4]∼107cm−3). From a number
of preceding screening studies to get experience with the model sensitivity and to adjust the model to a nucleation regime it was found, that the nucleation signal strongly de-pends on the surface concentration of pre-existing particles as well as on the sticking probability. Hence, the present study can not claim to reproduce the very complex “real-ity” of atmospheric NPF. Especially, it can not contribute to the elucidation of the physicochemical processes at the Angstrom scale, that are responsible for atmospheric NPF at relative acidities being lower than that predicted by the CNT ([H2SO4]CNT∼1010cm−3). Hence, the results are not
directly comparable to atmospheric observations. However, to study gas-aerosol-turbulence interactions in the CBL from a mechanistic point of view, we think, that the approach pre-sented here is at least justified within the framework of a con-ceptual study addressed to the role of CBL turbulence and to the application of the CNT.
Alternatively, one could also have considered another model setup with a higher background concentration of pre-existing particle surfaces (and/or higher H2SO4sticking probability)
and, consequently, lower H2SO4 concentration. A
plausi-ble mechanism to get an evaluaplausi-ble nucleation signal in the low-acidity regime is collision-controlled nucleation. Weber et al. (1996) proposed a semi-empirical expression for the collision-controlled nucleation rate, in which the stabilis-ing effect of NH3onto subcritical clusters has been
O. Hellmuth: Burst modelling16 O. Hellmuth: Burst modelling4235 (a) 0 500 1000 1500 2000 2500 1011 1013 1015 1017 Height [m]
Gas concentration [molecules/m3]
OH NH3 SO2 H2SO4 (b) 0 500 1000 1500 2000 2500 10−1 100 101 Height [m] Number concentration [1/cm3] N1 N2,N3 (c) 0 500 1000 1500 2000 2500 10−8 10−6 10−4 10−2 Height [m] Mass concentration [µg/m3] <M1> <M2> <M3>
Fig. 2 Initial vertical profiles: (a) Gas-phase concentration; (b) Aerosol-number concentration; (c) Aerosol-mass concentration
Atmos. Chem. Phys., 0000, 0001–26, 2006 www.atmos-chem-phys.org/acp/0000/0001/
Fig. 2. Initial vertical profiles: (a) Gas phase concentration; (b) Particle number concentration; (c) Particle mass concentration
Table 1. Collision-controlled nucleation rate Jobs according to
Eq. (1) (Weber et al., 1996).
H2SO4[cm−3] γ =0.001 γ =0.003
1.0×10⁷ 0.03 cm−3s−1 0.27 cm−3s−1
5.0×10⁷ 0.75 cm−3s−1 6.75 cm−3s−1
1.0×10⁸ 3 cm−3s−1 27 cm−3s−1
ered. The steady-state rate of particle formation in the ab-sence of cluster scavenging by pre-existing particles reads
Jobs≈βγ2[H2SO4]2 (1)
with [H2SO4] being the H2SO4 concentration in [cm−3],
β=3×10⁻¹⁰cm3s−1being the collision frequency function for the molecular cluster, that contain the stabilised H2SO4
molecule, and γ being the thermodynamically determined NH3-stabilised fraction of the H2SO4 monomer (γ =0.001
for Hawaii, γ =0.003 for Colorado). In Table 1, calculated nucleation rates according to Eq. (1) are shown.
From Table 1 it can be seen, that the signal from collision-controlled nucleation at [H2SO4] ∼107cm−3is of the same
order of magnitude as that obtained from the CNT presented in Fig. 4a (Jbin∼1 cm−3s−1) for the high H2SO4vapour
con-centration shown in Fig. 3e ([H2SO4]max=8.8×109cm−3)
(see Subsubsection 5.1.3). Thus, one could also study NPF within a conceptual framework like the present one at the low acidities observed in the atmosphere, when evaluating another nucleation mechanism. The question, how powerful and justified the nucleation expression given in Eq. (1) is, can not be answered here. Its investigation deserves a dedicated verification/validation study.
5 Evolution of the physicochemical variables in the CBL
5.1 First-order moments 5.1.1 OH concentration
The time-height cross-section of the photochemically driven OH concentration is presented in Fig. 3a. The evolution pat-tern is prescribed using an empirical relation (Liu et al., 2001) (see Paper I, Subsubsection 5.2.2, Appendix D1.1, Eq. (D2)). According to this, OH exceeds its maximum
4236 O. Hellmuth: Burst modelling
O. Hellmuth: Burst modelling 17
(a) 3 6 9 12 15 18 Time [h] 0 300 600 900 1200 1500 1800 H ei g h t [m ] 2.2*1011 2.2*1012 4.2*1012 6.2*1012 8.2*1012 1.0*1013 [OH] [molecules / m3] (b) 3 6 9 12 15 18 Time [h] 0 300 600 900 1200 1500 1800 H ei g h t [m ] 1.0*1016 4.8*1016 8.6*1016 1.2*1017 1.6*1017 2.0*1017 [SO2] [molecules / m3] (c) 3 6 9 12 15 18 Time [h] 0 300 600 900 1200 1500 1800 H ei g h t [m ] 6.0*1015 2.5*1016 4.4*1016 6.2*1016 8.1*1016 10.0*1016 [NH3] [molecules / m3] (d) 3 6 9 12 15 18 Time [h] 0 300 600 900 1200 1500 1800 H ei g h t [m ] 5.0*109 2.4*1010 4.3*1010 6.2*1010 8.1*1010 1.0*1011 [NH3gas] [molecules / m3] (e) 3 6 9 12 15 18 Time [h] 0 300 600 900 1200 1500 1800 H ei g h t [m ] 9.4*1011 1.8*1015 3.5*1015 5.3*1015 7.1*1015 8.8*1015 [H2SO4] [molecules / m3] (f) 3 6 9 12 15 18 Time [h] 0 300 600 900 1200 1500 1800 H ei g h t [m ] 9.4*1011 1.8*1014 3.5*1014 5.3*1014 7.0*1014 8.8*1014 [H2SO4] [molecules / m3]
Fig. 3 First-order moments of physico-chemical variables: (a) Hyroxyl radical; (b) Sulphur dioxide; (c) Total ammonia; (d) Gas-phase ammonia; (e) Sulphuric acid - binary case; (f) Sulphuric acid - ternary case
www.atmos-chem-phys.org/acp/0000/0001/ Atmos. Chem. Phys., 0000, 0001–26, 2006
Fig. 3. First-order moments of physicochemical variables: (a) OH; (b) SO2; (c) Total NH3; (d) Gas phase NH3; (e) H2SO4– binary case;
(f) H2SO4– ternary case.
at noontime, when the solar elevation assumes its maxi-mum. During the night, the OH concentration is hold con-stant at a minimum value.
5.1.2 SO2, total NH3and gas phase NH3concentration
The evolution patterns of SO2(Fig. 3b), total NH3(Fig. 3c)
and gas phase NH3(Fig. 3d) correspond well to the evolution
of CBL turbulence. Before sunrise, turbulence is weak and only mechanically driven, which results in a very low mixing layer height (MLH). Hence, anthropogenic emissions lead to
the enhancement of concentrations in the surface layer. In the course of the day, concentrations decrease due to dilu-tion originating from buoyancy-driven turbulence. In the late afternoon turbulence weakens, afterwards a residual layer forms and near-surface concentrations increase again. The evolution of total and gas phase NH3 proceeds nearly
syn-chronously. The equilibrium gas phase concentration of NH3
is approximately six orders of magnitude lower than the total NH3concentration.
O. Hellmuth: Burst modelling 4237 5.1.3 H2SO4concentration and nucleation rate
The evolution of H2SO4vapour (Figs. 3e, f) strongly depends
on the considered nucleation mechanism. Figure 3e shows the H2SO4evolution in the course of the day for binary
ho-mogeneous nucleation of H2SO4 and water vapour. After
sunrise, the H2SO4 concentration starts to rise due to the
photooxidation of SO2 by OH. When the H2SO4
concen-tration apparently exceeds a certain threshold value2, note-worthy nucleation can occur, as seen from the time-height cross-section of the binary nucleation rate in Fig. 4a. The nucleation occurs in the forenoon within the growing CBL, namely just below the CBL top. The NPF event resembles a “blob”-like pattern in the time-height cross-section. Accord-ing to this, new particles form in the upper third of the CBL, where temperature is low enough and relative humidity and acidity are high enough to initiate binary nucleation. In the present case, entrainment of UCNs from the residual layer or free troposphere does not contribute to the aerosol evolution, because the initial UCN concentration in the free troposphere is very low in the considered scenario. After new particles were formed and diluted within the developing CBL, the H2SO4concentration decreases except for the region outside
the CBL. The newly formed particles within the CBL may serve as a condensation sink for H2SO4vapour, leading to a
“self-cleansing” of the CBL from condensable gases. Above the CBL, this does not happen. When the H2SO4
concentra-tion within the CBL apparently drops below a certain thresh-old, binary nucleation immediately breaks up.
The evolution of the H2SO4concentration for ternary
nucle-ation of water vapour, H2SO4 and NH3 (Fig. 3f) is
qual-itatively and quantqual-itatively different from that for the bi-nary case (Fig. 3e). In the terbi-nary case, the maximum of the H2SO4concentration is one order of magnitude lower
com-pared to the binary case. This is due to the larger condensa-tion sink provided by newly formed particles as well as due to the nucleation loss of H2SO4molecules (i.e., the number
of molecules consumed in the formation of the critical em-bryo). Thus, the differences in the H2SO4evolution originate
from the different nucleation rate evolution.
The maximum H2SO4concentration in the binary nucleation
scenario (Fig. 3e) exceeds [H2SO4]max=8.8×109cm−3. Liu
et al. (2001, Fig. 2b, 8b) reported on simulated maxima of the H2SO4 concentrations over the Northwestern
At-lantic of [H2SO4]max∼2 pptv ≈5×107cm−3. For a rural
con-tinental mountain site in Southern Germany (Hohenpeis-senberg), Birmili et al. (2000, Fig. 1) reported on a calcu-lated maximum of [H2SO4]max∼2.5×107cm−3 and on an
observed one of [H2SO4]max∼1.5×107cm−3. Later on,
Bir-mili et al. (2003, Fig. 7) confirmed an order of magnitude above 107cm−3 for the daily maximum H2SO4
concentra-tion at the Hohenpeissenberg observatory. Based on mea-surements performed during the EU project QUEST
(Quan-2Based on visual inspection.
tification of Aerosol Nucleation in the European Bound-ary Layer), which was conducted in Hyyti¨al¨a, Finland in March–April 2003, Boy et al. (2005, Table 1, Fig. 8) re-ported on maximum midday H2SO4 concentrations
vary-ing between 3×10⁵−1.9×107cm−3 for the measurements and 3×10⁵−1.4×107cm−3 for the calculations, respec-tively. Measured H2SO4concentrations were found to be by
a factor of 1.46 higher in “polluted air masses” (originat-ing over Central Europe or UK) than in “clean air masses” (originating over the Northern Atlantic or the polar re-gions). Hence, compared to this values, the H2SO4
concen-tration in the present simulations is overestimated.
The nucleation rates for both scenarios are depicted in Figs. 4a and b. In contrast to the binary nucleation rate (Fig. 4a), the ternary one (Fig. 4b) assumes its maximum at the top of the model domain. The maximum itself is three orders of magnitude higher compared to that of the binary nucleation rate. It should be noted, that the parameterisa-tion formula for the ternary nucleaparameterisa-tion rate cannot be used to obtain the binary H2O/H2SO4 vapour limit
(correspond-ing to vanish(correspond-ing NH3concentration) or the H2O/NH3limit
(corresponding to vanishing H2SO4concentration). This
re-sults from the fact, that the natural logarithm, being a part of the parameterisation of the ternary nucleation rate, is in-finite for argument zero (i.e., for vanishing concentrations) (Napari et al., 2002b). The nucleation rate maximum at the top of the model domain reflects the temperature dependency of the nucleation rate parameterisation at the ambient H2SO4
and gas phase NH3concentration there, but to a higher extent
the humidity dependency of the ternary nucleation rate. As seen from Korhonen et al. (1999, Figs. 2 and 3), Napari et al. (2002a, Figs. 8 and 9) and Napari et al. (2002b, Fig. 4), the ternary nucleation rate strongly increases with decreasing relative humidity at constant temperature and acidity. Na-pari et al. (2002a, p. 4226) wrote: “[. . .] nucleation rate de-creases with increasing water content in the vapour.
How-ever, the constant free H2SO4curves show the expected
up-ward slope, which indicates that hydration consumes free
H2SO4to the extent, that nucleation slows regardless of
in-creasing RH . This effect is more pronounced at low NH3
concentrations. Nucleation rate seems to be less dependent on RH at low temperatures and high trace gas concentra-tions, which is not surprising since the corresponding criti-cal clusters are almost water-free.” The authors emphasised, that their old model for ternary nucleation suggested, that the nucleation rate is almost independent on RH . Considering the time-height evolution of the relative humidity presented in Fig. 3f of Paper II, it appears, that the relative humidity attains its minimum (RHmin∼10%) at the top of the model
domain according to the chosen model setup. Hence, the sim-ulated maximum of the ternary nucleation rate at the top of the model domain is reasonable.
The pattern of the H2SO4 evolution in the ternary case
re-sults from superposition of photochemical activity and CBL turbulence. In the early morning, the H2SO4 concentration
4238 O. Hellmuth: Burst modelling
18 O. Hellmuth: Burst modelling
(a) 3 6 9 12 15 18 Time [h] 0 300 600 900 1200 1500 1800 H ei g h t [m ] 0.0*100 2.9*105 5.7*105 8.6*105 1.1*106 1.4*106 [# / m- 3s- 1] (b) 3 6 9 12 15 18 Time [h] 0 300 600 900 1200 1500 1800 H ei g h t [m ] 0.0*100 5.8*108 1.2*109 1.8*109 2.3*109 2.9*109 [# / m- 3s- 1] (c) 3 6 9 12 15 18 Time [h] 0 300 600 900 1200 1500 1800 H ei g h t [m ] 1.2*105 3.5*108 6.9*108 1.0*109 1.4*109 1.7*109 [N1] [# / m3] (d) 3 6 9 12 15 18 Time [h] 0 300 600 900 1200 1500 1800 H ei g h t [m ] 1.2*105 5.4*1011 1.1*1012 1.6*1012 2.2*1012 2.7*1012 [N1] [# / m3] (e) 3 6 9 12 15 18 Time [h] 0 300 600 900 1200 1500 1800 H ei g h t [m ] 1.3*106 3.0*106 4.7*106 6.4*106 8.1*106 9.8*106 [N2] [# / m3] (f) 3 6 9 12 15 18 Time [h] 0 300 600 900 1200 1500 1800 H ei g h t [m ] 1.3*106 3.0*106 4.7*106 6.4*106 8.2*106 9.9*106 [N3] [# / m3]
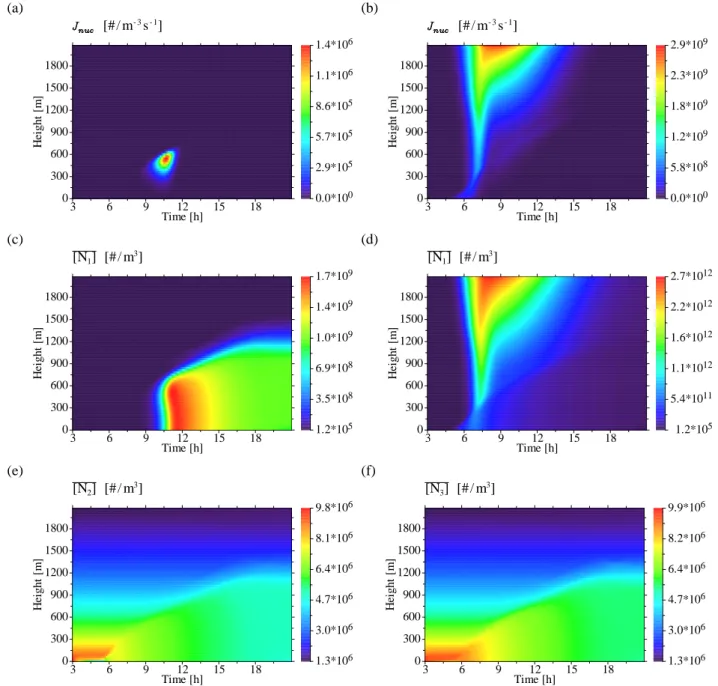
Fig. 4 First-order moments of physico-chemical variables: (a) Binary nucleation rate; (b) Ternary nucleation rate; (c) UCN-number concentration - binary case; (d) UCN-number concentration - ternary case; (e) Aitken-mode number concentration - binary case; (f) Accumulation-Aitken-mode number concentration - binary case
Atmos. Chem. Phys., 0000, 0001–26, 2006 www.atmos-chem-phys.org/acp/0000/0001/
Fig. 4. First-order moments of physicochemical variables: (a) Binary nucleation rate; (b) Ternary nucleation rate; (c) UCN number concen-tration – binary case; (d) UCN number concenconcen-tration – ternary case; (e) Aitken mode number concenconcen-tration – binary case; (f) Accumulation mode number concentration – binary case.
increases due to photooxidation of SO2after sunrise. As the
MLH limits the vertical extension of the diffusion domain, SO2 concentration is enhanced below the MLH due to
an-thropogenic emissions. Hence, the H2SO4concentration is
elevated too. Above the MLH, the formation of H2SO4 is
limited by the given background SO2concentration, which
is set up by the initial profile of SO2. Therefore, the H2SO4
formation above the MLH is lower than that in the mixing layer. Due to the low temperature and humidity at the top of the model domain, the nucleation rate forms a “virga”-like pattern in the time-height cross-section (Fig. 4b), resembling
a “sucking tube”. The ternary nucleation rate strongly de-creases from the top of the model domain toward the surface layer. However, in the course of the day the nucleation starts in the surface layer but not at the top of the model domain. In the surface layer, the temperature is in fact higher compared to that at the top of model domain, hence reducing the nu-cleation rate. But this damping effect is overcompensated by the enhanced near-surface concentration of NH3and H2SO4
vapour. Thus, new particles form at a low rate. Later on, when H2SO4formation increases with the rising sun, the
nu-cleation maximum moves toward the region with lower
O. Hellmuth: Burst modelling 4239 peratures, i.e., toward higher levels. Here, nucleation occurs
at much higher rates. In this way, the early start of nucleation in the surface layer and the delayed NPF burst originating above the MLH are mainly an effect of the non-linearity and the varying sensitivity of the nucleation rate throughout the input parameter space.
When UCNs have been formed, the further evolution of H2SO4vapour is controlled by condensation growth. As the
bulk of particles is formed above the MLH, the condensa-tion growth is also larger there. In the mixing layer, the H2SO4concentration is mainly influenced by turbulent
dilu-tion. The decrease of H2SO4concentration within the CBL
in the afternoon corresponds to the cumulative condensation sink there. It should be noted, that the maximum of H2SO4
concentration in the ternary case is one order of magnitude lower than that in the binary case. This corresponds to the much higher condensation sink in the ternary case, resulting from nucleation at much higher rates.
The strong nucleation signal in the binary scenario is a con-sequence of the overprediction of the H2SO4 concentration
in the present simulation, which nearly exceeds the required threshold of ∼1010cm−3 predicted by the CNT. Neverthe-less, the characteristics and diurnal variation can be studied by means of the considered scenarios.
5.1.4 Particle number concentration
The evolution patterns of the particle number concentration are presented in Figs. 4c–f. The time-hight cross-sections of the UCN number concentration3for the binary case (Fig. 4c) and for the ternary one (Fig. 4d) correspond well to those for the considered nucleation rates (Figs. 4a and b, respectively). At first, due to higher efficiency of ternary nucleation the maximum UCN number concentration for the ternary case is three orders of magnitude higher than that for the binary one. Secondly, in the binary case there appears a well-defined burst pattern in the forenoon, characterised by a strong in-crease between 09:00 and 11:00 Local Standard Time (LST), reaching the maximum around noon, followed by a retarded decrease afterwards. The burst is initiated by the “blob”-like NPF event (Fig. 4a) just below the top of the growing CBL. Afterwards, newly formed particles were transported downward to the surface layer by CBL turbulence. Dur-ing the transport, newly formed particles were diluted and well-mixed throughout the CBL column. Once UCNs were formed, the UCN number concentration immediately begins to decrease due to intra-mode and inter-mode coagulation and deposition.
3As only mass and number concentration are predictive
vari-ables, the UCN size range is diagnostically determined. It is calcu-lated from the corresponding mode number and mass concentration after each integration time step. At the initial state, the particle radii
are r0,1=1×10⁻⁹m for the UCN mode, r0,2=10×10−9m for the
Aitken mode, r0,3=100×10−9m for the accumulation mode.
In the ternary case, the time-height evolution of UCN num-ber concentration (Fig. 4d) corresponds also quite well to the associated nucleation pattern. In the surface layer, the UCN number concentration starts to rise immediately after sun-rise due to in situ ternary nucleation. Following the “suck-ing tube”-like evolution pattern of the ternary nucleation rate (Fig. 4b), the UCN number concentration assumes a tempo-rally broadened maximum at the top of the model domain in the forenoon. From there, the UCN number concentra-tion decreases toward the CBL. Once captured by entrain-ment processes, newly formed particles enter the CBL, where they were diluted and well-mixed. Downward diffusion of entrained UCNs enhances the UCN number concentration in the surface layer. According to this scenario, NPF starts in situ in the surface layer in the early morning, afterwards enhanced by downward transport of entrained UCNs. Out-side the CBL, the UCN number concentration pattern is not blurred, because turbulent diffusion is small there. As for the binary case, the UCN concentration decreases within the CBL in the course of the day by intra-mode and inter-mode coagulation and deposition.
The time-height evolution patterns of the number concentra-tion of the Aitken mode (Fig. 4e) and accumulaconcentra-tion mode particles (Fig. 4f) for binary nucleation are nearly identical to those for ternary one (not shown). This is plausible, because coagulation with UCNs does not change the number concen-tration of pre-existing Aitken mode and accumulation mode particles. The particle number in the corresponding larger modes is conserved when larger particles collide with smaller ones. The time-height cross-sections of the respective parti-cle number concentrations correspond well to the CBL evo-lution. At the initial state, the number concentrations of pre-existing Aitken mode and accumulation mode particles de-crease with height. In the surface layer, the Aitken mode number concentration already decreases due to deposition at night-time. Because of the particle size dependency of the deposition velocity, deposition of accumulation mode parti-cles is much smaller. When turbulence set in, the pre-existing Aitken mode and accumulation mode particles are diluted throughout the mixing layer, leading to well-mixed vertical distributions. The temporal decrease of the particle number concentration in both modes is due to intra-mode and inter-mode coagulation. The impact of the particle radius onto the coagulation coefficient results in only very small differences in the coagulation loss between the binary and the ternary case. The particle radius is diagnostically determined from particle number and mass concentration. For Aitken mode particles, the coagulation loss is slightly enhanced for the ternary case compared to the binary one. However, for accu-mulation mode particles there are no observable differences between the evolution patterns of the binary and ternary case, respectively.
4240 O. Hellmuth: Burst modelling
O. Hellmuth: Burst modelling 19
(a) 3 6 9 12 15 18 Time [h] 0 300 600 900 1200 1500 1800 H ei g h t [m ] 0.0*100 7.8*10-10 1.6*10-9 2.3*10-9 3.1*10-9 3.9*10-9 [M1] [kg / m3] (b) 3 6 9 12 15 18 Time [h] 0 300 600 900 1200 1500 1800 H ei g h t [m ] 0.0*100 8.0*10-10 1.6*10-9 2.4*10-9 3.2*10-9 4.0*10-9 [M1] [kg / m3] (c) 3 6 9 12 15 18 Time [h] 0 300 600 900 1200 1500 1800 H ei g h t [m ] 0.0*100 1.1*10-11 2.1*10-11 3.2*10-11 4.3*10-11 5.3*10-11 [M2] [kg / m3] (d) 3 6 9 12 15 18 Time [h] 0 300 600 900 1200 1500 1800 H ei g h t [m ] 0.0*100 4.6*10-13 9.0*10-13 1.4*10-12 1.8*10-12 2.2*10-12 [M2] [kg / m3] (e) 3 6 9 12 15 18 Time [h] 0 300 600 900 1200 1500 1800 H ei g h t [m ] 0.0*100 6.3*10-11 1.2*10-10 1.7*10-10 2.3*10-10 2.8*10-10 [M3] [kg / m3] (f) 3 6 9 12 15 18 Time [h] 0 300 600 900 1200 1500 1800 H ei g h t [m ] 7.9*10-12 1.9*10-11 3.0*10-11 4.0*10-11 5.1*10-11 6.2*10-11 [M3] [kg / m3]
Fig. 5 First-order moments of physico-chemical variables: (a) UCN mass concentration - binary case; (b) UCN mass concentration - ternary case; (c) Aitken mode mass concentration - binary case; (d) Aitken mode mass concentration - ternary case; (e) Accumulation mode mass concentration - binary case; (f) Accumulation mode mass concentration - ternary case
www.atmos-chem-phys.org/acp/0000/0001/ Atmos. Chem. Phys., 0000, 0001–26, 2006
Fig. 5. First-order moments of physicochemical variables: (a) UCN mass concentration – binary case; (b) UCN mass concentration – ternary case; (c) Aitken mode mass concentration – binary case; (d) Aitken mode mass concentration – ternary case; (e) Accumulation mode mass concentration – binary case; (f) Accumulation mode mass concentration – ternary case.
5.1.5 Particle mass concentration
The evolution patterns of the mass concentration are de-picted in Figs. 5a–f.
The mass concentrations of UCN mode, Aitken mode and accumulation mode particles significantly differ for binary and ternary nucleation, respectively. The time-height cross-section of the UCN mass concentration in the binary case (Fig. 5a) corresponds well to the pattern of the H2SO4
concentration (Fig. 3e) and the UCN number concentration (Fig. 4c). A significant gain of particle mass by H2SO4
condensation can be firstly observed after UCN number con-centration has exceeded its maximum. Hence, the temporal progression of cleansing the CBL from condensable H2SO4
vapour for binary nucleation might be thought as follows:
1. Increase of the OH concentration after sunrise;
2. Initiation of H2SO4 production with subsequent
ex-ceedance of a critical H2SO4vapour threshold;
O. Hellmuth: Burst modelling 4241 3. Onset of an elevated “blob”-like nucleation burst
just below the top of the developing CBL, followed by turbulence-induced downward transport of UCNs, which leads to a well-mixed vertical UCN profile; 4. Subsequent increase of the UCN number concentration
throughout the CBL until a certain level for initiation of condensation growth has been reached;
5. Onset of significant UCN mass accumulation due to H2SO4condensation throughout the entire CBL;
6. Decrease of the UCN number concentration due to intra-mode and inter-mode coagulation, decrease of the H2SO4vapour concentration due to deposition loss of
vapour molecules onto newly formed particles, pre-existing Aitken mode and accumulation mode particles, leading to a cleansing of the CBL from condensable vapours.
For the ternary case, the evolution pattern of UCN mass con-centration (Fig. 5b) is qualitatively similar to that for the bi-nary case (Fig. 5a), except for the start-up phase of conden-sation growth. The difference between the daytime maxima of the UCN mass concentrations is small. However, due to in situ ternary nucleation occurring in the surface layer in the early morning, a much higher UCN number concentration compared to the binary case is available to serve as a conden-sation sink at that time. Hence, mass accumulation by H2SO4
condensation growth can start earlier. Owing to the formation of new particles above the CBL, mass accumulation occurs also there. Nonetheless, the mass accumulation within the CBL exceeds that in the free troposphere, since much more condensable vapour is available within the CBL, which orig-inates from low-level emission of the precursor gas SO2and
subsequent photooxidation to produce H2SO4vapour. CBL
turbulence ensures, that condensation sinks and condensable vapour are well-mixed throughout the CBL, hence vertically homogenising the UCN mass distribution within the mixing layer.
The differences in the UCN number concentrations for the binary and ternary case, respectively, lead to corresponding differences in the mass concentrations of pre-existing Aitken mode (cf. Figs. 5c, d) and accumulation mode particles (cf. Figs. 5e, f). Aitken mode particles serve as a coagulation sink for UCNs and as a deposition sink for H2SO4vapour.
Accu-mulation mode particles serve as a coagulation sink for both UCNs and Aitken mode particles and as a deposition sink for H2SO4vapour. Hence, differences in UCN number
concen-tration propagate upward across the mode cascade to affect the larger size modes, i.e., changes in UCN number concen-tration influence the Aitken and accumulation mode, even small4.
4Example: Assuming some non-linear dependency y
j=fj(xi)
between a set of dependent variables yj, j =1, . . ., N and a set of
This can be seen in the mass concentrations of the Aitken mode and accumulation mode particles. In the ternary case, the maximum mass concentration of both modes is somewhat lower compared to the corresponding binary cases. This can be explained by the lower supply with condensable vapour in the ternary case (see H2SO4concentration in Figs. 3e, f),
originating from larger nucleation loss of H2SO4molecules
to form a critical embryo. In the ternary case, more H2SO4
molecules are consumed in the formation of new embryos rather than condensed onto the pre-existing particle sur-face. We must remember, that the number concentration of pre-existing particles was chosen to be very low at the initial state. The net accumulation of H2SO4vapour in these modes
competes with that in the UCN mode, and uncertainties in the H2SO4vapour evolution may become crucial in the mass
bal-ance of the pre-existing particles. Anyway, the main differ-ence between the time-height evolution of the Aitken mode and accumulation mode concentration of the binary and the ternary case, respectively, consists in the earlier begin of the mass accumulation. The explanation of the quantitative dif-ferences deserves further investigations.
5.2 Second-order moments 5.2.1 Remarks
From the large number of predictive second-order moments only those are depicted, which can be interpreted with re-spect to NPF events in the CBL. In opposite to the meteo-rological variables, empirical findings on second-order mo-ments of physicochemical variables are still very rare. How-ever, the simulation results will be compared with previous findings as far as possible.
5.2.2 Turbulent vertical flux
Although not possible to be verified by observations, the tur-bulent vertical flux of total NH3(Fig. 6a) and SO2(Fig. 6b)
corresponds well to the flux pattern of non-reactive scalars expectable in the CBL. In both cases, the flux is always pos-itive within the CBL in the course of the day except for the lowest half-level, where it becomes negative owing to dry deposition. The turbulent transport is upward directed, be-cause the chemical species were released into the surface layer. Hence, the concentrations of the species decrease with height.
The vertical flux pattern of the pseudo-reactive H2SO4
vapour is much more complicated and reveals strong dif-ferences between the binary (Fig. 6c) and the ternary case
independent variables xi, i=1, . . ., n. Then, the change of yj due
to variations in xican be approximated according to the law of
er-ror propagation, i.e., 1yj≈
n P
i
(∂fj/∂xi)1xi. Here, 1yj are the
differences in yj resulting from differences (“errors”) in xi. The
sensitivity of yj against xi depends on the first partial derivatives
4242 O. Hellmuth: Burst modelling
20 O. Hellmuth: Burst modelling
(a) 3 6 9 12 15 18 Time [h] 0 300 600 900 1200 1500 1800 H ei g h t [m ] -1.6*1015 -7.7*1014 9.2*1013 9.6*1014 1.8*1015 2.7*1015 ' NH3,tot' [(m/ s) (molecules / m3)] (b) 3 6 9 12 15 18 Time [h] 0 300 600 900 1200 1500 1800 H ei g h t [m ] -2.8*1015 -1.2*1015 4.3*1014 2.0*1015 3.7*1015 5.3*1015 ' SO2' [(m/ s) (molecules / m3)] (c) 3 6 9 12 15 18 Time [h] 0 300 600 900 1200 1500 1800 H ei g h t [m ] -8.6*1013 -5.1*1013 -1.5*1013 2.1*1013 5.6*1013 9.2*1013 ' H2SO4' [(m/ s) (molecules / m3)] (d) 3 6 9 12 15 18 Time [h] 0 300 600 900 1200 1500 1800 H ei g h t [m ] -8.6*1012 -4.2*1012 1.2*1011 4.5*1012 8.8*1012 1.3*1013 ' H2SO4' [(m/ s) (molecules / m3)] (e) 3 6 9 12 15 18 Time [h] 0 300 600 900 1200 1500 1800 H ei g h t [m ] -1.1*108 -8.2*107 -5.0*107 -1.9*107 1.2*107 4.3*107 ' 1' [(m/ s) (# / m3)] (f) 3 6 9 12 15 18 Time [h] 0 300 600 900 1200 1500 1800 H ei g h t [m ] -1.6*1010 -1.2*1010 -6.9*109 -2.1*109 2.6*109 7.4*109 ' 1' [(m/ s) (# / m3)]
Fig. 6 Turbulent vertical fluxes of physico-chemical species: (a) Total ammonia flux; (b) Sulphur-dioxide flux; (c) Sulphuric-acid flux - binary case; (d) Sulphuric-acid flux - ternary case; (e) UCN-number concentration flux - binary case; (f) UCN-number concentration flux - ternary case
Atmos. Chem. Phys., 0000, 0001–26, 2006 www.atmos-chem-phys.org/acp/0000/0001/
Fig. 6. Turbulent vertical fluxes of physicochemical species: (a) Total NH3flux; (b) SO2flux; (c) H2SO4flux – binary case; (d) H2SO4flux
– ternary case; (e) UCN number concentration flux – binary case; (f) UCN number concentration flux – ternary case. (Fig. 6d). In the binary case, the initial vertical flux is zero
at all heights. When CBL turbulence sets in, the vertical flux becomes greater zero, indicating a weak upward trans-port of H2SO4 vapour. Later on, when CBL turbulence
in-tensifies, a shallow layer of downward directed turbulent flux forms in the lowest model layers while above the pos-itive flux strengthens. Between 09:00 and 12:00 LST, the photochemically produced H2SO4vapour concentration
ex-ceeds its maximum and shows a well-mixed vertical dis-tribution throughout the CBL. The occurrence of the pos-itive flux maximum spatio-temporally coincides with the “blob”-like binary nucleation event (Figs. 4a, c). The level of
“zero flux” represents the location of an “apparent pseudo-reaction source” (net source), from which H2SO4 vapour
is upward and downward diluted by turbulence. The verti-cal flux of H2SO4vapour weakens, when condensation and
“self-cleansing” of the CBL set in. In the late afternoon, a secondary positive flux maximum forms. We keep in mind, that the flux evolution of H2SO4vapour is not only affected
by turbulent diffusion, but also by higher-order moments, re-sulting from physicochemical interaction terms in the gov-erning equations.
O. Hellmuth: Burst modelling 4243 For the ternary case, the evolution pattern of H2SO4vapour
flux (Fig. 6d) quantitatively differs from that for the binary one, but the basic features qualitatively agree. When ternary nucleation starts in the early morning in the surface layer, a similar vertical downward/upward flux pattern as in the binary case appears there, but at a smaller time and spatial scale. This supports the assumption, that the vertical flux layering is strongly related to the nucleation loss of H2SO4
molecules. In opposite to the binary case, the vertical flux evolves later on toward a primary positive maximum throughout the CBL, except for the surface layer. While in the binary case the vertical flux suddenly decreases, when condensation loss of H2SO4vapour onto particles becomes
important, in the ternary case it does not. This is due to the lower impact of condensation loss onto newly formed particles in the CBL of the ternary case. In the ternary case, new particles were mainly formed above the CBL.
Hence, the evolution pattern of the H2SO4vapour flux can
be generalised as follows:
1. Appearance of a vertical two-layer H2SO4flux pattern
(downward/upward flux) in the pre-nucleation phase and during the NPF event;
2. Occurrence of a subsequent upward directed H2SO4
vapour flux in the post-nucleation phase, when conden-sation growth dominates.
The absolute values of the vertical flux as well as the ex-tension and spatio-temporal distribution of the flux minima and maxima in the evolution pattern are strongly affected by physicochemical interactions, which are related to nucleation and condensation loss of H2SO4 vapour molecules. These
interactions, represented by additional correlation terms, are usually neglected in diagnostic downgradient-flux parame-terisations. A comparison with the plain structure of the time-height cross-sections of NH3 (Fig. 6a) and SO2 (Fig. 6b)
shows, that the additional correlation terms, resulting from the gas-aerosol-turbulence interaction and appearing in the governing equation of the H2SO4 flux, may have a
signifi-cant impact on the flux evolution. This happens especially, when highly non-linear processes such as nucleation and condensation are involved. For the time being, a direct ver-ification of the flux of H2SO4vapour is not possible due to
lack of corresponding observational data. It should be noted, that the vertical profiling of H2SO4 vapour concentrations
in the CBL is hard to realise, especially the measurement of highly resolved spatio-temporal data series of that pre-cursor gas to derive flux profiles. Perhaps, the present mod-elling approach provides some motivation for future studies to determine high-order moments, involving physicochemi-cal species from in situ measurements and/or remote sensing.
The time-height evolution patterns of the turbulent vertical flux of the UCN number concentration for the binary case (Fig. 6e) and for the ternary one (Fig. 6f) are closely cor-related to the corresponding evolution patterns of the nucle-ation rates (Figs. 4a, b) and the UCN number concentrnucle-ations (Figs. 4c, d). In the binary case, the location of the “zero UCN flux” level coincides well in time and space with the “blob”-like source of newly formed particles (Fig. 4a). From there, the bulk of UCNs is transported downward (w0N0
1<0),
a certain part is transported upward (w0N0
1>0) and diluted
throughout the entrainment layer. It will be shown below, that this downward directed flux leads to a sudden enhancement of the UCN number concentration in the surface layer, rep-resenting the “NPF burst” in a closer sense. According to the binary scenario conceived here, this burst does not originate from in situ nucleation within the surface layer. It can be as-cribed to downward transport of UCNs, recently formed in the upper third of the forenoon CBL.
In the ternary case, the flux pattern (Fig. 6f) reflects the evo-lution of the NPF event (Figs. 4b, d) very good. Here, the above-described downward/upward flux layering occurs in the early morning, when the CBL just starts to rise. Hence, the downward flux is restricted to occur in the lowest model layers, i.e., at lower time and spatial scales. Once in situ formed there, UCNs are immediately transported downward to the surface and upward to the entrainment layer by the developing CBL turbulence. This flux pattern corresponds well to that in the binary case, except for its smaller time and spatial scale. Shortly after initial NPF at low levels, the lower end of the “sucking tube”-like NPF pattern above the CBL merges with the preceding in situ nucleation event. The subsequent downward transport of UCNs, continuing during the forenoon, reflects the dilution of entrained UCNs from above. The absolute minimum of the UCN flux (correspond-ing to the absolute maximum of the downward directed flux) appears, when the UCN “sucking tube” enters the MLH and it is captured by CBL turbulence. Afterwards, the downward flux decreases with the decreasing number concentration of entrained UCNs. Supposed, that the time-height evolution of the UCN formation rate is appropriately represented by the parameterisation of the ternary nucleation rate, the vertical UCN flux pattern in Fig. 6f consistently behaves with re-spect to CBL turbulence and to the evolution of the UCN number concentration. Apart from the pattern differences, the absolute value of the UCN flux for the ternary case is by several orders of magnitude larger than that for the bi-nary case. While CBL turbulence is identical in both cases, the turbulent vertical flux of UCN number concentration is higher for the ternary case.
4244 O. Hellmuth: Burst modelling 5.2.3 Cross-correlations
θ0NH
3,tot0 (Fig. 7a): In the entrainment layer the
poten-tial temperature and the total NH3 concentration are
anti-correlated (θ0NH
3,tot0<0), indicating entrainment of
poten-tially warmer but NH3-depleted free-tropospheric air into
the CBL and/or detrainment of potentially colder but NH3
-enriched CBL air into the free troposphere. q0NH
3,tot0(Fig. 7b): The water vapour mixing ratio and the
total NH3concentration are positively correlated in the
en-trainment layer (q0NH
3,tot0>0), resulting from entrainment
of drier and NH3-depleted free-tropospheric air into the CBL
and/or detrainment of moister and NH3-enriched CBL air
into the free troposphere. θ0H
2SO40(Figs. 7c, d): The correlation patterns of potential
temperature and H2SO4 vapour for the binary and ternary
case are very different. In the binary case, the correlation in the entrainment layer changes its sign in the course of the day (Fig. 7c). In the forenoon, H2SO4 vapour is
pho-tochemically produced in the CBL, exceeding its maximum there (Fig. 3e). Hence, during the oxidation time, turbulence causes entrainment of potentially warmer but H2SO4
vapour-depleted free-tropospheric air and/or detrainment of poten-tially colder but H2SO4 vapour-enriched CBL air into the
free troposphere (θ0H
2SO40<0). Later on, after nucleation
had occurred, condensation sink becomes more and more important, leading to a decrease of H2SO4 vapour within
the CBL. Above the CBL, the UCN concentration and the condensation sink for H2SO4vapour are quite low. As a
re-sult, the H2SO4vapour concentration in the free troposphere
is slightly higher compared to that in the CBL. Under such circumstances, turbulence leads to the entrainment of poten-tially warmer and H2SO4vapour-enriched free-tropospheric
air into the CBL and/or detrainment of potentially colder and H2SO4 vapour-depleted CBL air into the free troposphere
(θ0H
2SO40>0). Thus, the time, when the cross-correlation
changes its sign during the day, indicates the moment, when the H2SO4vapour condensation sink becomes important. In
the ternary case, the corresponding correlation in the entrain-ment layer remains negative during the day, showing a well-distinct absolute minimum in the early morning, which is separated from a second, more extended one lasting from the forenoon until the afternoon (Fig. 7d). The zone of anti-correlation is related to the entrainment of potentially warmer but H2SO4 vapour-depleted free-tropospheric air into the
CBL and/or to detrainment of potentially colder but H2SO4
vapour-enriched CBL air into the free troposphere. As the ternary nucleation exceeds its maximum outside the CBL, the H2SO4vapour condensation sink assumes its maximum
also there. Hence, the H2SO4 vapour concentration in the
CBL remains always higher than in the free troposphere (Fig. 3f). The transition between the two pronounced
anti-correlation periods, appearing at around 07:00 LST, marks the temporal crossover from in situ NPF in the morning sur-face layer to the forenoon entrainment of UCNs, recently formed above the CBL and downward transported from there. At the crossover time, H2SO4 vapour condensation
sink becomes important, leading to a decrease of H2SO4
vapour concentration. Shortly after the “sucking tube” of the UCN pattern (Fig. 4d) has entered the surface layer from above, the H2SO4vapour concentration increases again.
q0H
2SO40(Figs. 7e, f): The correlation of water vapour
mix-ing ratio and H2SO4 vapour corresponds very well to the
θ0H
2SO40 pattern. Considering, that potential temperature
and water vapour mixing ratio are anti-correlated through-out the entrainment layer, the “quasi-reversed” behaviour of the corresponding pattern pairs Figs. 7c, e and Figs. 7d, f is self-evident.
θ0N0
1 (Figs. 8a, b): The evolution patterns of the
cross-correlation of potential temperature and UCN number con-centration for the binary and ternary case are quite differ-ent. For binary nucleation, the potential temperature and UCN number concentration are anti-correlated in the entrain-ment layer (Fig. 8a), i.e., low potential temperature favours the occurrence of UCNs. The location and time of occur-rence of the absolute minimum of θ0N0
1 coincide with the
NPF event. This reflects the dependency of the nucleation rate on temperature. More importantly, the positive correla-tion within the entrainment layer during the day indicates detrainment of potentially colder but UCN-enriched CBL air into the free troposphere and/or entrainment of poten-tially warmer but UCN-depleted free-tropospheric air into the CBL. For the ternary case, the absolute minimum of θ0N0
1
in the early morning corresponds well to the low-level in situ formation of NPF (Fig. 8b). The subsequent positive corre-lation of potential temperature and UCN number concentra-tion reflects the entrainment of potential warmer and UCN-enriched residual layer air into the CBL, the latter resulting from ternary nucleation above.
q0N0
1(Figs. 8c, d): For the binary case, the water vapour
mix-ing ratio is positively correlated with the UCN number con-centration in the entrainment layer (Fig. 8c). This behaviour is inverse to the θ0N0
1correlation pattern (Fig. 8a) and can
be partially ascribed to the enhancement of nucleation due to increased humidity. But mainly, the concurrence of the posi-tive correlation with the entrainment layer indicates entrain-ment of drier and UCN-depleted free-tropospheric air into the CBL and/or detrainment of moister and UCN-enriched CBL air into the free troposphere. The inverse behaviour of the correlation patterns appearing in the θ0N0
1and q
0N0
1
time-height cross-sections of the binary case can be seen also in the ternary case (Figs. 8b, d). In the early morning, the water vapour mixing ratio is positively correlated with the UCN number concentration (Fig. 8d), showing
O. Hellmuth: Burst modelling 4245
O. Hellmuth: Burst modelling 21
(a) 3 6 9 12 15 18 Time [h] 0 300 600 900 1200 1500 1800 H ei g h t [m ] -1.2*1016 -9.5*1015 -7.0*1015 -4.5*1015 -2.0*1015 5.4*1014 ' NH3,tot' [K (molecules / m3)] (b) 3 6 9 12 15 18 Time [h] 0 300 600 900 1200 1500 1800 H ei g h t [m ] -1.8*1011 4.8*1012 9.7*1012 1.5*1013 2.0*1013 2.4*1013 ' NH3,tot' [(kg / kg) (molecules / m3)] (c) 3 6 9 12 15 18 Time [h] 0 300 600 900 1200 1500 1800 H ei g h t [m ] -6.2*1014 -4.6*1014 -2.9*1014 -1.3*1014 3.8*1013 2.0*1014 ' H2SO4' [K (molecules / m3)] (d) 3 6 9 12 15 18 Time [h] 0 300 600 900 1200 1500 1800 H ei g h t [m ] -4.2*1013 -3.4*1013 -2.5*1013 -1.6*1013 -8.0*1012 5.9*1011 ' H2SO4' [K (molecules / m3)] (e) 3 6 9 12 15 18 Time [h] 0 300 600 900 1200 1500 1800 H ei g h t [m ] -4.4*1011 -1.5*1011 1.5*1011 4.4*1011 7.3*1011 1.0*1012 ' H2SO4' [(kg / kg) (molecules / m3)] (f) 3 6 9 12 15 18 Time [h] 0 300 600 900 1200 1500 1800 H ei g h t [m ] -1.0*109 1.5*1010 3.1*1010 4.7*1010 6.3*1010 7.9*1010 ' H2SO4' [(kg / kg) (molecules / m3)]
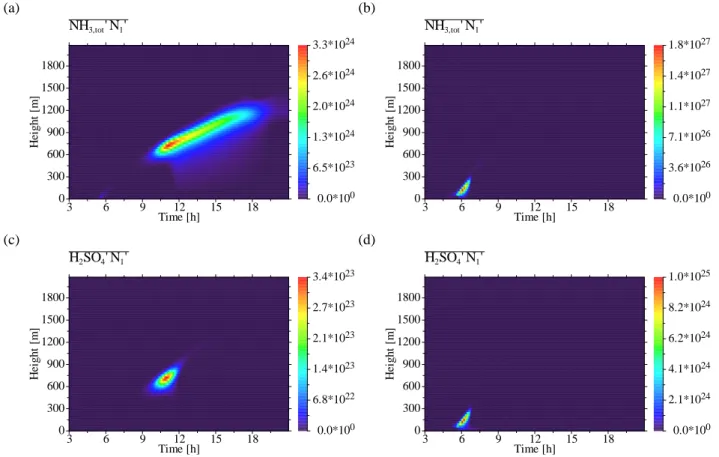
Fig. 7 Covariances of meteorological parameters and physico-chemical properties: (a) Covariance of potential temperature and total ammonia concentration; (b) Covariance of water-vapour mixing ratio and total ammo-nia concentration; (c) Covariance of potential temperature and sulphuric-acid concentration - binary case; (d) Covariance of potential temperature and sulphuric-acid concentration - ternary case; (e) Covariance of water-vapour mixing ratio and sulphuric-acid concentration - binary case; (f) Covariance of water-vapour mixing ratio and sulphuric-acid concentration - ternary case
Fig. 7. Co-variances of meteorological parameters and physicochemical properties: (a) Co-variance of potential temperature and total NH3
concentration; (b) Co-variance of water vapour mixing ratio and total NH3concentration; (c) Co-variance of potential temperature and
H2SO4concentration – binary case; (d) Co-variance of potential temperature and H2SO4concentration – ternary case; (e) Co-variance of
water vapour mixing ratio and H2SO4concentration – binary case; (f) Co-variance of water vapour mixing ratio and H2SO4concentration –
ternary case.
ence of ternary nucleation due to enhanced humidity at that time. Later on, entrainment of drier but UCN-enriched free-tropospheric air becomes dominant, leading to q0N0
1<0 in the
entrainment layer. Hence, the θ0N0
1and q0N
0
1evolution
pat-terns are consistent with the evolution of CBL turbulence and the supposed nucleation mechanism.
NH3,tot0N10 (Figs. 9a, b): The cross-correlations of total NH3
and UCN number concentration strongly differ between the binary and ternary case. In the binary case, the total NH3
concentration is positively correlated with UCN number con-centration in the entrainment layer after nucleation has oc-curred. This positive correlation in the late forenoon in-dicates detrainment of total NH3 and UCN-enriched CBL
free-4246 O. Hellmuth: Burst modelling
22 O. Hellmuth: Burst modelling
(a) 3 6 9 12 15 18 Time [h] 0 300 600 900 1200 1500 1800 H ei g h t [m ] -2.1*108 -1.7*108 -1.3*108 -8.2*107 -3.9*107 4.2*106 ' 1' [K (# / m3)] (b) 3 6 9 12 15 18 Time [h] 0 300 600 900 1200 1500 1800 H ei g h t [m ] -3.0*1010 -1.2*1010 4.6*109 2.2*1010 3.9*1010 5.6*1010 ' 1' [K (# / m3)] (c) 3 6 9 12 15 18 Time [h] 0 300 600 900 1200 1500 1800 H ei g h t [m ] -2.6*104 5.3*104 1.3*105 2.1*105 2.9*105 3.7*105 ' 1' [(kg / kg) (# / m3)] (d) 3 6 9 12 15 18 Time [h] 0 300 600 900 1200 1500 1800 H ei g h t [m ] -8.3*107 -5.7*107 -3.0*107 -4.0*106 2.3*107 4.9*107 ' 1' [(kg / kg) (# / m3)]
Fig. 8 Covariances of meteorological parameters and physico-chemical properties: (a) Covariance of potential temperatur and number concentration - binary case; (b) Covariance of potential temperatur and UCN-number concentration - ternary case; (c) Covariance of water-vapour mixing ratio and UCN-UCN-number concentration binary case; (d) Covariance of watervapour mixing ratio and UCNnumber conconcentration -ternary case
Atmos. Chem. Phys., 0000, 0001–26, 2006 www.atmos-chem-phys.org/acp/0000/0001/
Fig. 8. Co-variances of meteorological parameters and physicochemical properties: (a) Co-variance of potential temperature and UCN number concentration – binary case; (b) Co-variance of potential temperature and UCN number concentration – ternary case; (c) Co-variance of water vapour mixing ratio and UCN number concentration – binary case; (d) Co-variance of water vapour mixing ratio and UCN number concentration – ternary case.
tropospheric air depleted from total NH3and UCNs into the
CBL (NH3,tot0N10>0). The positive correlation sets firstly in,
when new particles were formed. The same happens also for the ternary case, but here the strongest positive correlation already occurs in the early morning, when the MLH is very low and the concentration of total NH3 from surface
emis-sion sources is relatively high.
H2SO40N10 (Figs. 9c, d): As for the antecedent correlation
pair, the cross-correlations of H2SO4vapour and UCN
num-ber concentration for the binary and ternary case strongly differ. In the binary case, we have H2SO40N10>0 with a
pronounced maximum in the forenoon just below the MLH (Fig. 9c), where binary NPF occurs (Figs. 4a, c). To enable nucleation to occur, the H2SO4 vapour concentration must
exceed a certain threshold (Fig. 3e). The positive correla-tion between H2SO4 vapour and UCN number
concentra-tion shows the entrainment of UCN-poor and H2SO4
vapour-poor free-tropospheric air into the CBL and/or detrainment of UCN-enriched and H2SO4vapour-enriched CBL air into
the free troposphere. In the ternary case, the H2SO40N10
cor-relation presented in Fig. 9d corresponds well to the pat-tern shown in Fig. 9b. The UCNs formed in situ in the
surface layer in the early morning are positively correlated with the H2SO4vapour, starting to form from
photooxida-tion of SO2 and OH. At that time, the SO2 concentration,
originating from surface emissions, is enhanced due to the low MLH. Even if the OH concentration is still low, H2SO4
vapour starts to form and fill the CBL reservoir until NPF sets in. Hence, H2SO40N10>0 occurring in the early morning
indicates turbulence-induced entrainment of H2SO4
vapour-poor and UCN-vapour-poor residual layer air into the growing CBL and/or detrainment of H2SO4 vapour-enriched and
UCN-enriched CBL air into the residual layer.
5.3 Physicochemical variables in the surface layer
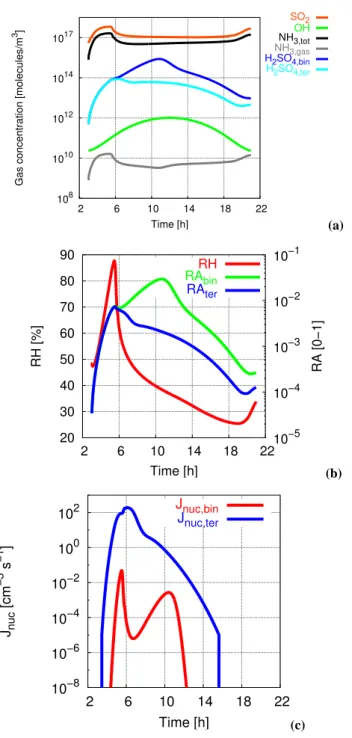
The time series of physicochemical variables in the surface layer are shown in Figs. 10 to 12.
The evolution of gas phase species near the surface is de-picted in Fig. 10a. The temporal development of SO2 and
total NH3 is controlled by the interplay between emission
and dilution. Owing to its larger emission strength, the con-centration of SO2is always higher than that of total NH3. In
the morning hours, the corresponding concentrations are en-hanced due to emission into the surface layer with weak