HAL Id: hal-02892675
https://hal.archives-ouvertes.fr/hal-02892675
Submitted on 7 Jul 2020HAL is a multi-disciplinary open access archive for the deposit and dissemination of sci-entific research documents, whether they are pub-lished or not. The documents may come from teaching and research institutions in France or abroad, or from public or private research centers.
L’archive ouverte pluridisciplinaire HAL, est destinée au dépôt et à la diffusion de documents scientifiques de niveau recherche, publiés ou non, émanant des établissements d’enseignement et de recherche français ou étrangers, des laboratoires publics ou privés.
Impact assessment of debris flows on structures using
discrete numerical modelling
Rime Chehade, Bastien Chevalier, Fabian Dedecker, Pierre Breul
To cite this version:
Rime Chehade, Bastien Chevalier, Fabian Dedecker, Pierre Breul. Impact assessment of debris flows on structures using discrete numerical modelling. Fifth International ITASCA Symposium: Applied Numerical Modeling in Geomechanics - 2020, Feb 2020, Wien, Austria. �hal-02892675�
Applied Numerical Modeling in Geomechanics – 2020 – Billaux, Hazzard, Nelson & Schöpfer (eds.) Paper: 14-03 ©2020 Itasca International, Inc., Minneapolis, ISBN 978-0-9767577-5-7
1 INTRODUCTION
Lahars are gravitational flows of sediment and water, originating from volcanoes. The term “Lahar” defines a flow type that can range from (1) dilute hyper-concentrated flows with a sediment concentration of 20% to 60% by volume, more turbulent to (2) debris flows having a higher concentration of 60% by volume, very poorly sorted (Manville 2013).
This paper focuses on the city of Arequipa (Peru), located 17 km of the summit of the El Misti volcano. Arequipa is exposed to many natural hazards, linked to the presence of volcanic ash and heavy rains occur-ring at the beginning of the year, ideal conditions to form lahars. This city hosts poor populations who mainly benefit from rudimentary masonry facilities. These infrastructures suffer from disorderly and poorly planned growth which makes them weak points when debris impact them (Mead 2017).
2 DESIGN AND ANALYSIS 2.1 Numerical approach
The study focuses on the modelling of impacts of boulders on structures by using distinct element method DEM which is the best approach as it allows a flow of particles to be modelled without any limitation in terms of displacements or rotations.
The solid phase corresponding to the boulders is modelled by PFC3D (Itasca 2016) software. We use spher-ical particles, with a uniform grain-size distribution, distributed between 0.10 and 0.40 m in diameter. A minimal size is fixed in order to limit the number of the smallest particles in the simulation. Numerical modelling is based on the DEM method, which does not allow explicit modelling of the fluid phase between the blocks. A procedure has been developed to account for the impact of the fluid on grain flow: we intro-duce a drag force and a buoyant force.
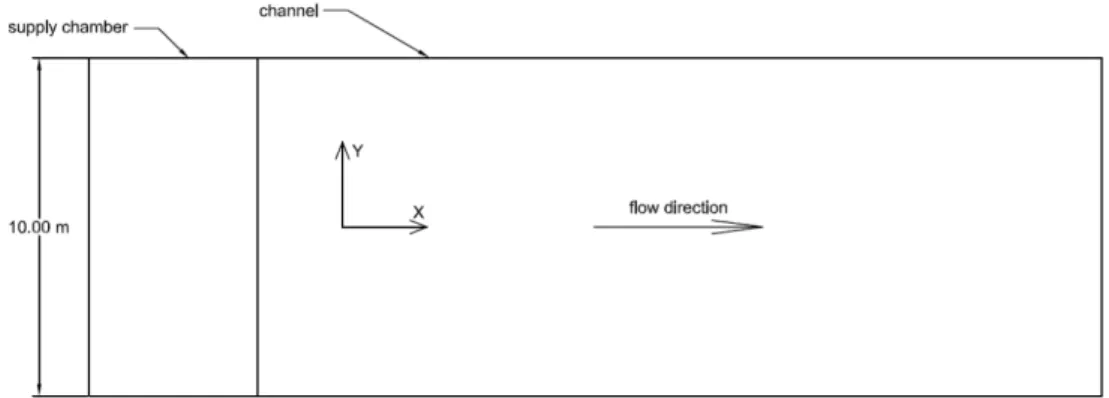
The fluid phase is a mixture of water with fine particles whose velocity depends on the geometry of the channel: (1) the fluid velocity is assumed to be constant for a linear channel with a constant cross-section, (2) the fluid velocity vectors are computed from another numerical model by using FLAC3D (Itasca 2017) software for a non-linear channel geometry. FLAC3D can be used to problems involving single-phase Darcy flow in a porous medium: we determine the component of the fluid velocity vectors in the channel. To fill the channel and reach a constant flow, a representative elementary volume (REV) is positioned in a supply chamber immediately at the entrance of the channel (Fig. 1). This REV exhibits the packing char-acteristics that blocks are supposed to adopt in the flow. All the blocks in the supply chamber move towards
Impact assessment of debris flows on structures using discrete numerical
modelling
Rime Chehade
1, Bastien Chevalier
1, Fabian Dedecker
2& Pierre Breul
11 Université Clermont Auvergne, CNRS, SIGMA Clermont, Institut Pascal, F-63000 Clermont-Ferrand, France 2 Itasca Consultants SAS, 64 Chemin des Mouilles, F-69134 Ecully Cedex, France
the channel entrance with a fixed velocity equal to the velocity of the fluid phase, in the direction of the channel axis. They can then move freely in the channel and fluid-block interactions are activated. The REV is repeated periodically to ensure a constant discharge of the blocks in the supply chamber and feed the channel.
Figure 1. Simulated channel for calibration step.
2.2 Model parameters
The debris flow characteristics are given in Table 1 (Mead 2017). These parameters can easily be set to different values in the model, and model parameters like flow rate, velocity and flow height can be modified if needed.
Table 1. Characteristics of debris flow.
Solid Fraction Density Discharge Velocity Flow height Froude number
50 vol% 1800 kg/m3 35 to 40 m3/s 3 m/s 1.5 m 0.78
To calibrate the numerical parameters, we start to model the flow with a simple geometry channel. The channel is straight with a rectangular cross-section and a slight slope (2%) in the direction of the channel axis. The channel width is fixed at 10 m. A channel length of 25 m is chosen in order to reach a stable flow. The supply chamber is located at the channel entrance and as soon as the blocks are out of the channel, they are removed from the model. A linear contact model is used for particle-particle and particle-wall contacts. A friction coefficient of 0.5 is applied to the particle-wall contacts. For particle-particle contact, different friction coefficients from 0.05 to 0.4 are tested. The boulders density varies between 2500 and 2700 kg/m3, which is close to the average density of the rock. To account for the effect of the actual block shape, which is non-spherical, a rolling resistance μr (dimensionless coefficient) is also considered to mimic the behavior of angular shapes. Different values from 0 to 0.6 are then tested. For the fluid phase, which is composed of water and the finest solid particles, different density values between 1000 and 2000 kg/m3 are considered and dynamic viscosity values between 0.03 and 0.07 Pa.s are used to calculate drag forces (Iverson 1997). 2.3 Model calibration
A 12 seconds flow simulation is then performed: this is the minimum time to fill the channel and reach a steady flow. A parametric study is carried out to analyze the influence of each parameters described above. Based on this parametric analysis, the fluid density is set at 1100 kg/m3, the dynamic viscosity at 0.048 Pa.s, the block density at 2500 kg/m3, the friction coefficient of particle-particle contact at 0.4 and the rolling resistance at 0.20. This set of parameters allows the desired flow to be achieved: a solid fraction of 54.7% by volume and an apparent density of 1867 kg/m3 are obtained, for a volume discharge of about 40 m3/s.
3 RESULTS AND DISCUSSION 3.1 A more complex channel geometry
Once the flow is calibrated for a simple channel section, the model is used to evaluate the forces induced by debris flows on buildings that would be located in or along the flow path. A channel shape with a recess is considered to account for changes in the orientation of buildings in relation to the flow direction. This recess has a width of 2 m (which increases the width of the canal from 10 to 12 m at 8 m from the entrance) and a length of 5 m.
3.2 Coupling DEM-Fluid
In the case of a constant cross section channel, the fluid velocity was constant. With a recess perpendicular to the channel, this hypothesis is not correct since the width of the channel is variable along the channel. In this case, a FLAC3D model is used to calculate the flow velocity vectors. The channel is modelled by a regular grid forming a simple mesh: cell size is fixed to 0.5 × 0.5 × 0.7 meter, in which the velocity vectors’ components (orientation and magnitude) of the fluid phase will be computed.
We simulated an incompressible flow in a porous media of given porosity whose permeability is estimated from the Kozeny-Carman equation (Itasca 2016). Of course, the mechanisms of lahar flow are more com-plex than the model used in FLAC3D to represent it: the particles will move along the fluid part and the flow regime are much more turbulent than those observed in porous media. However, we need a simple way to estimate the distribution of flow velocity across the channel, in order to drive particles. The perme-ability depends on the porosity that is calculated in PFC during the passage of the particles in the channel. The fluid density is the same as the simulated flow, 1100 kg/m3. As for the boundary conditions, a pressure is imposed at the entrance and exit of the channel: the purpose is to apply a pressure gradient between the inlet and the outlet sides until an equilibrium state is obtained. The inlet and outlet flow are measured regularly, and the calculation is stopped when the flow reaches an equilibrium state. The pressure gradient is then adapted in order to obtain the desired flow rate (3m/s). The fluid equilibrium conditions are therefore obtained in two steps: firstly, by considering an arbitrary-level pressure gradient, and secondly by adapting this gradient to reach the target flow.
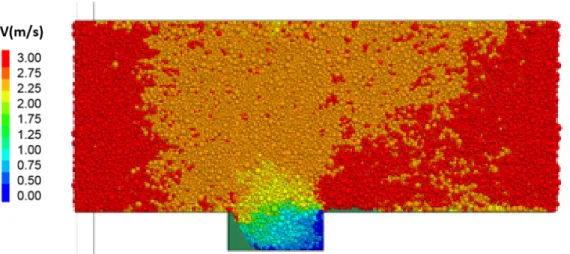
DEM modeling is performed for 12 s by considering constant porosity (and thus permeability in the flow model) all along the channel in order to fully fill the channel with blocks (Fig. 2). From 12 s, the porosity spatial distribution is computed in PFC3D model along the channel every 0.03 s to update permeability values in the flow model. As previously described, the flow simulation runs until the hydraulic equilibrium is reached, then the fluid velocity field are measured in each cell (Fig. 3). The flow velocity vectors are then returned to the DEM code to match with the new fluid flow conditions.
(a) Permeability field (depending on the porosity in b) Velocity field (color scale according to the velocity
each cell) magnitude in m/s) Figure 3. Results of the fluid phase modeling after a simulation time of 28 s.
3.3 Block impact stress measurement
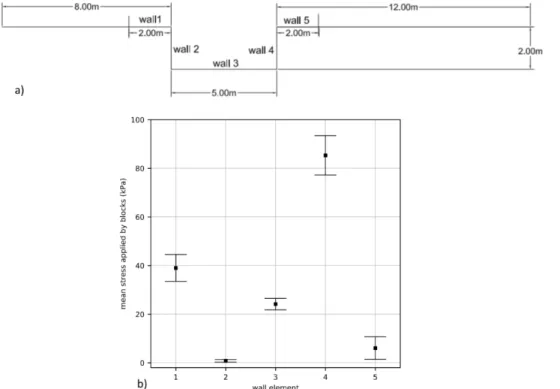
Near the recess, we defined five surface elements on which the impact stresses of the blocks are recorded as the flow runs through (Fig. 4a).
Figure 4b shows the mean stress applied by blocks on these wall elements and the vertical bars represents the standard deviation of the stress. The stress on wall 1 was high because it is located immediately at the entrance of the recess where the block speed highly increases. On wall 2, the stress was very low since only few particles are in contact with. The impact stress on the wall 3 was also low as it’s far from the main flow path. The highest impact stress is obtained on wall 4: the wall facing the flow on which the blocks are accumulated. Finally, the stress applied on wall 5 was low: at the exit of the recess, the blocks are carried towards the center of the channel according to the flow vectors orientation (Fig. 3b) which limits the stress on this wall.
Figure 4. (a) Location of the five surface elements. (b) Average normal stress induced by blocks on these five wall elements.
4 CONCLUSIONS
A distinct element numerical model of debris flow is designed and validated by calibrating the parameters to find the desired flow corresponding to the Arequipa’s sites. Once the discrete model is calibrated, a coupling continuum/discrete simulation is done for a more complex geometry, including a perpendicular street. This model is used to study the influence of a recess on the flow and to measure the stresses induced by the blocks on the structures located around the recess. These impact stresses can be added to the effect of the fluid phase by hydrostatic and/or dynamic pressure. Total impact pressure can be recovered and used to assess the vulnerability of structures.
REFERENCES
Itasca Consulting Group, Inc. 2016. PFC3D – Particle Flow Code in 3 Dimensions, Ver. 5.0 User’s Manual. Minne-apolis: Itasca.
Itasca Consulting Group, Inc. 2017. FLAC3D – Fast Lagrangian Analysis of Continua in 3 Dimensions, Ver. 6.0 User’s Manual. Minneapolis: Itasca.
Iverson, R.M. 1997. The physics of debris flows, Reviews of Geophysics, 35, 245-296.
Manville, V., Major, J. J. & Fagents, S.A. 2013. Chapter 14: Modeling lahar behavior and hazards, in: Fagents, S. A., Gregg, T. K. P., Lopes, R. M. C. (Eds) Modeling volcanic processes: the physics and mathematics of volcanism. Cambridge University Press, 300-330.
Mead, S.R., Magill, C., Lemiale, V., Thouret, J.-C. & Prakash, M. 2017. Examining the impact of lahars on buildings using numerical modeling. Natural Hazard and Earth System Sciences, 17, 703-719.