HAL Id: hal-02973625
https://hal.archives-ouvertes.fr/hal-02973625v2
Submitted on 7 May 2021
HAL is a multi-disciplinary open access
archive for the deposit and dissemination of
sci-entific research documents, whether they are
pub-lished or not. The documents may come from
teaching and research institutions in France or
abroad, or from public or private research centers.
L’archive ouverte pluridisciplinaire HAL, est
destinée au dépôt et à la diffusion de documents
scientifiques de niveau recherche, publiés ou non,
émanant des établissements d’enseignement et de
recherche français ou étrangers, des laboratoires
publics ou privés.
of prediction errors
Yi-Fang Hsu, Florian Waszak, Juho Strömmer, Jarmo A Hamalainen
To cite this version:
Yi-Fang Hsu, Florian Waszak, Juho Strömmer, Jarmo A Hamalainen.
Human brain ages with
hierarchy-selective attenuation of prediction errors. Cerebral Cortex, Oxford University Press (OUP),
2021, 31 (4), pp.2156-2168. �10.1093/cercor/bhaa352�. �hal-02973625v2�
© The Author(s) 2020. Published by Oxford University Press. All rights reserved. For permissions, please e-mail: [email protected]
This is an Open Access article distributed under the terms of the Creative Commons Attribution Non-Commercial License (http://creativecommons.org/ licenses/by-nc/4.0/), which permits non-commercial re-use, distribution, and reproduction in any medium, provided the original work is properly cited. For commercial re-use, please contact [email protected]
doi: 10.1093/cercor/bhaa352
Advance Access Publication Date: 1 December 2020 Original Article
O R I G I N A L A R T I C L E
Human Brain Ages With Hierarchy-Selective
Attenuation of Prediction Errors
Yi-Fang Hsu
1,2
, Florian Waszak
3,4
, Juho Strömmer
5
and
Jarmo A. Hämäläinen
5
1
Department of Educational Psychology and Counselling, National Taiwan Normal University, 106308 Taipei,
Taiwan,
2Institute for Research Excellence in Learning Sciences, National Taiwan Normal University, 106308
Taipei, Taiwan,
3Centre National de la Recherche Scientifique (CNRS), Integrative Neuroscience and Cognition
Center (INCC), Unité Mixte de Recherche 8002, 75006 Paris, France,
4Université de Paris, 75006 Paris, France and
5Jyväskylä Centre for Interdisciplinary Brain Research, Department of Psychology, University of Jyväskylä,
40014 Jyväskylä, Finland
Address correspondence to Yi-Fang Hsu, No.162, Sec. 1, Heping E. Rd, Da-an District, 106308 Taipei, Taiwan. Email: [email protected]
Abstract
From the perspective of predictive coding, our brain embodies a hierarchical generative model to realize perception, which proactively predicts the statistical structure of sensory inputs. How are these predictive processes modified as we age? Recent research suggested that aging leads to decreased weighting of sensory inputs and increased reliance on predictions. Here we investigated whether this age-related shift from sensorium to predictions occurs at all levels of hierarchical message passing. We recorded the electroencephalography responses with an auditory local–global paradigm in a cohort of 108 healthy participants from 3 groups: seniors, adults, and adolescents. The detection of local deviancy seems largely preserved in older individuals at earlier latency (including the mismatch negativity followed by the P3a but not the reorienting negativity). In contrast, the detection of global deviancy is clearly compromised in older individuals, as they showed worse task performance and attenuated P3b. Our findings demonstrate that older brains show little decline in sensory (i.e., first-order) prediction errors but significant diminution in contextual (i.e., second-order) prediction errors. Age-related deficient maintenance of auditory information in working memory might affect whether and how lower-level prediction errors propagate to the higher level.
Key words: aging, auditory perception, electroencephalography (EEG), prediction errors, predictive coding
Introduction
Predictive processing is fundamental to audition. This is because the auditory system essentially deals with sequential inputs, which contains relevant information in the imminent future. The predictive coding model of perception further delineates that the perceptual system uses a hierarchical generative model to proactively represent the statistical structure of sensory inputs (Friston 2005,2009;Egner et al. 2010;Feldman and Friston 2010; for reviews see Clark 2013; Heilbron and Chait 2018).
Specifically, perception involves the matching of a cascade of top-down predictions with sensory inputs, which aims to minimize prediction errors (or the inconsistency between anticipated and incoming signals) in the system.
How are these predictive processes modified as we age? Normal aging typically degrades precision of peripheral and central processing, which leads to decreased weighting of sen-sory inputs and increased reliance on predictions (Wolpe et al. 2016;Chan et al. 2017). Recent neurocomputational research
quantifying the synaptic coupling underlying the mismatch negativity (MMN) also found an age-related attenuation of learning-dependent increase in forward connectivity from primary auditory cortex speaking to a reduced sensitivity to ascending afferents of prediction errors (Moran et al. 2014) as well as an age-related increase of inhibitory effect at inferior frontal gyrus indicating increased firing rate of the inhibitory neurons (Cooray et al. 2014) over lifespan. It seems that older brains are less predisposed to updating the prior probability estimate, leading to a perception of the environment increasingly dominated by top-down information. In other words, age turns our brain into a stubborn prediction machine where the sensorium is weighted less to optimize predictions. This is consistent with reports on age-related shifts in neuronal recruitment from sensory to frontal regions (Davis et al. 2008).
However, it is currently unclear whether this age-related shift from sensorium to predictions occurs at all levels of hierarchical message passing, which includes sensory (i.e., first-order) predictions and contextual (i.e., second-order) predictions. A well-established auditory local–global paradigm (Bekinschtein et al. 2009) probing auditory prediction at 2 hierarchical levels of deviancy found that the detection of local/global deviancy involves distinct neuronal systems (Wacongne et al. 2011;
Chennu et al. 2013;El Karoui et al. 2015). Local deviancy elicited the MMN (regardless of participants’ task), which reflects a preattentive, automatic, and nonconscious response to a first-order violation of participants’ expectation constructed on the basis of recent sensory history. It originated from a restricted network involving bilateral Heschl’s gyrus, superior temporal gyrus, and frontal region at a smaller extent (Chennu et al. 2016; for reviews see Alho 1995) with a slight delay (Rinne et al. 2000). Global deviancy, on the other hand, elicited the P3b (only when participants were aware of the violations of global regularities), which reflects a second-order violation of participants’ expectation of a given contextual rule. It is thought to index conscious access and updating in working memory (Donchin and Coles 1988;Polich 2004,2007). Its putative generators involve a brain-scale cortical network including prefrontal, parietal, temporal, and cingulate regions (Tarkka et al. 1995; Polich 2004, 2007; Patel and Azzam 2005). Such dissociation of the consciousness-independent/-dependent capacity to hierarchically predict the local/global structure of the auditory environment is shared by human (Faugeras et al. 2011,2012;King et al. 2013;Strauss et al. 2015) and nonhuman primates (Uhrig et al. 2014,2016).
An indiscriminate age-related shift from sensorium to pre-dictions should be associated with reduced MMN and P3b, sig-naling reduced prediction errors due to decreased weighting of sensory inputs at both sensory and contextual levels. Neverthe-less, conclusions are difficult to draw from the literature. Pre-vious research examining the age-related changes in the MMN yielded equivocal results. While some studies found no evidence of age-dependent attenuation of the MMN (Pekkonen et al. 1993,
1996;Schroeder et al. 1995;Gunter et al. 1996;Kazmerski et al. 1997;Amenedo and Díaz 1998), other studies found seniors to exhibit a smaller MMN (Czigler et al. 1992;Gaeta et al. 1998,2001;
Alain and Woods 1999;Cooper et al. 2006;Schiff et al. 2008). The lack of consensus was likely due to variations in how partici-pants’ attention was monitored, the length of the stimulus onset asynchrony (SOA), etc., making it difficult to judge whether age attenuates the first-order prediction errors. On the other hand, while P3b was commonly reported to show age-related changes in its amplitude, latency, and topography (Schiff et al.
2008;van Dinteren et al. 2018; for reviews seeFriedman et al. 1997;Friedman 2003), its measurement was usually based on the classification of the auditory deviant/standard stimuli that first elicited the MMN. Therefore, it remains undetermined to what extent the P3b unconfoundedly reflects the second-order prediction errors.
To test whether the age-related shift from sensorium to predictions is hierarchy selective, here we recorded the electroencephalography (EEG) responses with an auditory local– global paradigm, which orthogonally manipulated local (i.e., first-order) and global (i.e., second-order) regularities (Fig. 1). In a cohort of 108 healthy participants from 3 groups: seniors (≥55 years old), adults (19–54 years old), and adolescents (≤18 years old), we found that older brains show little decline in the MMN signaling sensory (i.e., first-order) prediction errors but significant diminution in the P3b signaling contextual (i.e., second-order) prediction errors, which is related to deficient maintenance of auditory information in working memory.
Materials and Methods
Participants
A total of 108 healthy volunteers including 36 seniors (age between 55 and 82 years, mean = 65.31, standard deviation [SD] = 7.03), 36 adults (age between 19 and 27 years, mean = 21.17, SD = 2.01), and 36 adolescents (age between 15 and 18 years, mean = 16.97, SD = 0.81) participated in the experiment with no history of neurological, neuropsychiatric, or visual/hearing impairments as indicated by self-report. Participants provided us with information about their gender, handedness, level of education, and marital status. Participants gave written informed consent and were paid for participation. The study was conducted in accordance with the Declaration of Helsinki and approved by the Research Ethics Committee at National Taiwan Normal University. A power analysis was conducted in G∗Power 3.1.9.7 (Faul et al. 2007,2009) using a model for 1-way analysis of variance (ANOVA) with 3 groups, each with a sample size of 36. With alpha set at 0.05, the power to detect a medium-sized effect (f = 0.25) was 0.63 and the power to detect a large-sized effect (f = 0.40) was 0.96.
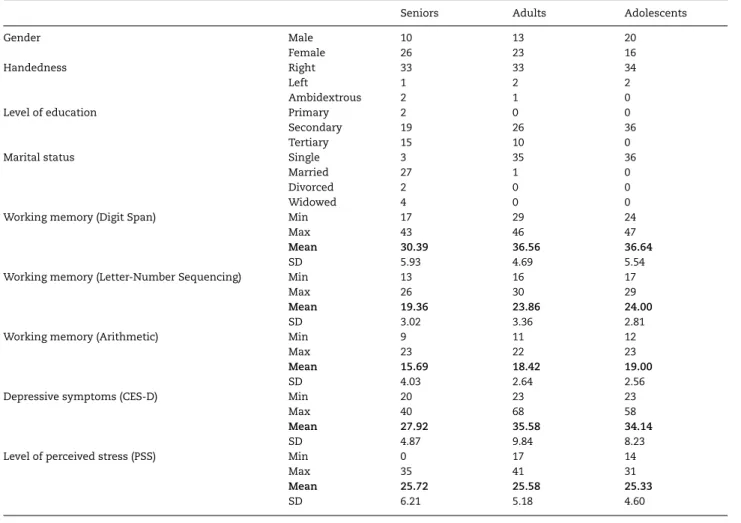
Participants underwent a neuropsychological evaluation of cognitive functions. Their working memory was measured with 3 subtests in Wechsler Adult Intelligence Scale-Fourth Edition, including Digit Span, Letter-Number Sequencing, and Arithmetic. Their depressive symptoms were measured with the Center for Epidemiological Studies-Depression (CES-D) scale (Radloff 1977;Chien and Cheng 1985). It is a 20-item self-report scale that asks one to rate how often over the past week he/she experienced symptoms associated with depression. Response options range from 1 to 4 for each item (1 rarely or none of the time [<1 day], 2 some or little of the time [1–2 days], 3 occasionally or a moderate amount of time [3–4 days], 4 most or all of the time [5–7 days]). Their level of perceived stress was measured with the Perceived Stress Scale (PSS) (Cohen et al. 1983;Chu 2005). It is a 14-item self-report scale that asks about one’s feelings and thoughts during the last month. Response options range from 0 to 4 for each item (0 never, 1 almost never, 2 sometimes, 3 fairly often, 4 very often). All tests were administered and scored by a licensed counseling psychologist according to standard procedures. Demographic characteristics and cognitive functions of the participants are summarized in
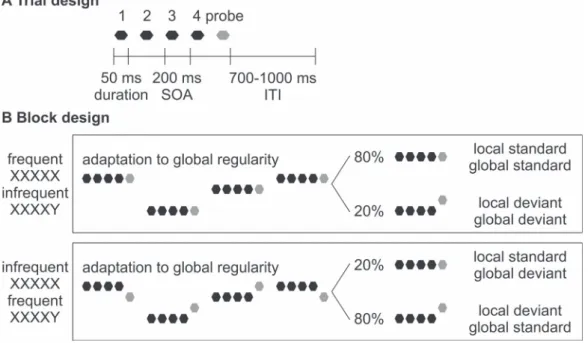
Figure 1. Schematic illustration of the auditory local–global paradigm. (A). On each trial, 5 sinusoidal tones of 50-ms duration were presented with a 200 ms SOA. Each trial was followed by a jittered ITI of 700–1000 ms. (B). In each block, 2 different types of tone quintets were presented, the first using the 5-time repetition of the same tone (i.e., XXXXX) and the second with a change in the last tone (i.e., XXXXY). Half of the blocks contained frequent repetition and infrequent change in the last tone (upper: 80% XXXXX and 20% XXXXY) and half contained infrequent repetition and frequent change in the last tone (lower: 20% XXXXX and 80% XXXXY). The last tone in each tone quintet (i.e., probe) is marked in gray as it is the tone of interest. Each block started with at least 20 frequent tone quintets to establish the global regularity before the first infrequent tone quintet appeared. Participants were instructed to 1) identify infrequent trials and 2) count the number of infrequent trials in each block.
Stimuli
A total of 14 sinusoidal tones were generated using Sound Forge Pro 10.0 (Sony Creative Software Inc.). The duration of each tone was 50 ms (including 5 ms rise/fall times). The frequency of each tone was within the range of 261.626–987.767 Hz, matching the absolute frequency of a series of 14 natural keys on a modern piano (i.e., C4 D4 E4 F4 G4 A4 B4 C5 D5 E5 F5 G5 A5 B5) (Table 2). Unlike previous research using 2 tones in the auditory local– global paradigm (Bekinschtein et al. 2009;Wacongne et al. 2011;
Chennu et al. 2013;El Karoui et al. 2015) (i.e., blocks of frequent repetition and infrequent change: 80% AAAAA+ 20% AAAAB or 80% BBBBB+ 20% BBBBA; blocks of infrequent repetition and frequent change: 20% AAAAA+ 80% AAAAB or 20% BBBBB + 80% BBBBA), here we introduced variation in pitch using 14 tones. Specifically, from the pool of 14 tones, 2 different types of tone quintets were created, the first using the 5-time repetition of the same tone (i.e., the XXXXX type, which could be C4-C4-C4-C4-C4, D4-D4-D4-D4-D4, E4-E4-E4-E4-E4, etc.) and the second with a change in the last tone (i.e., the XXXXY type, which could be C4-C4-C4-C4-A5, D4-D4-D4-D4-B4, E4-E4-E4-E4-C5, etc.). There-after, for blocks of frequent repetition and infrequent change (Fig. 1Bupper) 80% of the trials were randomly sampled from the XXXXX type and 20% from the XXXXY type, whereas for blocks of infrequent repetition and frequent change (i.e.,Fig. 1B
lower) 20% of the trials were randomly sampled from the XXXXX type and 80% from the XXXXY type. Such variation in pitch not only decreased stimulus-specific effects (ensuring that neuro-physiological responses indeed reflect prediction errors per se) but also increased task difficulty (which helps reveal individual differences in task performance).
Procedures
A total of 1000 tone quintets were presented in 8 blocks in randomized order. Half of the blocks contained frequent repeti-tion and infrequent change in the last tone (i.e.,Fig. 1Bupper: 80% XXXXX and 20% XXXXY) and half contained infrequent repetition and frequent change in the last tone (i.e.,Fig. 1Blower: 20% XXXXX and 80% XXXXY). Both block types presented a local regularity where the fifth tone could be identical or different from preceding tones (hence the local standard and the local deviant) and a global regularity where one tone quintet could be more or less common than the other (hence the global standard and the global deviant) (Fig. 1B). In each block, the number of tone quintets varied between 110 and 140, with the number of frequent tone quintets varied between 88 and 112 and the number of infrequent tone quintets varied between 22 and 28 to maintain the 80:20 frequency ratio. Each block started with at least 20 frequent tone quintets to establish the global regularity before the first infrequent tone quintet appeared.
A gray fixation cross against black background remained on the screen for the duration of each block (viewed from a distance of 120 cm). In each trial, a tone quintet was presented with a 200 ms SOA and an intensity of maximum 82 dB (56– 82 dBA; 65–82 dBC). Each trial was followed by a jittered intertrial interval (ITI) of 700–1000 ms. Participants were instructed to 1) identify infrequent trials and 2) count the number of infrequent trials in each block. The whole experiment took around 29 min (i.e., 1000 trials× 1700 ms). E-prime version 2.0 (Psychology Soft-ware Tools) was used for stimulus presentation. Stimulation was randomized individually for each participant and delivered binaurally via headphones (Sennheiser PX200-II).
Table 1 Demographic characteristics and cognitive functions of the participants
Seniors Adults Adolescents
Gender Male 10 13 20
Female 26 23 16
Handedness Right 33 33 34
Left 1 2 2
Ambidextrous 2 1 0
Level of education Primary 2 0 0
Secondary 19 26 36
Tertiary 15 10 0
Marital status Single 3 35 36
Married 27 1 0
Divorced 2 0 0
Widowed 4 0 0
Working memory (Digit Span) Min 17 29 24
Max 43 46 47
Mean 30.39 36.56 36.64
SD 5.93 4.69 5.54
Working memory (Letter-Number Sequencing) Min 13 16 17
Max 26 30 29
Mean 19.36 23.86 24.00
SD 3.02 3.36 2.81
Working memory (Arithmetic) Min 9 11 12
Max 23 22 23
Mean 15.69 18.42 19.00
SD 4.03 2.64 2.56
Depressive symptoms (CES-D) Min 20 23 23
Max 40 68 58
Mean 27.92 35.58 34.14
SD 4.87 9.84 8.23
Level of perceived stress (PSS) Min 0 17 14
Max 35 41 31
Mean 25.72 25.58 25.33
SD 6.21 5.18 4.60
Table 2 Frequency (Hz) of each tone
C4 D4 E4 F4 G4 A4 B4
Frequency 261.63 293.67 329.63 349.23 392.00 440.00 493.88
C5 D5 E5 F5 G5 A5 B5
Frequency 523.25 587.33 659.26 698.46 783.99 880.00 987.77
Data Recording and Analysis
EEG Recording and Preprocessing
EEG was recorded from 62 sintered Ag/AgCl electrodes on a Neuroscan quik-cap according to the extended 10–20 system. The ground electrode was placed at AFz and the reference electrode was placed between Cz and CPz. Eye movements were monitored by additional 4 electrodes placed above and below the left eye and at the outer canthi of both eyes, which were bipo-larized online to yield vertical and horizontal electrooculogram, respectively. All signals were amplified and online filtered at 0.1– 100 Hz with the Neuroscan Synamps 2 amplifier (Compumedics Neuroscan) and sampled at 500 Hz.
Epochs extended from−900 to 498 ms relative to probe onset, using a−100 to 0 ms prestimulus baseline. Ocular artifact cor-rection was conducted with independent component analysis in EEGlab (Delorme and Makeig 2004). The data were recom-puted to average reference, high-pass filtered at 0.5 Hz and low-pass filtered at 20 Hz. Epochs containing voltage deviations
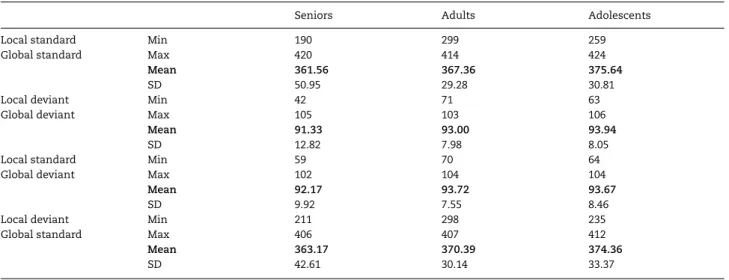
exceeding±100 μV relative to baseline at any of the electrodes were rejected. The trial numbers after artifact rejection in each condition are listed inTable 3.
Statistical Analysis of Event-Related Potential (ERP) Amplitude
Local effect was defined as the difference between all local deviants and local standards (averaged across global manip-ulation). Global effect was defined as the difference between all global deviants and global standards (averaged across local manipulation). Group difference in local and global effects was defined as local as well as global difference ERPs (i.e., deviant−standard) between seniors, adults, and adolescents.
Cluster-based permutation statistics were performed in BESA Statistics 2.0 (Brain Electric Source Analysis, Germany) on the ERPs from 0 to 498 ms relative to probe onset. Cluster-based permutation statistics have 2 essential steps (Maris and Oosten-veld 2007). First, the desired test (local and global effects: paired-sample t-test between deviant and standard; group effect: 1-way
Table 3 Range, mean, and SD of trial numbers after artifact rejection in each condition
Seniors Adults Adolescents
Local standard Global standard Min 190 299 259 Max 420 414 424 Mean 361.56 367.36 375.64 SD 50.95 29.28 30.81 Local deviant Global deviant Min 42 71 63 Max 105 103 106 Mean 91.33 93.00 93.94 SD 12.82 7.98 8.05 Local standard Global deviant Min 59 70 64 Max 102 104 104 Mean 92.17 93.72 93.67 SD 9.92 7.55 8.46 Local deviant Global standard Min 211 298 235 Max 406 407 412 Mean 363.17 370.39 374.36 SD 42.61 30.14 33.37
ANOVA between seniors, adults, and adolescents) is run over all time points and electrodes. Values below a certain threshold (cluster alpha 0.05) are clustered based on temporal adjacency (consecutive time points) and spatial adjacency (electrode dis-tance 4 cm). All t-values/F-values of the clusters are summed to form the cluster test statistic. Second, a permutation distri-bution to estimate the cluster test statistic is generated with the bootstrapping method, which randomly reassigns the condi-tion/group labels and performs the aforementioned testing and clustering procedure again (number of permutations 3000). If the observed cluster test statistic in contrast to permutation distri-bution is <0.05/6 (local and global effects in 3 groups) = 0.008, the observed cluster is considered to be statistically significant.
Statistical Analysis of Behavioral Measures
One-way ANOVA (performed in SPSS 23) between seniors, adults, and adolescents was conducted to examine group difference on cognitive functions (including working memory, depressive symptoms, and level of perceived stress) as well as task perfor-mance (including identification accuracy and counting errors).
To further explore the relation between cognitive functions and EEG, we conducted a partial correlation between working memory and the size of local and global effects, where partic-ipants’ scores on CES-D and PSS were controlled for to remove the potential influences of psychological factors (i.e., depressive symptoms and level of perceived stress) on cognitive functions. We also conducted a stepwise multiple linear regression to evaluate whether all scores on working memory subtests were necessary to predict the size of local and global effects.
Results
Cognitive Functions
Significant group difference was found on all but the last measure (Digit Span: F2,105 = 15.81, P < 0.001; Letter-Number
Sequencing: F2,105= 26.63, P < 0.001; Arithmetic: F2,105= 11.29,
P < 0.001; CES-D: F2,105= 9.52, P < 0.001; PSS: F2,105= 0.05, P = 0.95).
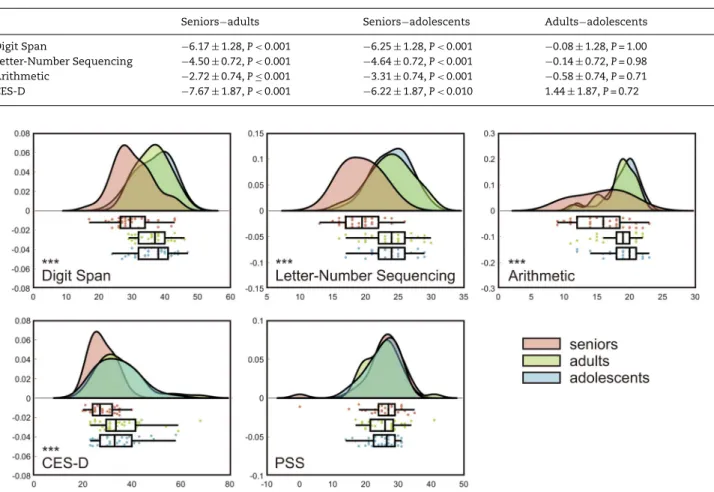
Post hoc comparison for the group difference using Tukey’s Honest Significant Difference (HSD) test indicated that, in working memory subtests and CES-D (but not PSS), seniors scored significantly lower than the 2 younger groups, whereas
the 2 younger groups did not significantly differ from each other (Table 4andFig. 2).
Task Performance
Participants Were Asked to Identify Infrequent Trials
Participants could identify which tone quintets were global deviants with an average accuracy of 0.91± 0.02 standard error (SE) (seniors: 0.78± 0.04 SE; adults: 0.97 ± 0.01 SE; ado-lescents: 0.98± 0.01 SE). There was a significant group dif-ference (F2,105 = 22.93, P < 0.001) where seniors showed lower
identification accuracy than the 2 younger groups, whereas the 2 younger groups did not significantly differ from each other (Tukey’s HSD test: seniors–adults:−0.18 ± 0.03, P < 0.001; seniors–adolescents:−0.20 ± 0.03, P < 0.001; adults–adolescents: −0.02 ± 0.03, P = 0.85).
Participants Were Asked to Count the Number of Infrequent Trials
Participants’ counting errors were quantified as the absolute difference between the actual and reported number of global deviants. The average discrepancy was 6.47± 0.56 SE (seniors: 8.99± 1.00 SE; adults: 5.49 ± 0.97 SE; adolescents: 4.93 ± 0.79 SE). There was a significant group difference (F2,105= 5.64, P < 0.01)
where seniors showed larger counting errors than the 2 younger groups, whereas the 2 younger groups did not significantly differ from each other (Tukey’s HSD test: seniors–adults: 3.51± 1.31, P < 0.05; seniors–adolescents: 4.06 ± 1.31, P < 0.01; adults–adolescents: 0.55± 1.31, P = 0.91).
EEG
Figure 3 shows the topographical distributions of local and global effects (i.e., deviant−standard) in each group. Overall, the pattern was similar across groups, with seniors diverging more from the 2 younger groups. Local effect mainly manifested as a frontocentral negativity at around 100–150 ms (i.e., MMN), a frontocentral positivity at around 200–300 ms (i.e., P3a), and a frontocentral negativity at around 350–450 ms (i.e., reorienting negativity [RON]). Global effect mainly manifested as a frontocentral negativity at around 200 ms and a parietal positivity at around 250–450 ms (i.e., P3b).
Table 4 Post hoc comparison for the group effect using Tukey’s HSD test (mean difference± SE)
Seniors−adults Seniors−adolescents Adults−adolescents Digit Span −6.17 ± 1.28, P < 0.001 −6.25 ± 1.28, P < 0.001 −0.08 ± 1.28, P = 1.00 Letter-Number Sequencing −4.50 ± 0.72, P < 0.001 −4.64 ± 0.72, P < 0.001 −0.14 ± 0.72, P = 0.98 Arithmetic −2.72 ± 0.74, P ≤ 0.001 −3.31 ± 0.74, P < 0.001 −0.58 ± 0.74, P = 0.71 CES-D −7.67 ± 1.87, P < 0.001 −6.22 ± 1.87, P < 0.010 1.44± 1.87, P = 0.72
Figure 2. Raincloud plots (Allen et al. 2019) of cognitive functions measured with working memory subtests, CES-D, and PSS. Significant group effects were found in all but the last measure (∗∗∗P < 0.001).
Figure 4Ashows the grand averaged ERPs of local and global effects on representative electrodes (i.e., FCz and Pz) in each group.Figure 4Bshows the 2-D (time-by-participant) views of the ERPs to illustrate the putative group difference in local and global effects. For local effect (upper), there was a lack of fronto-central negativity at around 350–450 ms (i.e., RON) in seniors. For global effect (lower), there was a lack of frontocentral negativity at around 200 ms and a diminished parietal positivity at around 250–450 ms (i.e., P3b) in seniors.
Local and Global Effects
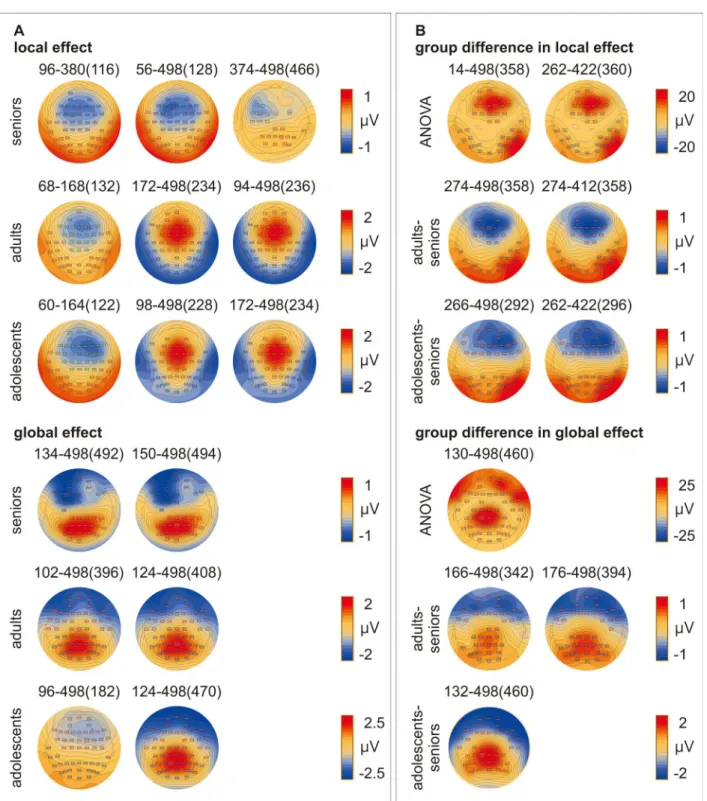
Cluster-based permutation statistics suggested that significant local and global effects appeared in all 3 groups. Violation of the local regularity (Fig. 5Aupper) modulated 3 clusters of ERPs in seniors (cluster 1: 56–498 ms [P < 0.0001]; cluster 2: 96–380 ms [P < 0.0001]; cluster 3: 374–498 ms [P < 0.008]), adults (cluster 1: 94–498 ms [P < 0.0001]; cluster 2: 172–498 ms [P < 0.0001]; cluster 3: 68–168 ms [P≤ 0.001]), and adolescents (cluster 1: 98– 498 ms [P < 0.0001]; cluster 2: 172–498 ms [P < 0.0001]; cluster 3: 60–164 ms [P < 0.001]). Violation of the global regularity (Fig. 5Alower) modulated 2 clusters of ERPs in seniors (cluster 1: 150–498 ms [P < 0.0001]; cluster 2: 134–498 ms [P < 0.0001]), adults (cluster 1: 102–498 ms [P < 0.0001]; cluster 2: 124–498 ms [P < 0.0001]), and adolescents (cluster 1: 96–498 ms [P < 0.0001]; cluster 2: 124–498 ms [P < 0.0001]).
Group Difference in Local and Global Effects
Cluster-based permutation statistics revealed significant group difference in both local and global effects. Local effects modu-lated 2 clusters of ERPs (cluster 1: 14–498 ms [P < 0.0001]; cluster 2: 262–422 ms [P < 0.008]) (Fig. 5Bupper). Post hoc comparisons showed significant difference between seniors and adults (clus-ter 1: 274–498 ms [P < 0.001]; clus(clus-ter 2: 274–412 ms [P < 0.008]) as well as between seniors and adolescents (cluster 1: 266–498 ms [P < 0.0001]; cluster 2: 262–422 ms [P≤ 0.001]). There was no dif-ference between the 2 younger groups. Global effects modulated 1 cluster of ERPs (130–498 ms [P < 0.0001]) (Fig. 5Blower). Post hoc comparisons showed significant difference between seniors and adults (cluster 1: 166–498 ms [P < 0.0001]; cluster 2: 176– 498 ms [P < 0.001]) as well as between seniors and adolescents (132–498 ms [P < 0.0001]). There was no difference between the 2 younger groups.
Correlation Between Cognitive Functions and EEG
To explore the relation between cognitive functions and EEG, we conducted a partial correlation between working memory and the size of local and global effects, while controlling for participants’ scores on CES-D and PSS. Working memory was quantified as the scores on working memory subtests. The size of local and global effects was quantified as difference ERPs (i.e., deviant−standard) on electrodes and time points showing
Figure 3. Topographical distributions of local and global effects (i.e., deviant−standard) in each group. Scalp maps are plotted from 50 to 450 ms after the onset of the probe (i.e., tone of interest).
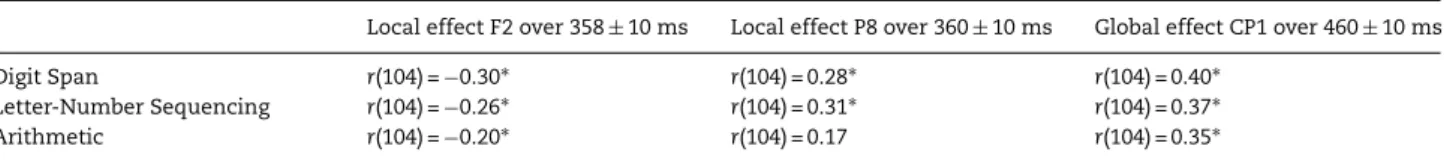
Table 5 Partial correlation table (∗P < 0.05 after Benjamini–Hochberg procedure)
Local effect F2 over 358± 10 ms Local effect P8 over 360± 10 ms Global effect CP1 over 460± 10 ms Digit Span r(104) =−0.30∗ r(104) = 0.28∗ r(104) = 0.40∗
Letter-Number Sequencing r(104) =−0.26∗ r(104) = 0.31∗ r(104) = 0.37∗ Arithmetic r(104) =−0.20∗ r(104) = 0.17 r(104) = 0.35∗
the most significant group difference in cluster-based permu-tation statistics (local effects: F2 over 358± 10 ms and P8 over 360± 10 ms; global effect: CP1 over 460 ± 10 ms). The results showed that working memory was significantly related to the size of local and global effects (Table 5andFig. 6). Worse work-ing memory was associated with smaller RON in local effect (manifesting as smaller frontocentral negativity and smaller parietal positivity) and smaller P3b in global effect. Notably, no correlation remained significant when we also controlled for participants’ age in addition to their scores on CES-D and PSS.
A stepwise multiple linear regression was conducted to eval-uate whether all scores on working memory subtests were nec-essary to predict the size of local and global effects. For local effect on F2 (i.e., frontal negativity of the RON), Digit Span score entered into the regression model at step 1 and a significant regression equation was found (F1,106= 12.81, P≤ 0.001, adjusted
R2= 0.10). The regression equation was: predicted size of local
effect =−0.07 × Digit Span score + 1.81. For local effect on P8 (i.e.,
parietal positivity of the RON), Letter-Number Sequencing score entered into the regression model at step 1 and a significant regression equation was found (F1,106= 12.03, P≤ 0.001, adjusted
R2= 0.09). The regression equation was: predicted size of local
effect = 0.09× Letter-Number Sequencing score−1.48. For global effect on CP1 (i.e., P3b), Digit Span score entered into the regres-sion model at step 1 and a significant regresregres-sion equation was found (F1,106= 21.43, P < 0.001, adjusted R2= 0.16). The regression
equation was: predicted size of global effect = 0.09× Digit Span score−1.60.
Discussion
Here we used an auditory local–global paradigm to investi-gate whether the age-related shift from sensorium to predic-tions occurs at all levels of hierarchical message passing. An indiscriminate age-related change should be associated with
Figure 4. (A). Grand averaged ERPs of local and global effects on representative electrodes (i.e., FCz and Pz) in each group. Shaded area represents the standard error of the mean. Time 0 ms marks the onset of the probe (i.e., tone of interest). Dotted lines mark the onset of the 4 preceding tones. (B). The 2-D (time-by-participant) views of the ERPs in which local and global effects (i.e., deviant−standard) are sorted along participants’ age, smoothed across neighboring participants using a rectangular (boxcar) moving average (smoothing width = 10), and color coded. The trace below each ERP image shows the grand-averaged ERPs across all participants. The red dots on scalp maps mark the position of representative electrodes for ease of reference.
reduced MMN and P3b, signaling reduced prediction errors due to decreased weighting of sensory inputs at both sensory and contextual levels. Measuring hallmarks of hierarchical predic-tion errors, we found that older brains show little reducpredic-tion in the MMN signaling sensory (i.e., first-order) prediction errors but significant attenuation in the P3b signaling contextual (i.e., second-order) prediction errors. The results suggest that, in nor-mal aging, our brain as a predictive machine does not undergo an indiscriminate decline but a specific attenuation of Bayesian updating.
Age-related changes in novelty detection have been the sub-ject of numerous studies. Our findings extend previous empir-ical work by demonstrating the hierarchy-selective changes in predictive processing as we age. The detection of local deviancy seems largely preserved in older individuals at earlier latency (including the MMN followed by the P3a but not the RON). The lack of age-dependent difference at earlier latency is in line with previous research where participants’ attention was focused on the auditory deviant/standard stimuli or less con-strained on the cover task (MMN:Pekkonen et al. 1993,1996;
Schroeder et al. 1995;Gunter et al. 1996;Kazmerski et al. 1997;
Amenedo and Díaz 1998; P3a:Mager et al. 2005;Berti et al. 2013). These findings suggested that auditory discrimination ability remains effective throughout the lifespan (at least with the help
of attention). Interestingly, the detection of local deviancy did diverge by age at later latency, with older individuals missing the RON (Mager et al. 2005;Getzmann et al. 2013). Moreover, participants’ working memory was a significant predictor of the size of local effects at the RON, where worse working memory was associated with smaller RON. Together, the MMN/P3a/RON complex was thought to provide a neurophysiological index of the cascade of 3 main processes involved in involuntary attention controls to deviants (i.e., automatic change detection, orienting of attention, and recovery from distraction or reorient-ing of attention as a workreorient-ing memory process) (Schröger and Wolff 1998;Schröger et al. 2000;Berti and Schröger 2003;Berti et al. 2004;Berti 2008;Horváth et al. 2008). The normal MMN and P3a but the missing RON in older individuals likely reflects their intact capacity to detect and orient to sensory (i.e., first-order) prediction errors; their challenge lies in the more general attempt to recover from such perturbing distraction (i.e., local deviancy) to refocus on their task (i.e., to 1) identify infrequent trials and 2) count the number of infrequent trials in each block) due to limitations in working memory.
In contrast, the detection of global deviancy is clearly com-promised in older individuals, as they showed lower accuracy in the identification of global deviants, more errors in count-ing global deviants, and attenuated P3b. The attenuated P3b
Figure 5. Topographical plots of cluster-based permutation statistics showing (A). local and global effects and (B). Group difference in local and global effects. The numbers above the topographical plots mark the intervals (time points of maximum effect) of each cluster. The rectangles in the topographical plots mark the electrodes forming each cluster.
in older individuals is consistent with previous reports linking aging with decrease in its amplitude, increase in its latency, and anterior shift in its topography (Schiff et al. 2008;van Dinteren et al. 2018; for reviews seeFriedman et al. 1997;Friedman 2003). Furthermore, participants’ working memory was a significant predictor of the size of global effect at the P3b, where worse working memory was associated with smaller P3b. From the
perspective of Bayesian inference, working memory can be con-ceptualized as a process of evidence accumulation in a tem-poral format (Parr and Friston 2017). Therefore, a straightfor-ward explanation is that the age-related decrement in working memory makes it difficult for older individuals to accumulate evidence from successful detection of local deviancy, leading to deficient detection of global deviancy. However, there are at
Figure 6. Scatterplots with least-squares lines representing the correlation between working memory and the size of local and global effects.
least 2 possible mechanisms underlying the hierarchy-selective Bayesian updating. One scenario is that lower-level prediction errors failed to propagate to the higher level. This would imply that the age-related decrement in working memory disrupts the hierarchical structure of cortical processes. Alternatively, it might be that lower-level prediction errors did propagate to the higher level but were significantly down weighted. This would imply that the age-related decrement in working memory degrades the precision of feedforward information, which in turn reduces the gain of neural activity (Feldman and Friston 2010). This is analogous to putting one in a low-precision con-text where he/she experiences low degree of certainty about sensory inputs. Under this circumstance, the most effective strategy would be to downweight sensory inputs to ensure that statistical learning is primarily driven by reliable rather than volatile contexts (Clark 2013;Hsu et al. 2015,2018;Schröger et al. 2015).
For exploratory purposes, we tested post hoc for the local× global interaction across groups following the analysis performed by Kompus et al. (2020) where the MMN was quantified as the mean amplitude± 20 ms around the peak in the time window of 50–250 ms on FCz and the P3b was quantified as the mean amplitude in the time window of 300–498 ms on Pz. On the MMN, there was no local× global interaction (F1,107<0.01, P = 0.95). On the other hand, there
were significant local effect (F1,107= 124.34, P < 0.001) and global
effect (F1,107= 6.54, P < 0.05). On the P3b, there was a significant
local× global interaction (F1,107= 35.05, P < 0.001). Post hoc
comparisons showed significant local effect for global deviants (t107=−5.93, P < 0.001) but not global standards (t107= 0.68,
P = 0.50). However, there was significant global effect for both
local deviants (t107=−11.46, P < 0.001) and local standards
(t107=−7.37, P < 0.001). The results contradicted the finding of
Kompus et al. (2020), which showed local× global interaction on the MMN and the absence of such interaction on the P3b. Unfortunately, it is difficult to determine the causes of the discrepancies, as the 2 studies differed in several aspects such as sample size and age, stimulus feature, etc. More systematic reviews are needed to identify factors affecting the onset of local× global interaction, which could shed light on how our brain performs hierarchical processing of statistical regularities. Admittedly, while the predictive coding framework offers compelling explanations for the results, there are alternative views on this issue. For example, there are at least 2 competing hypotheses concerning the mechanism generating the MMN: the neuronal adaptation hypothesis (that MMN results from the attenuation and delay of the N1 to standard stimuli; e.g.,
Jääskeläinen et al. 2004) which interprets MMN as a bottom-up mechanism and the model adjustment hypothesis (that MMN reflects an online modification of a perceptual model based on a memory trace of previous stimuli; e.g.,Näätänen et al. 2005) which attributes MMN to a comparison process within a predictive coding framework. It remains possible that the age-invariant MMN in the current study simply reflects intact neuronal adaptation rather than intact model adjustment in older individuals. Should it be the case, predictive processing at the local level is not necessarily unscathed in old age. Future research disambiguating effects of neuronal adaptation from model adjustment upon the detection of local deviancy should provide more unequivocal evidence on the topic.
The older individuals participating in the current study were well educated, cognitively intact, and physically healthy, allow-ing us to generalize these findallow-ings as a hallmark of normal aging. As we age, the estimation of prediction errors seems preserved at the local but not the global level. Although the lack of age-dependent difference in preattentive processing of prediction errors seems to contradict previous reports on age-related decline in automatic detection of auditory changes at first glance (Czigler et al. 1992;Gaeta et al. 1998,2001;Alain and Woods 1999;Cooper et al. 2006;Schiff et al. 2008), it is noteworthy that, in most (although not all) of the aforementioned cases, participants’ attention was diverted from the auditory stimuli to a more demanding task. It might well be that older individ-uals’ deficits in automatic detection of auditory changes can be compensated for by top-down processes such as attention (Alain et al. 2004). The idea was based on their findings that, in the passive listening condition, the MMN to near-threshold deviants were elicited only in younger but not older partici-pants. However, in the active listening condition, there were no age differences in participants’ neurophysiological responses to deviants. Recent animal research also showed that degradation and impairments of ascending acoustic information in older rats can be compensated for by top-down influences that increase the gain of prediction errors (Cai et al. 2016). Our results extend the existing literature by suggesting that such top-down com-pensation is effective at the local but not the global level in normal aging.
Lastly, we found no difference between adults and adoles-cents here. It disagrees with, for example, previous findings that the amplitude of P3b reaches its peak in adolescence then declines for the rest of the lifespan (van Dinteren et al. 2014a,
2014b). It is possible that the 2 younger groups were too close in age to show any developmental changes. Future research enrolling even younger individuals should provide invaluable insight into the developmental trajectory of hierarchical predic-tive processing in the human brain.
Notes
We thank Miss Y.-C. Chung for assistance with EEG data collec-tion. We also thank National Taiwan Normal Univeristy (sup-ported by Higher Education Sprout Project at Taiwan Ministry of Education) for paying the open access fee. Conflict of Interest: None declared.
Funding
Taiwan Ministry of Science and Technology (grant number MOST107-2636-H-003-001, MOST108-2636-H-003-001, MOST109-2636-H-003-001) to Y.-F.H.
References
Alain C, McDonald KL, Ostroff JM, Schneider B. 2004. Aging: a switch from automatic to controlled processing of sounds?
Psychol Aging. 19(1):125–133.
Alain C, Woods DL. 1999. Age-related changes in processing auditory stimuli during visual attention: evidence for deficits in inhibitory control and sensory memory. Psychol Aging. 14(3):507–519.
Alho K. 1995. Cerebral generators of mismatch negativity (MMN) and its magnetic counterpart (MMNm) elicited by sound changes. Ear Hear. 16(1):38–51.
Allen M, Poggiali D, Whitaker K, Marshall TR, Kievit RA. 2019. Raincloud plots: a multi-platform tool for robust data visu-alization. Wellcome Open Res. 4:63.
Amenedo E, Díaz F. 1998. Aging-related changes in processing of non-target and target stimuli during an auditory oddball task. Biol Psychol. 48(3):235–267.
Bekinschtein TA, Dehaene S, Rohaut B, Tadel F, Cohen L, Nac-cache L. 2009. Neural signature of the conscious processing of auditory regularities. Proc Natl Acad Sci. 106(5):1672–1677. Berti S, Grunwald M, Schröger E. 2013. Age dependent changes
of distractibility and reorienting of attention revisited: an event-related potential study. Brain Res. 1491:156–166. Berti S, Roeber U, Schröger E. 2004. Bottom-up influences
on working memory: behavioral and electrophysiological distraction varies with distractor strength. Exp Psychol. 51(4):249–257.
Berti S, Schröger E. 2003. Working memory controls involuntary attention switching: evidence from an auditory distraction paradigm. Eur J Neurosci. 17(5):1119–1122.
Berti S. 2008. Cognitive control after distraction: event-related brain potentials (ERPs) dissociate between different pro-cesses of attentional allocation. Psychophysiology. 45(4): 608–620.
Cai R, Richardson BD, Caspary DM. 2016. Responses to pre-dictable versus random temporally complex stimuli from single units in auditory thalamus: impact of aging and anes-thesia. J Neurosci. 36(41):10696–10706.
Chan JS, Wibral M, Wollstadt P, Stawowsky C, Brandl M, Helbling S, Naumer M, Kaiser J. 2017. Predictive coding over the lifes-pan: increased reliance on perceptual priors in older adults - a magnetoencephalography and dynamic causal modelling study. bioRxiv. doi:10.1101/17809518 August 2017, preprint: not peer reviewed.
Chennu S, Noreika V, Gueorguiev D, Blenkmann A, Kochen S, Ibanez A, Owen AM, Bekinschtein TA. 2013. Expectation and attention in hierarchical auditory prediction. J Neurosci. 33(27):11194–11205.
Chennu S, Noreika V, Gueorguiev D, Shtyrov Y, Bekinschtein TA, Henson R. 2016. Silent expectations: dynamic causal modeling of cortical prediction and attention to sounds that weren’t. J Neurosci. 36(32):8305–8316.
Chien CP, Cheng TA. 1985. Depression in Taiwan: epidemio-logical survey utilizing MC-CES-D. Psychiatria et Neurologia
Japonica. 87(5):335–338.
Chu LC. 2005. Chinese version of perceived stress scale. Chin J
Psychol. 47:157–179.
Clark A. 2013. Whatever next? Predictive brains, situated agents, and the future of cognitive science. Behav Brain Sci. 36(3):181–204.
Cohen S, Kamarck T, Mermelstein R. 1983. A global measure of perceived stress. J Health Soc Behav. 24:385–396.
Cooper RJ, Todd J, McGill K, Michie PT. 2006. Auditory sensory memory and the aging brain: a mismatch negativity study.
Neurobiol Aging. 27(5):752–762.
Cooray G, Garrido MI, Hyllienmark L, Brismar T. 2014. A mecha-nistic model of mismatch negativity in the ageing brain. Clin
Neurophysiol. 125(9):1774–1782.
Czigler I, Csibra G, Csontos A. 1992. Age and inter-stimulus interval effects on event-related potentials to frequent and infrequent auditory stimuli. Biol Psychol. 33(2-3):195–206. Davis SW, Dennis NA, Daselaar SM, Fleck MS, Cabeza R. 2008.
Qué PASA? The posterior-anterior shift in aging. Cereb Cortex. 18(5):1201–1209.
Delorme A, Makeig S. 2004. EEGLAB: an open source toolbox for analysis of single-trial EEG dynamics including independent component analysis. J Neurosci Methods. 134(1):9–21. Donchin E, Coles MGH. 1988. Is the P300 component a
manifes-tation of context updating? Behav Brain Sci. 11:355–372. Egner T, Monti JM, Summerfield C. 2010. Expectation and
sur-prise determine neural population responses in the ventral visual stream. J Neurosci. 30(49):16601–16608.
El Karoui I, King JR, Sitt J, Meyniel F, VanGaal S, Hasboun D, Adam C, Navarro V, Baulac M, Dehaene S et al. 2015. Event-related potential, time-frequency, and functional connectiv-ity facets of local and global auditory novelty processing: an intracranial study in humans. Cereb Cortex. 25(11):4203–4212. Faugeras F, Rohaut B, Weiss N, Bekinschtein T, Galanaud D, Puybasset L, Bolgert F, Sergent C, Cohen L, Dehaene S et al. 2012. Event related potentials elicited by violations of audi-tory regularities in patients with impaired consciousness.
Neuropsychologia. 50(3):403–418.
Faugeras F, Rohaut B, Weiss N, Bekinschtein TA, Galanaud D, Puybasset L, Bolgert F, Sergent C, Cohen L, Dehaene S et al. 2011. Probing consciousness with event-related potentials in the vegetative state. Neurology. 77(3):264–268.
Faul F, Erdfelder E, Buchner A, Lang A-G. 2009. Statistical power analyses using G∗power 3.1: tests for correlation and regres-sion analyses. Behav Res Methods. 41:1149–1160.
Faul F, Erdfelder E, Lang A-G, Buchner A. 2007. G∗power 3: a flex-ible statistical power analysis program for the social, behav-ioral, and biomedical sciences. Behav Res Methods. 39:175–191. Feldman H, Friston KJ. 2010. Attention, uncertainty, and
free-energy. Front Hum Neurosci. 4:215.
Friedman D, Kazmerski V, Fabiani M. 1997. An overview of age-related changes in the scalp distribution of P3b.
Electroen-cephalogr Clin Neurophysiol. 104(6):498–513.
Friedman D. 2003. Cognition and aging: a highly selective overview of event-related potential (ERP) data. J Clin Exp
Neuropsychol. 25(5):702–720.
Friston K. 2005. A theory of cortical responses. Philos Trans R Soc
B Biol Sci. 360(1465):815–836.
Friston K. 2009. The free-energy principle: a rough guide to the brain? Trends Cogn Sci. 13(7):293–301.
Gaeta H, Friedman D, Ritter W, Cheng J. 1998. An event-related potential study of age-related changes in sensitivity to stim-ulus deviance. Neurobiol Aging. 19(5):447–459.
Gaeta H, Friedman D, Ritter W, Cheng J. 2001. An event-related potential evaluation of involuntary attentional shifts in young and older adults. Psychol Aging. 16(1):55–68. Getzmann S, Gajewski PD, Falkenstein M. 2013. Does age
increase auditory distraction? Electrophysiological correlates of high and low performance in seniors. Neurobiol Aging. 34(8):1952–1962.
Gunter T, Jackson J, Mulder G. 1996. Focussing on aging: an electrophysiological exploration of spatial and attentional processing during reading. Biol Psychol. 43:103–145.
Heilbron M, Chait M. 2018. Great expectations: is there evi-dence for predictive coding in auditory cortex? Neuroscience. 389:54–73.
Horváth J, Winkler I, Bendixen A. 2008. Do N1/MMN, P3a, and RON form a strongly coupled chain reflecting the three stages of auditory distraction? Biol Psychol. 79(2):139–147.
Hsu Y-F, Hämäläinen JA, Waszak F. 2018. The processing of mis-predicted and unmis-predicted sensory inputs interact differently with attention. Neuropsychologia. 111:85–91.
Hsu Y-F, Le Bars S, Hämäläinen JA, Waszak F. 2015. Distinc-tive representation of mispredicted and unpredicted pre-diction errors in human electroencephalography. J Neurosci. 35:14653–14660.
Jääskeläinen IP, Ahveninen J, Bonmassar G, Dale AM, Ilmoniemi RJ, Levänen S, Lin F-S, May P, Melcher J, Stufflebeam S et al. 2004. Human posterior auditory cortex gates novel sounds to consciousness. Proc Natl Acad Sci. 101:6809–6814.
Kazmerski VA, Friedman D, Ritter W. 1997. Mismatch negativity during attend and ignore conditions in Alzheimer’s disease.
Biol Psychiatry. 42(5):382–402.
King JR, Faugeras F, Gramfort A, Schurger A, El Karoui I, Sitt JD, Rohaut B, Wacongne C, Labyt E, Bekinschtein L et al. 2013. Single-trial decoding of auditory novelty responses facili-tates the detection of residual consciousness. Neuroimage. 83:726–738.
Kompus K, Volehaugen V, Todd J, Westerhausen R. 2020. Hier-archical modulation of auditory prediction error signaling is independent of attention. Cogn Neurosci. 11(3):132–142. Mager R, Falkenstein M, Störmer R, Brand S, Müller-Spahn F,
Bullinger AH. 2005. Auditory distraction in young and middle-aged adults: a behavioural and event-related potential study.
J Neural Transm. 112(9):1165–1176.
Maris E, Oostenveld R. 2007. Nonparametric statistical testing of EEG- and MEG-data. J Neurosci Methods. 164(1):177–190. Moran RJ, Symmonds M, Dolan RJ, Friston KJ. 2014. The brain
ages optimally to model its environment: evidence from sensory learning over the adult lifespan. PLoS Comput Biol. 10(1):e1003422.
Näätänen R, Jacobsen T, Winkler I. 2005. Memory-based or affer-ent processes in mismatch negativity (MMN): a review of the evidence. Psychophysiology. 42(1):25–32.
Parr T, Friston KJ. 2017. Working memory, attention, and salience in active inference. Sci Rep. 7(1):14678.
Patel SH, Azzam PN. 2005. Characterization of N200 and P300: selected studies of the event-related potential. Int J Med Sci. 2(4):147–154.
Pekkonen E, Jousmäki V, Partanen J, Karhu J. 1993. Mismatch negativity area and age-related auditory memory.
Electroen-cephalogr Clin Neurophysiol. 87(5):321–325.
Pekkonen E, Rinne T, Reinikainen K, Kujala T, Alho K, Näätä-nen R. 1996. Aging effects on auditory processing: an event-related potential study. Exp Aging Res. 22(2):171–184. Polich J. 2004. Clinical application of the P300 event-related brain
potential. Phys Med Rehabil Clin N Am. 15(1):133–161. Polich J. 2007. Updating P300: an integrative theory of P3a and
P3b. Clin Neurophysiol. 118(10):2128–2148.
Radloff LS. 1977. The CES-D scale: a self-report depression scale for research in the general population. Appl Psychol Measur. 1(3):385–401.
Rinne T, Alho K, Ilmoniemi RJ, Virtanen J, Näätänen R. 2000. Sep-arate time behaviors of the temporal and frontal mismatch negativity sources. Neuroimage. 12(1):14–19.
Schiff S, Valenti P, Andrea P, Lot M, Bisiacchi P, Gatta A, Amodio P. 2008. The effect of aging on auditory components of event-related brain potentials. Clin Neurophysiol. 119(8):1795–1802. Schroeder M, Lipton R, Ritter W, Giesser B, Vaughan H. 1995.
Event-related potential correlates of early processing in nor-mal aging. Int J Neurosci. 80(1-4):371–382.
Schröger E, Giard MH, Wolff C. 2000. Auditory distraction: event-related potential and behavioral indices. Clin Neurophysiol. 111(8):1450–1460.
Schröger E, Marzecová A, SanMiguel I. 2015. Attention and pre-diction in human audition: a lesson from cognitive psy-chophysiology. Eur J Neurosci. 41:641–664.
Schröger E, Wolff C. 1998. Attentional orienting and reorient-ing is indicated by human event-related brain potentials.
Neuroreport. 9(15):3355–3358.
Strauss M, Sitt JD, King JR, Elbaz M, Azizi L, Buiatti M, Naccache L, van Wassenhove V, Dehaene S. 2015. Disruption of hier-archical predictive coding during sleep. Proc Natl Acad Sci. 112(11):E1353–E1362.
Tarkka IM, Stokid DS, Basile LFH, Papanicolaou AC. 1995. Electric source localization of the auditory P300 agrees with mag-netic source localization. Electroencephalogr Clin Neurophysiol. 96(6):538–545.
Uhrig L, Dehaene S, Jarraya B. 2014. A hierarchy of responses to auditory regularities in the macaque brain. J Neurosci. 34(4):1127–1132.
Uhrig L, Janssen D, Dehaene S, Jarraya B. 2016. Cerebral responses to local and global auditory novelty under general anesthesia.
Neuroimage. 141:326–340.
van Dinteren R, Arns M, Jongsma ML, Kessels RP. 2014a. Combined frontal and parietal P300 amplitudes indicate compensated cognitive processing across the lifespan. Front
Aging Neurosci. 6:294.
van Dinteren R, Arns M, Jongsma ML, Kessels RP. 2014b. P300 development across the lifespan: a systematic review and meta-analysis. PLoS One. 9(2):e87347.
van Dinteren R, Huster RJ, Jongsma MLA, Kessels RPC, Arns M. 2018. Differences in cortical sources of the event-related P3 potential between young and old participants indicate frontal compensation. Brain Topogr. 31(1): 35–46.
Wacongne C, Labyt E, van Wassenhove V, Bekinschtein T, Nac-cache L, Dehaene S. 2011. Evidence for a hierarchy of predic-tions and prediction errors in human cortex. Proc Natl Acad
Sci. 108(51):20754–20759.
Wolpe N, Ingram JN, Tsvetanov KA, Geerligs L, Kievit RA, Henson RN, Wolpert DM, Cam-CAN, Rowe JB. 2016. Ageing increases reliance on sensorimotor prediction through structural and functional differences in frontostriatal circuits. Nat Commun. 7(1):13034.