HAL Id: hal-01365311
https://hal.archives-ouvertes.fr/hal-01365311
Submitted on 26 Nov 2019
HAL is a multi-disciplinary open access
archive for the deposit and dissemination of sci-entific research documents, whether they are pub-lished or not. The documents may come from teaching and research institutions in France or abroad, or from public or private research centers.
L’archive ouverte pluridisciplinaire HAL, est destinée au dépôt et à la diffusion de documents scientifiques de niveau recherche, publiés ou non, émanant des établissements d’enseignement et de recherche français ou étrangers, des laboratoires publics ou privés.
Fatty acid-based thermoplastic poly(ester-amide) as
toughening and crystallization improver of
poly(L-lactide)
Thomas Lebarbé, Etienne Grau, Carine Alfos, Henri Cramail
To cite this version:
Thomas Lebarbé, Etienne Grau, Carine Alfos, Henri Cramail. Fatty acid-based thermoplastic poly(ester-amide) as toughening and crystallization improver of poly(L-lactide). European Polymer Journal, Elsevier, 2015, 65, pp.276-285. �10.1016/j.eurpolymj.2014.11.007�. �hal-01365311�
Fatty Acid-Based Thermoplastic Poly(Ester-Amide)
as toughening and crystallization improver of
Poly(L-lactide)
Thomas Lebarbé,1,2,3 Etienne Grau,1,2 Carine Alfos4 and Henri Cramail*1,2
1Univ. Bordeaux, Laboratoire de Chimie des Polymères Organiques, ENSCBP,
16 Avenue Pey-Berland, Pessac Cedex, F 33607 France.
2CNRS, Laboratoire de Chimie des Polymères Organiques, Pessac Cedex, F 33607,
France.
3French Environment and Energy Management Agency, 20 avenue du Grésillé-BP 90406,
AngersCedex 01, F 49004, France
4ITERG, 11 rue Gaspard Monge, Parc Industriel, Pessac Cedex, F 33600, France.
KEYWORDS: Poly(L-lactide), toughening, impact resistance, fatty acids, crystallization, sustainable polymers.
ABSTRACT
Polylactide (PLA) is a bio-based and compostable aliphatic polyester that has gained widespread interest during the last decades due to its promising technical substitution potential. Its good
mechanical properties comparable to some mainstream petroleum based thermoplastics are however counterbalanced by its inherent brittleness that limits its scope of applications. Toughening of PLA by blending with a rubber phase is the most used solution to reduce its brittleness because of economical and practical advantages that offers this modification pathway. In this study, we investigated by melt-blending, the use of a thermoplastic elastomer poly(ester-amide) (PEA), synthesized from fatty acid-based precursors, as an impact modifier of poly(L-lactide) (PLLA). This PEA demonstrated an effective rubber-toughening of PLLA. Moreover, beneficial effects of the PEA on the crystallization rate of PLLA were observed thus enlarging the scope of applications for the obtained blends.
INTRODUCTION
Nowadays, the production of biobased plastics represents nearly 1.5 million tons per year. Among them, poly(L-lactide) (PLLA), synthesized by ring-opening polymerization of L-lactide, a cyclic dimer of lactic acid derived from starch fermentation1-3 is one of the most mature
bioplastic. PLLA represents a promising polymer as substitute of petroleum-based plastics for a wide range of applications due to its high stiffness, its biobased character and its compostable behavior.4, 5 However, alike PS, PLLA is a brittle material with low values of tensile strain at
break, tensile toughness and impact strength. It is currently characterized by a notched IZOD impact strength as low as 2.5kJ/m² and the use of impact modifiers is often required to obtain acceptable toughness.6, 7
For PS, this brittleness has been overcome thanks to the development of rubber-modified high impact PS and its copolymers such as styrene-butadiene-styrene and acrylonitrile-butadiene-styrene copolymers.8, 9 These toughening strategies by adding rubber additives (low Tg
polymers) were also applied to PLLA. For efficient rubber-toughening, the rubber should be dispersed as discrete particles and be well bonded to the rigid polymer matrix. The particles can be incorporated via blending the rubber with the polymer matrix, or by copolymerizing the rubber with the polymer matrix, taking advantage of the natural segregation of immiscible polymers. Even if the copolymerization represents a powerful means to obtain properties unattainable with PLLA, most of the researches have been focusing on the melt-blending of PLLA with immiscible rubbers due to the economical advantages of this route.7 The main issue
with respect to PLLA toughening, is the selection of the rubber. For an effective improvement of the impact strength of PLLA, the glass transition of the rubber must be at least 20°C lower than the test/use temperature. In addition, the rubber molecular weight must not be too low, it should not be miscible with the PLLA matrix, and must be thermally stable to PLLA processing temperatures.10, 11 Based on these concepts, various types of rubber were melt-blended with
PLLA. Mainstream elastomeric polymers such as olefin-,12-15 acrylic-16, 17 and styrenic-based
thermoplastics18, 19 were first investigated with or without compatibilizers or reactive functions
(such as glycidyl methacrylate)20-23 in their backbone. Most of the described systems showed
good enhancement in impact strength of PLLA. However, these additives do not constitute long-term and suitable solutions as they modify the compostable feature of the final PLLA material.
To improve the sustainability of high impact PLLA materials, many studies have been more recently focusing on the development of second generation impact modifiers for PLLA based on biodegradable and ideally bio-based rubbers. Main examples include blends of PLLA with poly(ε-caprolactone) (PCL),11, 24-27 poly(butylene succinate) (PBS)28, 29 and their copolyesters,
poly(butylene adipate-co-terephtalate) (PBAT),30, 31 poly(hydroxyalkanoate)s (PHAs),32-34
no interactions with PLLA thus resulting in poor interfacial adhesion. Thus, in many studies, a compatibilizer (dicumyl peroxide, epoxy functionalized compounds …) was added leading to highly effective systems.
The development of bio-based rubbers remains an important challenge. Plant oils and more particularly fatty acids represent promising feedstock for aliphatic polyesters and polyamides production.37-39 In previous studies, our group described the synthesis of various diols bearing
ester and/or amide functions that were obtained from methyl 10-undecenoate, a building block issued from castor oil (pyrolysis of methyl ricinoleate).40-43 Such diols present a good design for
the synthesis of PLLA impact modifiers. Herein we study the binary blends of a novel fatty acid-based poly(ester-amide) thermoplastic elastomer (PEA) with PLLA.
RESULTS AND DISCUSSION
Synthesis and properties of the poly(ester-amide) rubber
The PEA was synthesized by polycondensation of undecenoate butylene diamide diol (UndBdA-diol) with a hydrogenated dimer fatty acid (DFA) (Scheme 1). The structure of the polymer was confirmed by 1H-NMR spectroscopy as evidenced by ester linkages formation (peaks at 4.22ppm
and 2.28ppm) and expected peaks integration (Figure S1). Before melt-blending the PEA with PLLA, some requirements have to be fulfilled in order to maintain an efficient toughening of PLLA. First, the molecular weight of the rubber must not be too low in order to maintain a sufficient response to impact loading. Moreover, by lowering the molecular weight below a certain value, compatibility of the two polymers could happen which would result in no improvement of the PLLA impact strength. A sufficient structural integrity and immiscibility
between the two phases was expected with a PEA showing a 𝑀̅𝑤 of 27 000 g.mol-1 with a molar
mass dispersity of 1.6.
DSC analysis of the PEA revealed a Tg well below room temperature (Tg ~ -28°C) which is in accordance with the requirements for rubber toughening of PLLA (Figure S2, Table S1). Interestingly the PEA showed a semi-crystalline behavior with a melting point at 109°C and a melting enthalpy of 42 J.g-1 despite the presence of long alkyl dangling chains that act as internal
plasticizers. The highly cohesive amide segments are thought to be responsible for the crystallinity of the material. Tensile tests, performed on PEA showed a Young’s modulus value of 191 MPa at 20°C, which is much lower than the one of PLLA (1.5 GPa). The low elastic modulus is also in accordance with the requirements for effective toughening of PLLA (Figure
S3).
Another requirement for PLLA additive concerns the thermal stability. Indeed the rubber must be thermally stable to PLLA processing temperatures, which are in general around 190-200°C. TGA experiments under N2 were thus carried out. The first weight loss (temperature corresponding to
5wt% loss) is observed near 350°C and 335°C for PEA and PLLA, respectively. The high thermal stability of PEA confirms its applicability as PLLA additive.
The blended polymers must be immiscible to observe a phase segregation at the micro-scale and thus to obtain an efficient rubber toughening. The solubility parameter (δ) is usually used to roughly estimate the compatibility of polymers with solvents or other polymers. It measures the cohesive strength between molecules and can be calculated from the constituent functional groups:
𝛿 = (𝐸𝑐𝑜ℎ 𝑉 )
1/2
where Ecoh is the molar attraction constant for a particular functional group with volume V.
Solubility parameters of PLLA and PEA were calculated from Hoy method. The obtained values are 11.11 and 10.06 (cal.cm-3)0.5 for PLLA and PEA, respectively. The difference between the
two solubility parameters is significant (difference higher than 0.5) and suggests that the two polymers should be immiscible, which is in accordance with the requirements needed for effective toughening of PLLA by PEA.35
.
Processability and morphology of the blends
The PEA rubber was added in various amounts into a commercially available PLLA (Table S1) using a twin-screw micro-compounder in order to reach final contents of 5, 10, 15 and 20 wt% of rubber. Based on the conditions generally reported in the literature for such systems, the following conditions have been selected: melt-compounding for 5 min at 190°C and 50 rpm followed by injection molding at 200°C in a mold kept at 50°C.
Processability
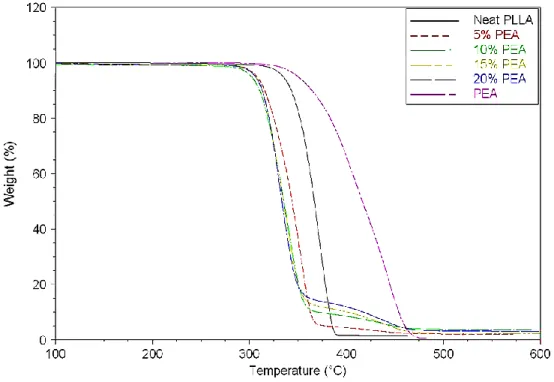
The thermal stability of the PLLA/PEA blends under non-oxidative conditions was investigated by thermal gravimetric analysis in order to evaluate the processability of the materials. Thermal decomposition parameters are given in Table 1 and illustrated in Figure 1 and Figure S4. As expected a two-step thermal decomposition is observed for the blends. A first weight loss occurring near 300°C is assigned to the degradation of the PLLA matrix and a second weight loss observed around 350-400°C is characteristic from PEA thermal degradation. Regarding the TGA curves (Figure 1) and the corresponding derivatives (Figure S4), a slight decrease in initial degradation temperature of PLLA phase must be underlined. Indeed the temperature corresponding to 5wt% loss decreased from 335°C for neat PLLA to 308°C when only 5wt% of PEA was dispersed in the PLLA matrix. The presence of amide function that can catalyze the depolymerization/decomposition of PLLA matrix could explain this feature. However, further increase in the PEA weight composition did not changed notably the thermal degradation. For all samples, the temperature corresponding to the final degradation was above 490°C and negligible weight residues were measured (less than 3.2%). To summarize, good thermal stability of the
blends was noticed despite the slight decrease in initial degradation temperature of PLLA blended with PEA.
Figure 1 : TGA curves of PLLA, PEA and their blends recorded from 20 to 700°C at 10°C.min-1
under a nitrogen atmosphere.
Table 1: Thermal properties, weight compositions of the blends and mean diameter size of the
PEA particles.
wt% PEA theo wt% PEA TGA T5% (°C)a 𝒅̅ (µm)b
0 - 335 - 5 5.4 308 1.2 ± 0.3 10 11.4 303 1.6 ± 0.4 15 14.1 306 1.8 ± 0.6 20 16.5 306 3.1 ± 1.4 100 - 350 -
Dynamical melt rheological properties of neat PLLA and PLLA/PEA blends were measured at 190°C (temperature used during melt-blending) in order to evaluate the interaction between both phases and the melt processability of the blends. Polymeric complex viscosity (η*) is related to the storage modulus (G’) and loss modulus (G”), which represent the elastic and viscous components of the polymeric modulus, respectively. Figure 2 shows the rheological curves of neat PLLA and those of the PLLA/PEA blends comprising different amounts of PEA.
In Figure 2a is displayed the storage modulus versus the angular frequency. It is noteworthy that G’ of the blends increases with PEA content at low frequencies (below 5 rad.s-1), which means
that the elasticity of the melted blend increases with PEA. The enhancement of blend elasticity over neat PLLA can be attributed to the relaxation of the dispersed phase under slight shear deformation. The higher elasticity of the blends with high contents of PEA can be explained by a longer relaxation process of the dispersed phase due to a diameter increase of the dispersed phase, as discussed later in the manuscript (See figure 3). At higher frequencies (above 5 rad.s
-1), the decrease in G’ with an increase in PEA content can be attributed to a plasticizing effect of
the dispersed particles that become highly deformed. The loss modulus (G”) (Figure 2b) remains mostly unaffected by the dispersion of PEA in the PLLA matrix. The complex viscosities, η*, of neat PLLA and PLLA/PEA blends as a function of the angular frequency, ω, are shown in
Figure 2c. From these curves, it appears that neat PLLA and the blends exhibit a typical
Newtonian behavior in the low-frequency region and shear thinning tendency at about 10 rad.s-1,
characteristic for linear polymers. The blends present this tendency at lower frequencies meaning that the Newtonian region for the blends is narrower. The dynamic complex viscosities of blends are lower than that of neat PLLA in accordance with an improved processability of PLLA.
In Figure 2d is displayed the plot showing the relationship between the storage modulus (G’) and the loss modulus (G”) (Han plot).44 The Han plot gives information on the viscoelastic
properties of the blends. Indeed, the bisector, G’=G”, divides the coordinate into two parts. Neat PLLA and PLLA/PEA blends are all located below the bisector showing that these materials were more viscous than elastic at the melting state. It is noticeable that the curves shift to the bisector, indicating that the elastic component of the blends increases with higher PEA content. This enhancement of the blend elasticity may arise from molecular interactions between the amide functions of the PEA and the ester functions of the PLLA matrix.
Morphology
Since the mechanical properties of polymer blends highly depend on the immiscibility of the different phases, it is important to know the microstructure of the blend. Rheological measurements were previously used to evaluate the processabilty of the blends. The Han plot (Figure 2d) can also give information on the miscibility of two phases while in blends.44 Indeed,
it is clearly observed an upturning of the curves for the blends at low modulus while the curve of neat PLLA remains almost linear. This observation indicates that PLLA/PEA blends are immiscible at all concentrations of the dispersed phase in the melt matrixes.35, 45, 46
Figure 2 : (a) Storage modulus, (b) loss modulus, (c) complex viscosity of neat PLLA and of the
blends with PEA as a function of angular frequency. (d) Han plot showing the storage modulus versus the loss modulus. All measurements were performed at 190°C using a strain deformation of 5%.
Scanning electron microscopy (SEM) was then employed to study the morphologies of the blends at room temperature. Figure 3 shows cryo-fractured surfaces of the different blends. For all samples, the morphologies were characterized by spheres and holes of PEA phase dispersed into the PLLA matrix. The size of the PEA phase domains, calculated from the images of the cryo-fractured surfaces, increased with its content from 1.2µm to 3.1µm (Table 1).
Figure 3 : Cryo-fractured surfaces of the blends observed by SEM at room temperature. Crystallization behavior of the blends
One main feature of PLLA is its crystalline ability. Indeed isotactic PLA (PLLA) has been extensively studied due to the high melting point that confers interesting properties to this material. In industrial practice, it is therefore difficult to make use of the semi-crystalline character of PLLA because the high speed of mass production (e.g. in injection moulding) implies quenching, leading to amorphous structures. Some polymers such as PDLA,47-49
polyhydroxybutyrate,50-52 polycaprolactone,53, 54 polyglycolide,53 poly(butylene
succinate-co-L-lactate),55 starch,56, 57 cellulose58 and cyclodextrin59 have been described as nucleating-assisting
agents and spherulite growth-accelerating agents. Moreover, environmental friendly compounds like N,N’-ethylenebisstearamide (EBSA) and N,N’-ethylenebis (12-hydroxystearamide) (EBH)
were proved to act as nucleation agent at the very early stage of PLLA crystallization.46 The
chemical structure of the PEA was specially designed to induce PLLA nucleation similarly to the previously described EBSA and EBH (amide segments that can interact with the matrix). In addition, DFA segments were introduced to induce local plasticization thus enhancing the PLLA chains mobility. Consequently, the crystallization behavior of the PEA/PLLA blends was investigated.
Non-Isothermal crystallization behavior
DSC cooling curves from the melt and subsequent heating curves of PLLA and PLLA/PEA blends are shown in Figure 4. From the cooling curves collected at a cooling rate of 5°C.min-1, it
is noteworthy that neat PLLA displayed a very small exothermic peak compared to the blends. Moreover the onset of PLLA crystallization moves from 115°C to 130°C. This indicates an enhanced crystalline ability during cooling of PLLA when PEA is dispersed in the matrix. A second smaller exothermic peak is noticed around 93°C which corresponds to the crystallization of the dispersed PEA phase. By subsequent heating of the samples, cold crystallization of neat PLLA is logically observed at 111°C. Interestingly, no visible cold crystallization was observed for the blends except for the PLLA/PEA (95/5: w/w) blend that showed a small exotherm at 98°C. This value is slightly lower than the cold crystallization of neat PLLA (111°C) indicating an enhanced crystalline ability. The absence of cold crystallization for the blends with higher contents of PEA may suggest important crystallization of the PLLA phase during cooling. However, a small endothermic peak assigned to the melting transition of the PEA phase at around 106°C is situated in the temperature window of cold-crystallization of PLLA phase. Thus, the superimposition of these two physical transitions doesn’t allow the exact determination of both the cold-crystallization enthalpy and the crystallinity of the PLLA phase. Melting of
PLLA phase occurred in all cases (neat PLLA and blends) at 177°C indicating that the dispersion of PEA into the matrix has no influence on the melting transition of PLLA.
Figure 4: (a) Cooling curves and (b) heating curves of neat PLLA and the blends – 5°C.min-1
from 0°C to 200°C
By measuring the heat of fusion ΔHm and heat of cold crystallization ΔHcc, an estimation of the
crystallinity of the PLLA phase in the blends can be determined using the equation (2)
𝝌𝒄 =𝜟𝑯𝒎−𝜟𝑯𝒄𝒄 𝜟𝑯𝒎𝟎 ×
𝟏𝟎𝟎 𝝎 (2)
Where ΔHm0 is the enthalpy of fusion of the completely crystalline state (93 J.g-1 for PLLA) and
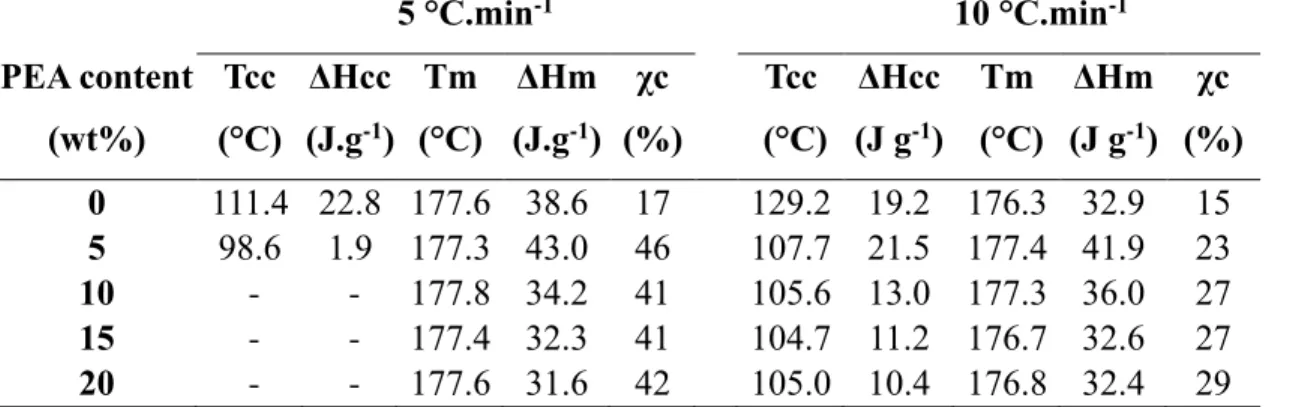
ω the weight fraction of PLLA in the blend. Values of enthalpies and temperatures of fusion and cold crystallization as well as values of estimated crystallinity degrees of the PLLA phase are displayed in Table 2. Two cooling and heating rates were employed during DSC analyses (5°C.min-1 and 10°C.min-1). It is noticeable that cooling and heating rates have a strong influence
on the crystallization kinetic. Indeed, while at 5°C.min-1 no or almost no cold crystallization was
peak was observed for all the samples (Figure S5). This suggests that PLLA phase could not fully crystallize at the higher heating rate, leading to a drop of PLLA crystallinity. Indeed, the crystallinity of PLLA phase in the PLLA/PEA (90/10: w/w) blend goes from 41% to 27% depending on the cooling rate. However, even at 10 °C.min-1, the crystalline ability of PLLA was
enhanced by the dispersion of the PEA phase. Indeed, the incorporation of PEA in the blend decreased the cold crystallization temperature by approximate 15°C and narrowed the peak width. Moreover, values of crystallinity were higher for the blends than for neat PLLA (15% for neat PLLA to 29% for the blend comprising 20wt% of PEA).
Table 2: Cold-crystallization and melting parameters of neat PLLA and blends at different
heating rates 5 °C.min-1 10 °C.min-1 PEA content (wt%) Tcc (°C) ΔHcc (J.g-1) Tm (°C) ΔHm (J.g-1) χc (%) Tcc (°C) ΔHcc (J g-1) Tm (°C) ΔHm (J g-1) χc (%) 0 111.4 22.8 177.6 38.6 17 129.2 19.2 176.3 32.9 15 5 98.6 1.9 177.3 43.0 46 107.7 21.5 177.4 41.9 23 10 - - 177.8 34.2 41 105.6 13.0 177.3 36.0 27 15 - - 177.4 32.3 41 104.7 11.2 176.7 32.6 27 20 - - 177.6 31.6 42 105.0 10.4 176.8 32.4 29
Tcc and Tm are the cold crystallization temperature and the melting temperature of PLLA phase respectively. ΔHcc and ΔHm are the corresponding enthalpy values. χc is the crystallinity ratio of PLLA phase calculated from equation (2).
The improvement of the crystalline ability of PLLA by dispersion of polymer additives has been observed by several research groups. It was claimed that the additives proceed by two manners. In a first case, the increase of the PLLA crystallinity is due to an increase in nucleus number while the growth rate (G) of the spherulites remains unchanged. In a second case, the nucleus number is lowered while the growth rate increases.53 Polarized optical images (figure 5, figure
S6 and Figure S7) clearly show that the first mechanism is responsible of the crystallization
behavior of PLLA blends.
Figure 5: Cold-crystallization of neat PLLA and the PLLA/PEA (90/10: w/w). The samples that
were previously molten for 3 minutes at 200°C and subsequently quenched then the sample are heating up at 10°C.min-1 and observed under polarized microscope.
Isothermal crystallization behavior by DSC
To further confirm the enhancement of PLLA crystallization rate, isothermal crystallization investigation was conducted by DSC analyses. To that aim, samples were melted at 200°C for 3 minutes and subsequently cooled at 110°C (note: this corresponds to the maximum of PLLA crystallization determined by DSC). The isothermal crystallization data were then fitted to the Avrami equation.60
Figure 6: Avrami plot - Effect of the PEA amount on isothermal crystallization (110°C) of
PLLA phase
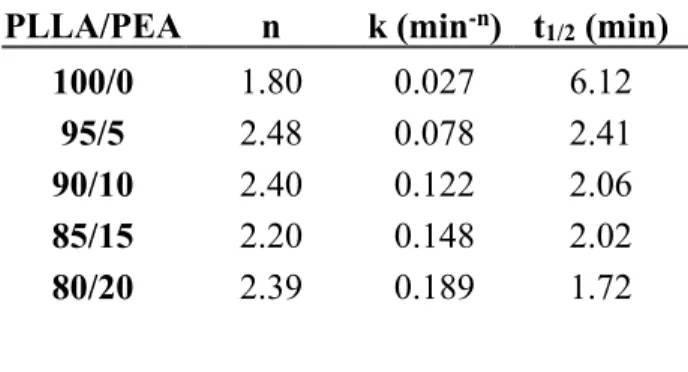
The Avrami plot for the different samples showed good linear relationship in agreement with Avrami equation. The half-time of crystallization t1/2 was calculated for each (Table 3). It is
noticeable that the half-time of PLLA crystallization is significantly decreased by the incorporation of PEA. Indeed t1/2 for neat PLLA is 6.12 min while for the PLLA/PEA (95/5:
w/w) blend, this value dropped to 2.41 min. The addition of more PEA into PLLA matrix slightly reduces the crystallization half-time. This feature is in accordance with the observations made during non-isothermal crystallization studies. The enhancement of the crystallinity and the crystallization rate of PLLA for physical blends are well-known and have been previously described for other systems.35, 55 This phenomenon has been attributed to interactions which are
taking place at the interface of the phase-separated domains creating favorable nucleation sites -1,4 -1,2 -1 -0,8 -0,6 -0,4 -0,2 0 0,2 0,4 0,6 0 0,1 0,2 0,3 0,4 0,5
log(
-ln(1
-α
c))
log t (min)
80-20 85-15 90-10 95-5 neat PLLAfor crystallization. We could then hypothesize that PEA creates interactions with the PLLA phase thus lowering the nucleation barrier.
Table 3: Isothermal crystallization parameters of neat PLLA and the blends (110°C).
PLLA/PEA n k (min-n) t1/2 (min)
100/0 1.80 0.027 6.12 95/5 2.48 0.078 2.41 90/10 2.40 0.122 2.06 85/15 2.20 0.148 2.02 80/20 2.39 0.189 1.72 Mechanical properties.
The toughening of PLLA by dispersion of the PEA elastomer was then investigated; mechanical testing and dynamical mechanical analysis were thus carried out.
Toughening evaluation of the blends
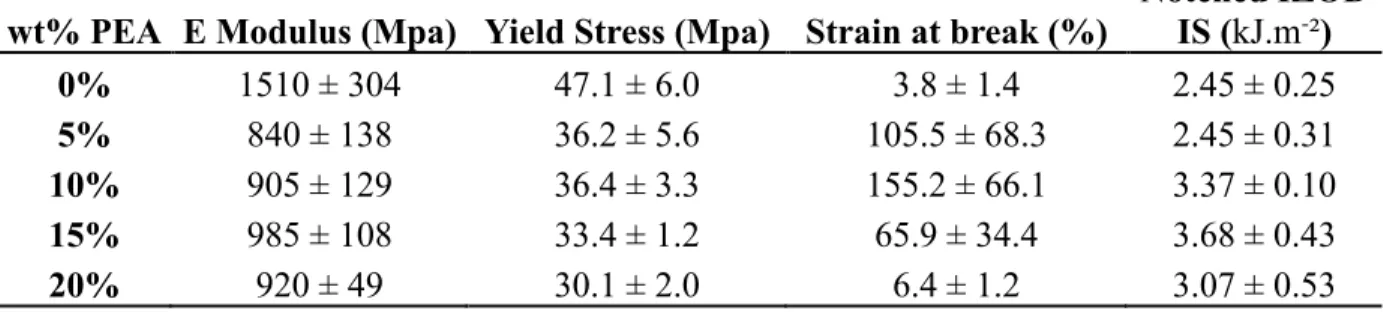
The flexibility and impact strength of PLLA were evaluated thanks to tensile experiments as well as impact testing. As seen from the tensile stress-strain curves displayed in Figure 7, the fracture behavior of the specimen changed from a brittle fracture for neat PLLA to a ductile fracture for the blends. For PLLA, the sample is thought to break by neck instability resulting in low elongation at break value (only 3.8%). On the contrary, all the blends showed distinct yielding (stress yield) and stable neck growth. Even at 5wt% of PEA, the elongation of the blend was significantly increased (>100%) (Table 4). This suggests that large energy dissipation occurred owing to the presence of PEA. Further increase in elongation at break was noticed for 10wt% of PEA; however, for higher amounts of dispersed phase, it dropped tremendously to 6.4% for the
PLLA/PEA (80/20: w/w) blend. The poor mechanical properties of the blends for higher contents of PEA can be explained by bigger dispersed phase particles coupled with high heterogeneity of the domain size (See Table 1 and Figure 3). This observation shows the important effect of the microstructure of the blend on its mechanical properties. We also logically observed a decrease in the Young’s modulus by addition of PEA into the PLLA matrix. Indeed while neat PLLA shows a Young’s modulus of 1.51GPa, the blend containing 5wt% of PEA exhibits a value of 0.84GPa. Further addition of PEA only slightly impacts the Young’s modulus. Finally, yield stress was decreasing with the addition of PEA. Yield stress changed from 47.1MPa for neat PLLA to 30.1MPa for the blend with 20wt% of PEA.
Impact toughness of the blends was then measured by notched IZOD impact strength test. Surprisingly, incorporation of 5wt% of PEA resulted in no changes in the impact strength value (2.45 kJ.m-²). However from 10wt% to 15wt% of PEA in the material, impact strength increased
up to 3.68 kJ.m-².
In terms of mechanical properties, it seems that the blends containing 10wt% and 15wt% of PEA are the most promising materials for the toughening of PLLA. Indeed for these materials, only limited depression of the Young’s modulus and the yield stress values were observed in comparison to neat PLLA and significant improvement in the strain at break and the impact strength were noticed.
Table 4: Mechanical properties of neat PLLA and the blends.
wt% PEA E Modulus (Mpa) Yield Stress (Mpa) Strain at break (%) Notched IZOD IS (kJ.m-²)
0% 1510 ± 304 47.1 ± 6.0 3.8 ± 1.4 2.45 ± 0.25 5% 840 ± 138 36.2 ± 5.6 105.5 ± 68.3 2.45 ± 0.31 10% 905 ± 129 36.4 ± 3.3 155.2 ± 66.1 3.37 ± 0.10 15% 985 ± 108 33.4 ± 1.2 65.9 ± 34.4 3.68 ± 0.43 20% 920 ± 49 30.1 ± 2.0 6.4 ± 1.2 3.07 ± 0.53 CONCLUSION
A novel poly(ester-amide) (PEA) rubber derived from fatty acids feedstock was synthesized and subsequently used as impact modifier of PLLA. The PEA fulfilled all the requirements for effective toughening of PLLA as seen from its low Tg (-28°C), its low elastic modulus (191 MPa), its thermal stability at the processing temperature of PLLA as well as its theoretical immiscibility with PLLA. PEA was then melt-blended with PLLA by twin-screw extrusion
resulting in typical two-phase polymer alloys. The processability of the blends was evaluated by thermal stability investigations that revealed no significant thermal degradation in the PLLA processing temperature window as well as by rheological measurements that showed improved melt elasticity of the blends in comparison to neat PLLA. The immiscible morphology of the blends predicted by the solubility parameters of the two components was confirmed by SEM images, rheological investigations as well as DMA measurements. Very interestingly, the crystallization behavior of the blends was also improved by the addition of PEA as seen from the higher crystallization rates observed both during non-isothermal and isothermal crystallization studies. Indeed, during isothermal crystallization at 110°C, the half-time of crystallization dropped from 6.12 min for neat PLLA to 1.72 min for the blend with a PEA content of 20wt%. Finally the toughening efficiency of this system was checked by tensile experiments as well as notched IZOD impact testing. A transition from brittle fracture to ductile fracture was observed during tensile tests with PEA contents as low as 5wt%. Maximum elongation at break was observed for 10wt% of PEA (155%) without severe loss in tensile strength and modulus. Notched IZOD impact strength also increased with the incorporation of PEA rubber particles.
EXPERIMENTAL
Materials. Methyl 10-undecenoate (UndME) (>98.0%), 2-mercaptoethanol (MCET, 98%) and
1,4-diaminobutane (99%) were supplied by TCI, Europe. 1,5,7-triazabicyclo[4.4.0]dec-5-ene (TBD, 98%) and N-Methyl-2-pyrrolidone (NMP) were obtained from Sigma-Aldrich. Dimer Fatty Acid (DFA) (Pripol 1009 from Croda) was kindly provided by ITERG (Pessac-France). Poly(L-lactide) (PLLA) was kindly provided by PURAC (Netherlands)(Mn= 121 kg.mol-1, D=
1.5 as determined by size-exclusion chromatography in THF). All products and solvents (reagent grade) were used as received.
Measurements. Size exclusion chromatography (SEC) analyses were performed in THF (40°C)
on a PL-GPC 50 plus Integrated GPC from Polymer laboratories-Varian with a series of four columns from TOSOH (TSKgel TOSOH: HXL-L (guard column 6,0mm ID x 4,0cm L); G4000HXL (7,8mm ID x 30,0cm L) ;G3000HXL (7,8mm ID x 30,0cm L) and G2000HXL (7,8mm ID x 30,0cm L)). The elution of the filtered samples was monitored using simultaneous refractive index and UV detection. The elution times were converted to molar mass using a calibration curve based on low dispersity (Mw/Mn) polystyrene (PS) standards. Differential
scanning calorimetry (DSC) thermograms were measured using a DSC Q100 apparatus from TA instruments. Each sample was first melted for 3min at 200°C to remove previous thermal history. Non-isothermal crystallization behaviors were evaluated by cooling the samples to 0°C at 5°C.min-1 or 10°C.min-1 and reheating up to 200°C at 5°C.min-1 or 10°C.min-1. Measurement of
the glass transition temperature (Tg), cold crystallization temperature (Tcc) and melting temperature (Tm) was then performed. Isothermal crystallization investigation was performed by rapid cooling (50°C.min-1) of the samples from the melt to 110°C and by keeping the samples at
this temperature for 30 min. The exothermic curves of heat flow as a function of time were recorded. Thermogravimetric analyses (TGA) were performed on TGA-Q50 system from TA inst ruments at a heating rate of 10 °C.min-1 under nitrogen atmosphere. To determine the mechanical
properties of the polymers, tensile stress and tensile strain were obtained using a dynamic mechanical analyzer (DMA), a model RSA-III apparatus from TA Instruments equipped with a liquid nitrogen cooling system, in traction transient mode at a rate of 10mm.min-1. Tensile tests
were performed on polymers processed into films using a simple hot-press technique. The effective length, width, and thickness of the specimens were 10, 2.5, and 0.5 mm, respectively. Tensile tests were carried out after the processed specimens were let overnight at room
temperature. An average value of seven replicated measurements was taken for each sample. Notched Izod impact tests were performed according to ASTM D256 using an AIS multi impact XJF-5.5 pendulum impact tester. Optical images were obtained using an Axioskop 40 Zeiss polarizing microscope equipped with a digital camera (Canon Powershot A640) connected to the computer. The spherulite morphology was observed in thin films prepared between microscope coverslips. Blend morphologies were observed under scanning electronic microscopy (SEM) analyses on a JEOL JSM 2500 apparatus. Observations were carried out both on cryo-fractures surface or impact-fractures surfaces. The samples were metallized with gold prior to observation. The rheological properties of the blends in the molten state were assessed using a parallel-plate (
d = 25 mm) rheometer (AR 2000 rheometer from TA instruments). The sample was loaded betw
een the parallel plates and melted at 190 ° C for 3 min. The parallel plates subsequently compress ed the sample to 1.000 mm thick prior to each test. A dynamic frequency sweep test was perform ed to determine the viscoelastic properties of the blends. The strain and frequency range used dur ing testing were 5% and 500–0.05 rad.s − 1, respectively. Complex viscosity ( η ∗ ), storage modu
lus ( G ′ ), and loss modulus ( G ″ ) in the molten state were obtained.
Poly(ester-amide) synthesis
Both UndBdA-diol and the Dimerized fatty acid (DFA-Pripol 1009) were dried at 70°C under vacuum overnight prior to use. A mixture of UndBdA-diol (6.750 g), DFA (7.047 g) and titanium tetra-n-butoxide (84 mg) was stirred at 160°C under dynamic vaccum. After 1h, the temperature was raised to 180°C for 5 hours and then to 200°C for 2 hours. After completion of the reaction, the polymer was dissolved in dichloromethane, precipitated into methanol, filtered and dried under reduced pressure.
1H-NMR (400 MHz, CDCl
3, δ): 0.88 (m, -CH2-CH3), 1.00-1.80 (m, -[CH2]-), 2.16 (t, -CH2
-CONH-), 2.31 (t, -CH2-COO-), 2.55 (t, -S-CH2-CH2-), 2.73 (t, -COO-CH2-CH2S), 3.28 (m,
-CH2-NH-CO-), 4.21 (t, -COO-CH2-CH2-), 5.82 (m, -CO-NH-CH2-).
Blend preparation
Prior to extrusion, PLLA pellets and PEA were dried at least 12h at 80°C in an oven under reduced pressure. Melt-blending of PEA with PLLA was realized using a DSM twin-screw micro-compounder (5cc) at 190°C and 50 rpm for 5 minutes. Impact test bars (dimensions 12.7 × 50 × 3.2 mm) were prepared by injection molding at 200°C in a mold kept at 50°C.
ASSOCIATED CONTENT
Supporting Information. 1H-NMR spectra of PEA/ DSC thermograph of PEA/ physical
properties of PEA and PLLA/ stress-strain curve of PEA/ TGA derivative curves of the two homopolymers and the blends/ cooling curves and heating curves of neat PLLA and the blends – 10°C.min-1/cold-crystallization optical polarized images of neat PLLA and the PLLA/PEA
(90/10:w/w)/ relative crystalline surface area measured on optical microscopy images taken during non-isothermal crystallization of neat PLLA and the PLLA/PEA (90/10 : wt/wt) blend/ Avrami model details/ zoomed-up SEM images of Figure 9.
AUTHOR INFORMATION
Corresponding Author
* [email protected] ACKNOWLEDGMENT
The authors thank Patrick Garrigue for SEM imaging (Nsysa-ISM, University of Bordeaux-CNRS). The authors also thank Emmanuel Ibarboure and Gérard Dimier for fruitful discussions. This study was financially supported by the University of Bordeaux-1, ANR, IPB, CNRS, Aquitaine Council, ITERG, ONIDOL and ADEME agency.
REFERENCES
1. D. Garlotta, Journal of Polymers and the Environment, 2001, 9, 63-84.
2. R. Mehta, V. Kumar, H. Bhunia and S. N. Upadhyay, Journal of Macromolecular Science, Part C, 2005,
45, 325-349.
3. J. M. Becker, R. J. Pounder and A. P. Dove, Macromolecular Rapid Communications, 2010, 31, 1923-1937.
4. R. Auras, B. Harte and S. Selke, Macromolecular Bioscience, 2004, 4, 835-864. 5. A. P. Gupta and V. Kumar, European Polymer Journal, 2007, 43, 4053-4074.
6. K. S. Anderson, K. M. Schreck and M. A. Hillmyer, Polymer Reviews, 2008, 48, 85-108. 7. H. Liu and J. Zhang, Journal of Polymer Science Part B: Polymer Physics, 2011, 49, 1051-1083.
8. C. B. Bucknall, in Comprehensive Polymer Science and Supplements, ed. A. Editor-in-Chief: Sir Geoffrey, Pergamon, Amsterdam, 1989, pp. 27-49.
9. J. H. Choi, K. H. Ahn and S. Y. Kim, Polymer, 2000, 41, 5229-5236.
10. NatureWorks. Technology Focus Report: Toughened PLA, http://www.natureworksllc.com/
11. J. Odent, P. Leclère, J.-M. Raquez and P. Dubois, European Polymer Journal, 2013, 49, 914-922.
12. K. S. Anderson, S. H. Lim and M. A. Hillmyer, Journal of Applied Polymer Science, 2003, 89, 3757-3768. 13. K. S. Anderson and M. A. Hillmyer, Polymer, 2004, 45, 8809-8823.
14. Y. Feng, Y. Hu, J. Yin, G. Zhao and W. Jiang, Polymer Engineering & Science, 2013, 53, 389-396. 15. P. Ma, D. G. Hristova-Bogaerds, J. G. P. Goossens, A. B. Spoelstra, Y. Zhang and P. J. Lemstra, European
Polymer Journal, 2012, 48, 146-154.
16. B. Meng, J. Deng, Q. Liu, Z. Wu and W. Yang, European Polymer Journal, 2012, 48, 127-135.
17. N. Petchwattana, S. Covavisaruch and N. Euapanthasate, Materials Science and Engineering: A, 2012, 532, 64-70.
18. K. Hashima, S. Nishitsuji and T. Inoue, Polymer, 2010, 51, 3934-3939.
19. R. Qi, M. Luo and M. Huang, Journal of Applied Polymer Science, 2011, 120, 2699-2706. 20. Y. Li and H. Shimizu, European Polymer Journal, 2009, 45, 738-746.
21. H. Liu, F. Chen, B. Liu, G. Estep and J. Zhang, Macromolecules, 2010, 43, 6058-6066. 22. Z. Su, Q. Li, Y. Liu, G.-H. Hu and C. Wu, European Polymer Journal, 2009, 45, 2428-2433.
23. X. Zhang, Y. Li, L. Han, C. Han, K. Xu, C. Zhou, M. Zhang and L. Dong, Polymer Engineering & Science, 2013, 53, 2498-2508.
24. N. López-Rodríguez, A. López-Arraiza, E. Meaurio and J. R. Sarasua, Polymer Engineering & Science, 2006, 46, 1299-1308.
25. L. Wang, W. Ma, R. A. Gross and S. P. McCarthy, Polymer Degradation and Stability, 1998, 59, 161-168. 26. M. Harada, K. Iida, K. Okamoto, H. Hayashi and K. Hirano, Polymer Engineering & Science, 2008, 48,
1359-1368.
27. T. Semba, K. Kitagawa, U. S. Ishiaku and H. Hamada, Journal of Applied Polymer Science, 2006, 101, 1816-1825.
28. R. Wang, S. Wang, Y. Zhang, C. Wan and P. Ma, Polymer Engineering & Science, 2009, 49, 26-33. 29. M. Harada, T. Ohya, K. Iida, H. Hayashi, K. Hirano and H. Fukuda, Journal of Applied Polymer Science,
2007, 106, 1813-1820.
30. N. Zhang, Q. Wang, J. Ren and L. Wang, Journal of Materials Science, 2009, 44, 250-256. 31. L. Jiang, M. P. Wolcott and J. Zhang, Biomacromolecules, 2005, 7, 199-207.
32. K. M. Schreck and M. A. Hillmyer, Journal of Biotechnology, 2007, 132, 287-295.
34. Y. Takagi, R. Yasuda, M. Yamaoka and T. Yamane, Journal of Applied Polymer Science, 2004, 93, 2363-2369.
35. H. Kang, B. Qiao, R. Wang, Z. Wang, L. Zhang, J. Ma and P. Coates, Polymer, 2013, 54, 2450-2458. 36. M. L. Robertson, K. Chang, W. M. Gramlich and M. A. Hillmyer, Macromolecules, 2010, 43, 1807-1814. 37. L. Montero de Espinosa and M. A. R. Meier, European Polymer Journal, 2011, 47, 837-852.
38. M. A. R. Meier, Macromolecular Chemistry and Physics, 2009, 210, 1073-1079.
39. L. Maisonneuve, T. Lebarbé, E. Grau, and H. Cramail, Polym. Chem., 2013, 4, 5472–5517.
40. D. V. Palaskar, A. Boyer, E. Cloutet, J.-F. Le Meins, B. Gadenne, C. Alfos, C. Farcet and H. Cramail,
Journal of Polymer Science Part A: Polymer Chemistry, 2012, 50, 1766-1782.
41. L. Maisonneuve, T. Lebarbe, T. H. N. Nguyen, E. Cloutet, B. Gadenne, C. Alfos and H. Cramail, Polymer
Chemistry, 2012, 3, 2583-2595.
42. H. Mutlu and M. A. R. Meier, European Journal of Lipid Science and Technology, 2010, 112, 10-30. 43. T. Lebarbe, L. Maisonneuve, T. H. Nga Nguyen, B. Gadenne, C. Alfos and H. Cramail, Polymer
Chemistry, 2012, 3, 2842-2851.
44. H.-K. Chuang and C. D. Han, Journal of Applied Polymer Science, 1984, 29, 2205-2229. 45. C. D. Han, Journal of Applied Polymer Science, 1988, 35, 167-213.
46. Q. Xing, X. Zhang, X. Dong, G. Liu and D. Wang, Polymer, 2012, 53, 2306-2314. 47. K. S. Anderson and M. A. Hillmyer, Polymer, 2006, 47, 2030-2035.
48. J. Narita, M. Katagiri and H. Tsuji, Macromolecular Materials and Engineering, 2011, 296, 887-893. 49. J. Narita, M. Katagiri and H. Tsuji, Macromolecular Materials and Engineering, 2013, 298, 270-282. 50. T. Furukawa, H. Sato, R. Murakami, J. Zhang, Y.-X. Duan, I. Noda, S. Ochiai and Y. Ozaki,
Macromolecules, 2005, 38, 6445-6454.
51. Y. Hu, H. Sato, J. Zhang, I. Noda and Y. Ozaki, Polymer, 2008, 49, 4204-4210. 52. M. Zhang and N. L. Thomas, Advances in Polymer Technology, 2011, 30, 67-79.
53. H. Tsuji, M. Sawada and L. Bouapao, ACS Applied Materials & Interfaces, 2009, 1, 1719-1730. 54. J.-T. Yeh, C.-J. Wu, C.-H. Tsou, W.-L. Chai, J.-D. Chow, C.-Y. Huang, K.-N. Chen and C.-S. Wu,
Polymer-Plastics Technology and Engineering, 2009, 48, 571-578.
55. M. Shibata, Y. Inoue and M. Miyoshi, Polymer, 2006, 47, 3557-3564.
56. J. Cai, M. Liu, L. Wang, K. Yao, S. Li and H. Xiong, Carbohydrate Polymers, 2011, 86, 941-947. 57. T. Ke and X. Sun, Journal of Applied Polymer Science, 2003, 89, 1203-1210.
58. A. Pei, Q. Zhou and L. A. Berglund, Composites Science and Technology, 2010, 70, 815-821. 59. R. Zhang, Y. Wang, K. Wang, G. Zheng, Q. Li and C. Shen, Polymer Bulletin, 2013, 70, 195-206. 60. A. T. Lorenzo, M. L. Arnal, J. Albuerne and A. J. Müller, Polymer Testing, 2007, 26, 222-231. 61. W. G. Perkins, Polymer Engineering & Science, 1999, 39, 2445-2460.
Supporting information
Fatty Acid-Based Thermoplastic Poly(Ester-Amide)
as toughening and crystallization improver of
Poly(L-lactide)
Thomas Lebarbé,1,2,3 Etienne Grau,1,2 Carine Alfos4 and Henri Cramail*1,2
1Université de Bordeaux, Laboratoire de Chimie des Polymères Organiques, ENSCBP,
16 Avenue Pey-Berland, Pessac Cedex, F 33607 France.
2CNRS, Laboratoire de Chimie des Polymères Organiques, Pessac Cedex, F 33607,
France.
3French Environment and Energy Management Agency, 20 avenue du Grésillé-BP 90406,
AngersCedex 01, F 49004, France
Figure S1.1H-NMR spectrum of PEA in CDCl 3.
Figure S2. DSC thermograph of PEA. Second heating curve (10°C.min-1).
Table S1. Thermomechanical properties of PEA and PLLA.
Material 𝑴̅𝒘 (kg.mol-1)a Đa Tg (°C)b Tm (°C)b E (MPa)c
PLLA 181 1.5 61 175 1 510 ± 304
PEA 27 1.6 -28 109 191 ± 1
(a) SEC in THF, PS calibration, (b) DSC 10°C.min-1, (c) Tensile tests, v = 10mm.min-1.
Figure S4. TGA derivative curves of the two homopolymers (PLLA & PEA) and the
blends thereof – 10°C.min-1.
Figure S5. (a) cooling curves and (b) heating curves of neat PLLA and of PEA/PLLA
Figure S6: Cold-crystallization of neat PLLA and of the PLLA/PEA (90/10: w/w) blend during
heating at 10°C.min-1 the samples that were previously molten for 3 minutes at 200°C and
Regarding neat PLLA, cold-crystallization seems to start around 110°C as seen from the spherulites formation in Figure 5e. The spherulites density at this temperature is quite low indicating the beginning of the cold-crystallization process. At higher temperature (Figure 5g), the spherulites density stays low; however an increase in their size is noticed. In the case of the blend, cold-crystallization started at lower temperature as seen from the first crystallites distinguished at 100°C. This feature is in agreement with the lower cold-crystallization temperature observed through DSC experiments (See Figure S5 and Table 2). The size of the crystallites does not increase significantly with the temperature; nevertheless their density becomes more important. It is also noteworthy that no distinguishable spherulites were observed for the blend contrary to neat PLLA. From these images, we can conclude that improvement of the cold-crystallization occurred via an increase in nucleus number and not from an enhancement of the growth rate. The crystalline surface area was measured on optical images taken for neat PLLA and the blend at different temperatures (Figure S7). While for neat PLLA, the crystalline surface area at 110°C counts for 0.4% of the total area, the crystalline surface area of the blend represents 10.5% of the total area. This observation confirms the enhanced cold-crystallization of PLLA by addition of PEA which acts as a nucleating-assisting agent of PLLA.
Figure S7. relative crystalline surface area measured on optical microscopy images taken
during non-isothermal crystallization of neat PLLA and the PLLA/PEA (90/10 : wt/wt) blend
Avrami model for isothermal crystallization investigation:
𝜶𝒄 = 𝟏 − 𝒆𝒙𝒑(𝒌. 𝒕𝒏) (S1)
where, αc is the relative crystalline volume fraction of the polymer as a function of time, k the
rate constant of crystallization and n the Avrami index. αc is the degree of crystallinity at time t
and is obtained from dividing the area under exothermic peak in DSC isothermal crystallization analysis at a crystallization time t by the total area. By taking the double logarithm of equation (S1), equation (S2) was obtained:
𝒍𝒐𝒈[− 𝒍𝒏(𝟏 − 𝜶𝒄)] = 𝒍𝒐𝒈𝒌 + 𝒏𝒍𝒐𝒈𝒕 (S2) 0 2 4 6 8 10 12 14 16 18 100 120 140 160 Crystallin e surface area (%) Temperature (°C) Neat PLLA 10% PEA
From the intercepts and the slopes of log[-ln(1-αc)] versus log t, the values of k and n were
calculated respectively (Figure 6 and Table 3). The crystallization half-time was also determined from equation S3.
𝒕𝟏/𝟐= (𝒍𝒏 𝟐
𝒌 ) 𝟏/𝒏
(S3)
Figure S9: SEM images of the impact fractured surfaces of the blends. Images were taken close