SUPPORTING INFORMATION
Structural characterization of suppressor lipids by high-resolution mass
spectrometry
Mary Joy Rovillos1, Josch Konstantin Pauling1, Hans Kristian Hannibal-Bach1, Christine
Vionnet2, Andreas Conzelmann2 and Christer S. Ejsing1*
1Department of Biochemistry and Molecular Biology, VILLUM Center for Bioanalytical Sciences,
University of Southern Denmark, Odense, Denmark
2Division of Biochemistry, Department of Biology, University of Fribourg, Fribourg, Switzerland
Figure S1. Structural characterization of synthetic PI 17:0/20:4. (A) TOF MS/MS spectrum of
m/z 871.5 ([PI 17:0/20:4-H]-) acquired using CE at 64 eV. (B) FTMS2 spectrum of m/z 871.5 ([PI 17:0/20:4-H]-) acquired using CID and CE at 34%.
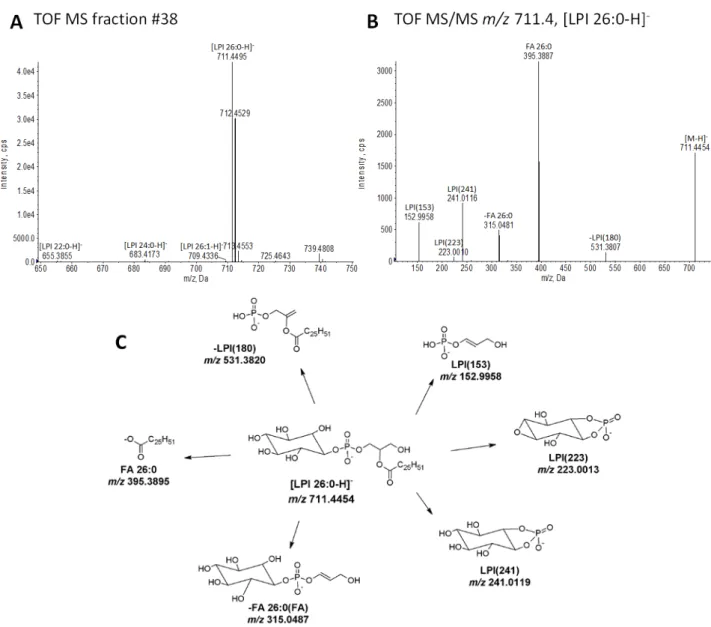
Figure S2. Structural characterization of LPI 26:0. (A) FTMS spectrum of fraction #38. (B)
TOF MS/MS spectrum of m/z 711.4 ([LPI 26:0-H]-). (C) Tentative structures and predominant
fragmentation pathways of LPI 26:0. Specified m/z values are calculated based on the chemical composition of depicted structures.
Figure S3. Structural characterization of LPIM 26:0. (A) FTMS spectrum of fraction #36. (B)
TOF MS/MS spectrum of m/z 873.5 ([LPIM 26:0-H]-). (C) Tentative structures and predominant fragmentation pathways of LPIM 26:0. Specified m/z values are calculated based on the chemical composition of depicted structures.
Figure S4 (continued).
Figure S4. Structural characterization of LPIMIP 26:0. (A) FTMS spectrum of fraction #41. (B)
TOF MS/MS spectrum of m/z 1115.5 ([LPIMIP 26:0-H]-). (C) TOF MS/MS spectrum of m/z 557.2 ([LPIMIP 26:0-2H]2-). (D) Tentative structures and predominant fragmentation pathways of singly charged LPIMIP 26:0. (E) Tentative structures and predominant fragmentation pathways of doubly charged LPIMIP 26:0. Specified m/z values are calculated based on the chemical composition of depicted structures.
![Figure S1. Structural characterization of synthetic PI 17:0/20:4. (A) TOF MS/MS spectrum of m/z 871.5 ([PI 17:0/20:4-H] - ) acquired using CE at 64 eV](https://thumb-eu.123doks.com/thumbv2/123doknet/14945905.667421/1.892.89.802.630.1008/figure-structural-characterization-synthetic-tof-spectrum-acquired-using.webp)