HAL Id: hal-02417406
https://hal.archives-ouvertes.fr/hal-02417406
Submitted on 18 Dec 2019
HAL is a multi-disciplinary open access
archive for the deposit and dissemination of
sci-entific research documents, whether they are
pub-lished or not. The documents may come from
teaching and research institutions in France or
abroad, or from public or private research centers.
L’archive ouverte pluridisciplinaire HAL, est
destinée au dépôt et à la diffusion de documents
scientifiques de niveau recherche, publiés ou non,
émanant des établissements d’enseignement et de
recherche français ou étrangers, des laboratoires
publics ou privés.
Variance Reduction and Graphic Features of TRIPOLI-4
Monte Carlo- Code for ITER Neutronics Calculations
Yk. Lee
To cite this version:
Yk. Lee. Variance Reduction and Graphic Features of TRIPOLI-4 Monte Carlo- Code for ITER
Neu-tronics Calculations. ISFNT-2017, The 13th International Symposium on Fusion Nuclear Technology
(ISFNT), Sep 2017, Kyoto, Japan. �hal-02417406�
_______________________________________________________________________________ Corresponding author: yi-kang.lee@cea.fr
Variance Reduction and Graphic Features of TRIPOLI-4
®Monte Carlo
Code for ITER Neutronics Calculations
Yi-Kang Lee
DEN, Service d’étude des réacteurs et de mathématiques appliquées (SERMA), CEA, Université Paris-Saclay, F-91191 Gif-sur-Yvette, France
The International Thermonuclear Experimental Reactor (ITER) is currently under construction in France. From the radiation shielding and radiation protection points of view, an intense and large neutron source with energy around 14.1 MeV will be generated from the D-T plasma zone during the ITER operation and diverse gamma-ray sources from neutron activation of the cooling water and structure materials should be considered for the reactor operation and maintenance. To decrease the radiation impacts caused by these neutron and gamma sources, iterative designs and nuclear analyses of ITER components are currently performed with three dimensional Monte Carlo radiation transport calculations. Due to the important dimensions of ITER, the thick tokamak blanket modules, and the diagnostic and functional port openings, variance reduction (VR) techniques are essential in these Monte Carlo neutron transport calculations. To verify the reactor components design models and to check the radiation transport calculation results, advanced graphic features of the calculation tool are necessary. With the growing interest in using the TRIPOLI-4® Monte Carlo radiation transport code for ITER applications, the aim of this paper is to show some useful VR and graphic features of TRIPOLI-4 code with the ITER 3D computational shielding benchmark. The benchmark results reported in this paper include the axial and radial profile of the inboard TF coil heating and the neutron flux attenuation through the equatorial port plugs and shield. The performance of the TRIPOLI-4 graphic tool under its parallel calculation mode was also evaluated.
Keywords: ITER, neutronics, TRIPOLI-4® Monte Carlo code, Variance reduction, Display tool
1. Introduction
The International Thermonuclear Experimental Reactor (ITER) is currently under construction in southern France. The ITER tokamak complex is the world's largest fusion device, with a plasma major radius (R) of 6.2 m and a plasma volume of 840 m³. The fusion energy output power of this reactor is 500 MW. That means, under the deuterium-tritium (D-T) fusion operation, an intense and large neutron source with energy around 14.1 MeV will be generated from the plasma zone during the reactor operation. For the after-operation maintenance, diverse gamma-ray sources from neutron activation of the ITER structure materials must be considered in order to follow the radiation protection regulations. That is why the ITER nuclear analyses are fundamental technical challenges associated with the design, fabrication, assembly, and integration of the ITER Tokamak components. These tasks have to be compromised in order to follow the cost and schedule targets for the project [1-4].
The priority issues on current ITER nuclear analyses include the toroidal field coils (TFC) heating, the radiation streaming from neutral beam ports, the shut-down dose rates in different locations including the cryostats, and the impact of cooling water activation on radiation safety etc. To estimate these physical quantities, determination of neutron and gamma flux in different ITER tokamak components is essential.
Using traditional radiation transport codes developed under the nuclear fission backgrounds, diverse efforts are required for both deterministic and Monte Carlo codes to correctly calculate the neutron and gamma flux in ITER. From the published studies, it was confirmed that, due to the highly anisotropic scattering of fusion neutrons, the unoptimized multi-group nuclear data including their angular quadrature can be crucial for deterministic calculation results [5]. Consequently, the continuous-energy Monte Carlo radiation transport calculations were mostly performed on current ITER nuclear analyses. The deterministic transport calculations were often used only to generate variance reduction parameters for the Monte Carlo transport calculations.
From the plasma zone, ITER fusion neutrons should be transported through different radiation shielding structures including first wall (FW), blanket modules, vacuum vessel (VV) and TF magnets for both the inboard (I/B) and outboard (O/B) directions (see Fig. 1). On the I/B direction, due to the tokamak form and the limited space, the TFC are shielded with thinner shielding materials. On the O/B direction, the diagnostic and functional port openings make the fusion neutron streaming possible. Though port plugs and shield are considered in the components design, small gaps between blanket and port modules, neutral beam and diagnostic void zones, and cooling gas ducts of tritium production modules are all weak points for neutron and secondary gamma shielding.
In order to decrease the radiation impact, important steel and cooling water will be introduced into the ITER blankets and other structures so that a significant attenuation of radiation fluxes is expected. To calculate neutron and gamma transport in these heavy and thick ITER structures with heterogeneous distribution of voids and structure materials, variance reduction (VR) techniques and advanced graphic features of the calculation tools are often required. VR techniques of the Monte Carlo transport calculations are helpful to decrease the calculation load. Display tools are useful to debug, navigate, and verify the input data including geometry, materials, source terms, and VR data. Output results presented in graphic form are also helpful including the importance-map and the radiation distribution in space.
To show the capabilities of the TRIPOLI-4® Monte Carlo radiation transport code [6] for ITER applications, the computational 3D ITER benchmark was investigated in this study [7-9]. The TRIPOLI-4 calculation methods, VR techniques, and main benchmark results are reported in Section 3. Benchmark cases for I/B TFC heating and the neutron flux attenuation through the equatorial port (EP) are discussed. The features and the performance of the TRIPOLI-4 graphic tool under its parallel calculation mode are presented with different cases in Section 4.
2. Computational 3D ITER benchmark
The 3D computational ITER shielding benchmark was initially prepared to test the CAD-based geometries developed by different international teams for Monte Carlo and deterministic radiation transport codes [7-9]. Fig. 1 presents the CAD-based ITER benchmark model used in this study [10].
From the central solenoid to the outer bio-shield, this ITER benchmark model is a 40° sector of the full ITER machine. Though the model was simplified in comparison to the recent C-Lite and C models and the homogenization of some components was introduced, this 3D model presents the fundamentals of ITER and is therefore useful to validate new capabilities of the calculation tools. The materials of this model are also useful to verify the nuclear data libraries for engineering calculations of ITER applications.
Four test problems were proposed in this benchmark. The first aims at estimating the neutron wall loading (NWL). This problem is used to compare the ability to model the basic source geometry relative to the first wall geometry. The TRIPOLI-4 solutions for 18 NWL of poloidal blanket modules were previously published [10]. The purpose of the second test problem is to estimate the neutron flux and nuclear heating of the ITER divertor cassette and its support structure. The basic capability to model complex objects and the neutron responses in those objects are examined. For these two test problems, only TRIPOLI-4 built-in VR techniques were required [11-12].
The third test problem is to calculate the nuclear heating of I/B TFC in 10 axial segments with a total height of 8 meters. This problem requires the calculation
of the axial profile of the neutron and gamma heating in the TFC, summing the results for a total heating per leg of the magnet. This problem tests the ability to calculate important engineering quantities behind thick shielding of ITER blanket. For the Monte Carlo transport codes, VR techniques are required in order to improve the statistical precision of I/B TFC heating.
Fig. 1 ITER benchmark model of 40° sector [10]
The final test problem is a calculation of the neutron flux through the EP plugs and shield and into the void space behind the shield. In particular, 7 positions are defined in this void space at distance of 170 to 515 cm from the FW (see Fig. 1). This problem combines deep penetration with streaming to test the neutron transport codes ability to calculate results behind a narrow duct and through a large void.
3. TRIPOLI-4 calculations and some variance
reduction techniques for ITER
The TRIPOLI-4 has been widely used in radiation shielding, criticality safety and fission reactor physics fields to support French nuclear energy research and industrial applications. The VR techniques developed in TRIPOLI-4 were mainly applied on the PWR pressure vessel surveillance program and the nuclear facilities radiation shielding and protection. Based on the code-to-code benchmarks and the CEA internal measurements, extensive validation studies of TRIPOLI-4 have been performed on nuclear heating of research reactors, radiation damage of reactor grade steels, neutron dosimeter activation analysis, shielding materials optimization, time-of-flight D-T neutron experiments, and reactor radiation sky-shine calculations [11-17]. In this study, the geometry model and materials were prepared by using the MCAM tool [10]. 5796 volume cells and 18 materials were used to describe the 40° ITER benchmark model. A D-T fusion neutron source was set in the plasma zone. It was a 40 x 40 probability matrix with a distribution in R-Z space [7-9]. The azimuthal symmetry of the neutron source was assumed. The reflection conditions were set in 40° sector boundary surfaces. The neutron energy distribution had a peak at 14.1 MeV. The isotropic angular distribution of the neutron source was set. The source strength normalized to 500 MW was set to 1.972 E19 n/s.
Inboard TFC nuclear heating calculations
The primary function of ITER magnet system is to confine the plasma particles. The magnets surrounding the Tokamak will be cooled to very low temperatures, approximately minus 269°C, in order to keep working the superconductor coils, based on niobium-tin (Nb3Sn). The knowledge of nuclear heating levels in different I/B TFC segments is essential for an accurate cooling design analysis. Continuous-energy Monte Carlo neutron-γ coupled transport calculations enable not only to analyse the neutron and γ fluxes in the ITER Tokamak, but also to know “how many fusion neutrons, inelastic gammas, and capture gammas etc. will reach the TF coils, how much they will heat them” [2-4].
In order to benchmark against the published nuclear heating of the ten segments for two I/B TFC legs in the 40° model (Fig. 1) [7-9], two tally ways were used. The first computes directly the deposited energy of neutrons and γ for all collision events in all volume cells of the I/B TFC segments. The second, using the cylindrical mesh tally, calculates the detailed distributions of nuclear heating inside the I/B TFC segment #5.
In order to increase the calculate efficiency, the standard INIPOND VR techniques of TRIPOLI-4 were applied [11-12]. To obtain a relatively uniform standard deviations of nuclear heating in the axial segments, a cylindrical attractor surface was set on the I/B TFC zone with a radius of 2.4 m [14-15]. The fusion neutrons from the plasma zone and the collision points in blanket and VV were all pushed to this attractor surface. Two neutron energy groups with a cut at 1 MeV were used to generate the importance map. As the gamma heating dominates the total nuclear heating [17], a VR technique named photon-neutron-ratio was used to perform the splitting at emission of the secondary gamma-rays from the neutron collision sites. The secondary gamma-rays were all simulated in the neutron and γ coupled run as far as the gamma production data are available in the nuclear data libraries (CEA-V6 and FENDL-2.1). The transport of secondary gamma-rays was performed in an analog way.
Fig. 2 ITER benchmark model – the nuclear heating of the inboard toroidal field (I/B TF) coils [7-9]
Table 1: TRIPOLI-4 calculated nuclear heating distribution in segment #5 of I/B TFC legs of the ITER benchmark model
Sub-segment #
I/B TFC heating (W) in segment #5 TRIPOLI-4 (CEA-V6)
Axial Relative* Radial Relative §
1 @ 12.23 1.06 0.03 1.0E0 2 13.04 1.13 0.08 2.3E0 3 13.17 1.14 0.24 7.1E0 4 13.89 1.20 0.63 1.8E1 5 13.36 1.15 1.57 4.6E1 6 12.84 1.11 3.81 1.1E2 7 12.44 1.07 8.65 2.5E2 8 12.20 1.05 18.10 5.3E2 9 11.81 1.02 32.76 1.0E3 10 11.58 1.00 60.62 1.8E3 Total 126.44 126.44
* The segment #5 of TFC inboard leg was axially divided into 10 sub-segments to find the axial peaking ratio.
§ The segment #5 of TFC inboard leg was radially divided into 10 sub-segments to find the radial peaking ratio.
@ Axial and radial sub-segment #1 (Zmax= 83.45 cm and Rmin= 217.55 cm).
Fig. 2 shows the benchmark results [7-9]. From the segment #1 (top) to #5 (center) (Fig. 1), the TFC heating increases following the axial fusion rates. For the segment #5, the heating peak corresponds to the plasma axial center where the source intensity is the strongest [16]. For the segment #9, the second peak appears because this axial level corresponds to the divertor zone where the blanket is absent and the divertors shielding effect is smaller than the blanket one (Fig. 4). A gain of FOM (figure of merit) about 140 was obtained for the peak heating #5 by using the earlier cited VR techniques. In this segment #5, a fine mesh tally was also used with 10 sub-segments in axial and radial directions in order to study the peaking factor inside the segment (see Table 1). Axially, a peaking factor of 1.20 was obtained whereas it was 1800 radially. That means the local nuclear heating distribution in each segment is very heterogeneous. As the TFC and its stainless steel case also play a role in radiation shielding, more than 80 % of nuclear heating was deposited in the plasma side stainless steel case of the TFC and the first layer of TFC winding pack. It should be paid more attention to this heterogeneous nuclear heating in TFC for the design of forced circulation cooling systems by using the refrigerating supercritical helium. Azimuthally, the heterogeneous positions appear due to the vertical gaps between blanket modules (Fig. 5). Moreover, it should be noted that the fusion neutron activation of cooling water circulating in the blanket will generate 6.1 and 7.1 MeV gamma-rays from 16O(n,p)16N interactions. These high energy gamma-rays, heating on I/B TFC, were not considered in this benchmark model.
Outboard equatorial port neutron flux calculations
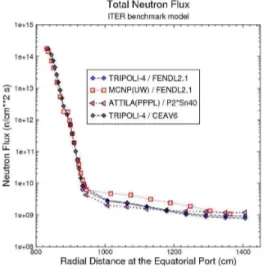
When the axial position of the I/B TFC segment #5 displays the maximum nuclear heating for TFC, the outboard equatorial ports (O/B EP), designed to receive testing mock-ups of breeding blankets called Test Blanket Modules (TBMs), will enjoy the strongest axial fusion neutron flux for tritium production. But in the same time these O/B EP positions, receiving also the diagnostic and neutral beam systems, will suffer from the toughest radiation impact during ITER operation and after-operation maintenance. That is why the thick EP port plugs and multi-layer shield were designed in the ITER benchmark model to test the shielding capability of these steel-water mixtures.
Fig. 3 shows the benchmark results. The port plugs and shield have a total thickness about 100 cm. In order to calculate the neutron flux at the equatorial port, the INIPOND VR techniques of TRIPOLI-4 were again applied but the attractor surface form was changed [11-12]. In the Fig. 3, a neutron flux attenuation factor of 5 orders of magnitude was observed. To obtain the neutron flux results in the port plug zone, the shield zone, and the void space behind the shield, a spherical attractor surface was set on the void zone with a radius of 10 cm. In the void space, the next-event point flux tally was used at several positions. It was the best choice of tally for these positions to get lower variance behind the shield.
Fig. 3 TRIPOLI-4 calculated neutron flux at the ITER equatorial port with port plug and shield [9]
4. TRIPOLI-4 graphic features for ITER
The original geometry display tool of TRIPOLI-4 was coded with native X11 graphics library twenty five years ago. It took about one minute of CPU runtime to display one 2D-view of the present ITER 3D benchmark model. Using this display tool, it was time-consuming to debug and tedious to navigate in the current ITER geometry model and material data.
In order to improve the engineering productivity, a renewed display tool T4G for TRIPOLI-4 has been developed and validated [16, 18]. This new viewer can be run in an interactive way and it is faster than the original display tool. Moreover, it can help users to
navigate in their geometry, materials, and sources for input data debug purpose (Fig. 4-6). For the intermediate and final calculation results, it can display different geometry sizes and cutting planes for local and global views (Fig. 7). Another important point for T4G tool is that it displays the exact geometry of the TRIPOLI-4 Monte Carlo simulation. It should be reminded that it is not the case for CAD viewers.
Fig. 4 TRIPOLI-4 graphic output - ITER 3D benchmark model (I/B TFC segments behind the thinner I/B VV)
Fig. 5 TRIPOLI-4 graphic output - Inboard FW, three blanket modules, vacuum vessel (yellow and orange), and two TFC legs of the ITER benchmark model
Fig. 6 TRIPOLI-4 graphic output - Equatorial port plugs, steel-water multi-layer shield, and void zone of the ITER benchmark model.
For the VR parameters tuning, T4G can be used to show the projection of the collision points and the iso-importance curves on the related geometry maps [19].
Fig. 7 shows the calculated neutron flux distribution displayed together with the background geometry. That means, using the T4G display tool, it is practical to navigate in an iterative way to verify the 3D calculated results. The iso-flux curves were also generated with the display tool to show the narrow ducts streaming effect.
Fig. 7 TRIPOLI-4 graphic output – Neutron flux distribution around the equatorial port plugs and shield of the ITER benchmark model (see Fig. 3, 4, and 6).
The recent ITER neutronic models delivered by ITER organization have important volume cells. For example the 2015 lite model and the incoming C-model have an order of magnitude of volume cells greater than the present benchmark model. In addition to display the geometry model, to show the 3D mesh-tally results requires to treat significant data, especially when the mesh size decreases in order to obtain an acceptable resolution. The parallel calculation feature of T4G tool becomes interesting for displaying these recent models. Based on the domain decomposition parallel algorithm, Fig. 8 shows the performance of this parallel calculation feature using a 6 cores PC (24 processors on Linux). The present ITER benchmark model with 5796 volume cells were displayed successively with 1, 2, 4, 8, 16, and 32 calculation threads.
Comparing to the previous X11 display tool limited to TRIPOLI-4 input geometry and materials verification, using the parallel version of T4G viewer, a gain of runtime above 30 could be easily obtained using 16 calculation threads. The interactive display function makes this tool also user-friendly for both TRIPOLI-4 input data and output results display and verification.
5. Conclusion
In this study, TRIPOLI-4® Monte Carlo shielding calculations were performed for the ITER 3D benchmark model. Different VR techniques were applied to obtain the axial and radial profiles of the inboard TF coils heating and the neutron flux attenuation through the equatorial port plugs and shield. The TRIPOLI-4 results were benchmarked against previous published ones and a satisfactory agreement was obtained. Using the benchmark model, the capability of the TRIPOLI-4 display tool was also demonstrated. The performance of this display tool was tested as well. Both the VR options and the display tool of TRIPOLI-4 were run in parallel mode. Future work will be reported on new VR options and shutdown dose rate features of TRIPOLI-4 code for ITER applications.
Fig. 8 TRIPOLI-4 display tool performance - Run with 1, 2, 4, 8, 16, and 32 parallel threads for the ITER benchmark model (5796 volume cells).
Acknowledgments
TRIPOLI-4® is a registered trademark of CEA. The author acknowledges Dr. H. Iida (retired from JAEA) for discussing the CAD/MCNP benchmark problem, Dr. M. Loughlin of ITER Organization for clarifying the TFC heating calculations, Dr. F.-X. Hugot of CEA for supporting the T4G tool, and Dr. Y. Wu and his FDS team of Chinese Academy of Sciences (CAS) for supporting the MCAM/CAD model conversion.
References
[1] B. Bigot, Nature News, 522 (2015) 149. [2] ITER web site, https://www.iter.org/mach
[3] R. Pampin et al, Xth ITER Neutronics Meeting, Cadarache, France 30 June – 3 July (2015).
[4] R. Pampin, M. J. Loughlin, J. Sanz, A. Turner, R. Villari, P.P.H. Wilson, Fusion Eng. & Design 88 (2013) 454. [5] M. Z. Youssef, R. Feder, I. M. Davis, Fusion Eng. &
Design 83 (2008) 1661.
[6] E. Brun et al., Annals of Nuclear Energy 82 (2015) 151. [7] H. Iida, ITER Neutronics Meeting, Cadarache, France 27
May (2008).
[8] P. Wilson, R. Feder, U. Fischer, M. Loughlin, L. Petrizzi, Y. Wu, et al. Fusion Eng. & Design 83 (2008) 824–833. [9] M. Z. Youssef and R. Feder, Technical Report PPPL–7352
(2007)
[10] L. Lu, Y. K. Lee et al., Nucl. Instr. and Meth. in Phys. Res. A 605 (2009) 384.
[11] O. Petit, Y. K. Lee, C. M. Diop, Progress in Nuclear Science and Technology, Vol. 4, pp. 408-412, (2014). [12] Y. K. Lee, The Joint Conf. ICRS13 & ANS RPSD-2016,
Paris, France, Oct. 3-6, 2016.
[13] Y. K. Lee and F. X. Hugot, J. Trans. Am. Nucl. Soc. 97 (2007) 523.
[14] Y. K. Lee, J. of ASTM Int., Vol 3, No. 10, pp. 1-9 (2006). [15] Y. K. Lee, The ANS’s 14th Biennial Topical Meeting of
the RPSD, Carlsbad, NM, April 2-6, 2006.
[16] Y. K. Lee and F. X. Hugot, The ANS’s 18th Topical Meeting of the RPSD, Knoxville, TN, Sep. 14-18, 2014. [17] Y. K. Lee, Fusion Eng. & Design 109-111 (2016) 1163. [18] F. X. Hugot and Y. K. Lee, Progress in Nuclear Science
and Technology, Vol. 2, pp. 851-854, (2011).
[19] M. Lei, Y. Pénéliau, Y. K. Lee, Y. Song, SOFE-2017, Shanghai, China (2017).
![Fig. 1 presents the CAD-based ITER benchmark model used in this study [10].](https://thumb-eu.123doks.com/thumbv2/123doknet/12879952.369925/3.892.483.751.219.447/fig-presents-cad-based-iter-benchmark-model-study.webp)